Honey Trend ATR Breakout Strategy
The Honey Trend ATR Breakout Strategy is a medium-term breakout strategy based on ATR indicator and Bollinger Bands for trading signal generation. It mainly monitors the trend changes of stock prices within a certain…
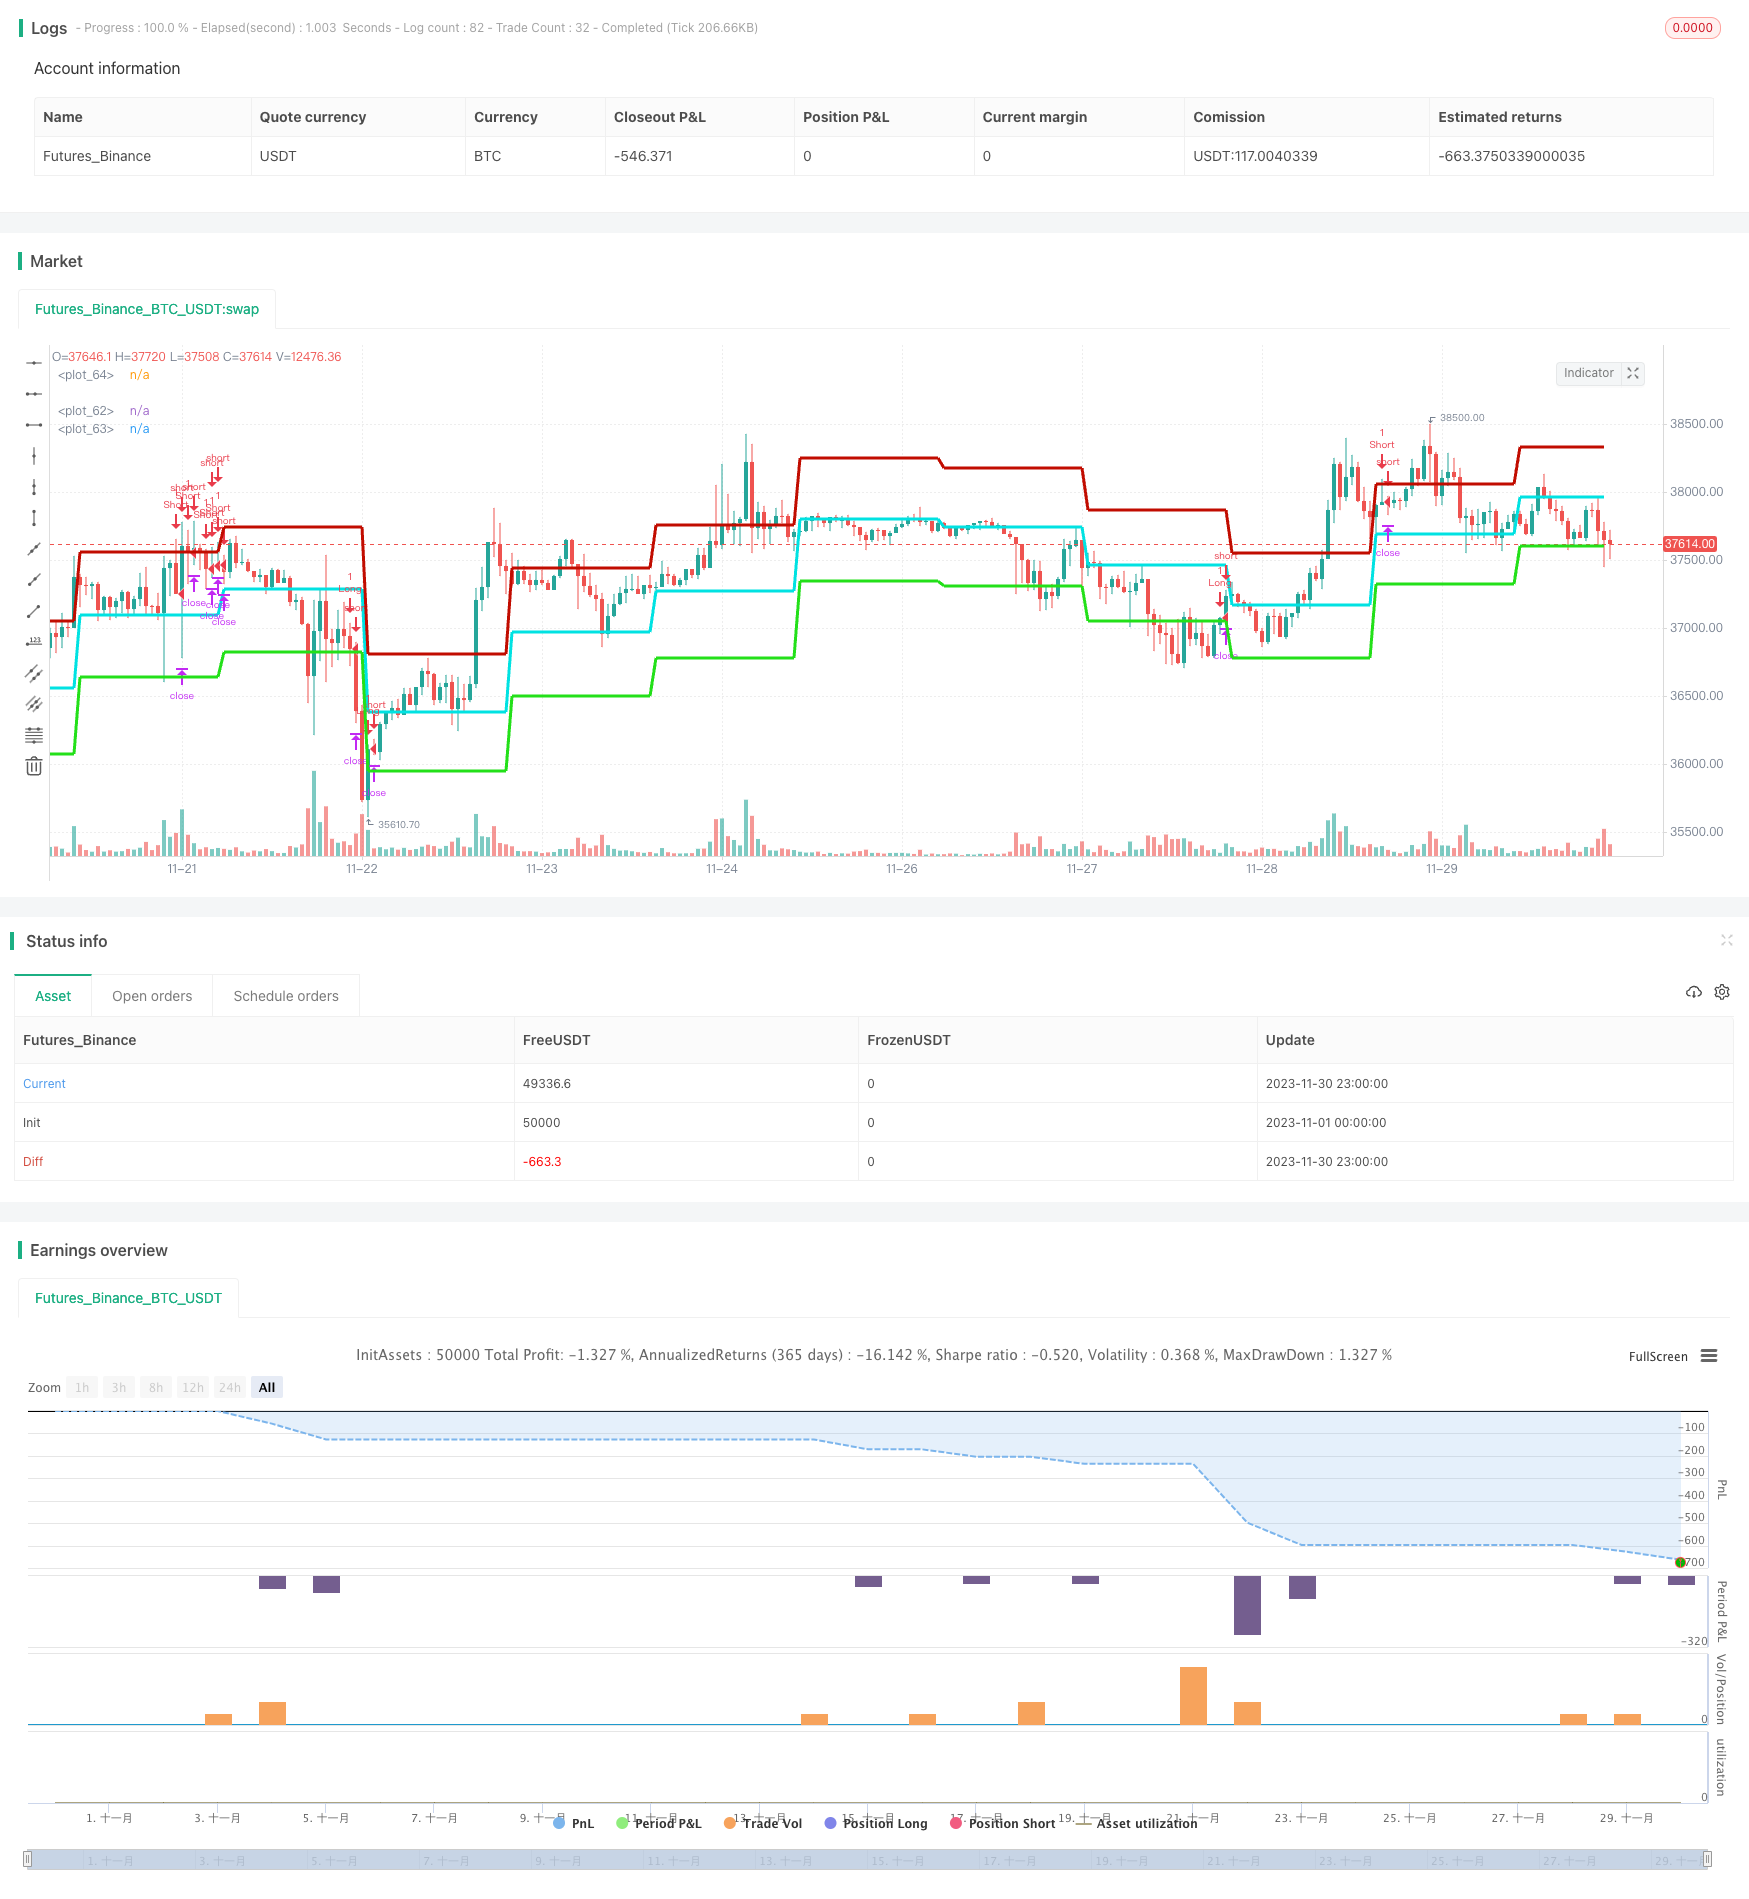
Overview
The Honey Trend ATR Breakout Strategy is a medium-term breakout strategy based on ATR indicator and Bollinger Bands for trading signal generation. It mainly monitors the trend changes of stock prices within a certain width of upper and lower ATR channels. When prices break through the lower or upper rail, combined with trend filtering, it makes trading decisions.
Strategy Principle
The strategy consists of three main parts:
ATR Channel: Calculate the fluctuation range of stock prices through ATR indicator and form a channel up and down within this range. The channel width is controlled by ATR lookback period and ATRdivisor factor.
Bee Line: Take the midline of stock prices as the baseline. The calculation method of midline is: the average value of yesterday's high, low and close prices.
Trend Filtering: Calculate the price trend through DMI indicator and set signal cycle. When pricesig '>': pricesig[3], the trend is up. When pricesig '<' pricesig[3], the trend is down.
The specific logic for generating trading signals is:
Long signal: pricesig '>' pricesig[3] and price break through the lower rail of channel.
Short signal: pricesig '<' pricesig[3] and price break through the upper rail of channel.
No trading in other situations.
The strategy also sets stop profit and stop loss conditions to control trading risks.
Advantage Analysis
The Honey Trend ATR Breakout Strategy has the following advantages:
Use ATR indicator to calculate the fluctuation range of stock prices, which can dynamically capture market changes;
Combine the midline to evaluate the sideways of stock prices and set the channel breakout trading points to avoid chasing highs and killing lows;
DMI indicator is used to determine the trend and avoid trading against the trend, improving the win rate;
Set stop profit and stop loss conditions to control the risk of single trade;
The strategy parameters are flexible enough to optimize the strategy by adjusting the channel width, ATR cycle and other factors.
Risk Analysis
The strategy also has some risks:
Medium-term trading has relatively large fluctuations and high risks. Prudent money management is required.
ATR channel range calculation may be inaccurate when stock prices fluctuate sharply, which easily leads to wrong trades.
DMI indicator may also make mistakes in trend judgment, thus affecting the accuracy of trading signals.
In response to the above risks, parameters like ATR channel can be adjusted and signal cycles can be increased for optimization and improvement.
Optimization Directions
The strategy can be optimized in the following aspects:
Adjust ATR channel width by modifying atrDivisor up or down to compress or expand the channel range.
Adjust ATR lookback cycle parameter to change the sensitivity of channel to recent fluctuations.
Adjust trend signal cycle parameter to improve the accuracy of bullish and bearish trend judgments.
Add other indicators for multi-factor verification to improve signal quality.
Optimize stop profit and stop loss algorithms to improve risk control.
Conclusion
The Honey Trend ATR Breakout Strategy integrates the analysis of price fluctuation range and trend judgment indicators. While capturing market hotspots, it also controls trading risks. It is a flexible and adaptable quantitative strategy. This strategy can be continuously improved through parameter adjustment and signal optimization, with broad application prospects.
Parameters
| Name | Default | What it controls |
|---|---|---|
| v_input_1 | D | Pivot Timeframe |
| v_input_2 | D | ATR Band Timeframe (Lower timeframe = wider bands) |
| v_input_3 | 13 | ATR lookback (Lower = bands more responsive to recent price action) |
| v_input_4 | 2 | ATR divisor (Lower = wider bands) |
| v_input_5 | 2 | Momentum Period |
| v_input_6 | 20 | Slow Period |
| v_input_7 | 5 | Fast Period |
| v_input_8 | 3 | Smoothing Period |
| v_input_9 | 4 | Signal Period |
| v_input_10 | 50 | Extreme Value |
| v_input_11 | false | Take Profit (In Market MinTick Value) |
| v_input_12 | 100 | Stop Loss (In Market MinTick Value) |
Source Pine Script
/*backtest
start: 2023-11-01 00:00:00
end: 2023-11-30 23:59:59
period: 1h
basePeriod: 15m
exchanges: [{"eid":"Futures_Binance","currency":"BTC_USDT"}]
*/

//@version=2
strategy(title="Strategy - Bobo PATR Swing", overlay=true, default_qty_type = strategy.fixed, default_qty_value = 1, initial_capital = 10000)

// === STRATEGY RELATED INPUTS AND LOGIC ===
PivottimeFrame = input(title="Pivot Timeframe",  defval="D")
ATRSDtimeFrame = input(title="ATR Band Timeframe (Lower timeframe = wider bands)",  defval="D")
len = input(title="ATR lookback (Lower = bands more responsive to recent price action)",  defval=13)
myatr = atr(len)
dailyatr = request.security(syminfo.tickerid, ATRSDtimeFrame, myatr[1])
atrdiv = input(title="ATR divisor (Lower = wider bands)", type=float, defval=2)
pivot0 = (high[1] + low[1]  + close[1]) / 3
pivot = request.security(syminfo.tickerid, PivottimeFrame, pivot0)
upperband1 = (dailyatr / atrdiv) + pivot
lowerband1 = pivot - (dailyatr / atrdiv)
middleband = pivot

// == TREND CALC ===
i1=input(2, "Momentum Period", minval=1) //Keep at 2 usually
i2=input(20, "Slow Period", minval=1)
i3=input(5, "Fast Period", minval=1)
i4=input(3, "Smoothing Period", minval=1)
i5=input(4, "Signal Period", minval=1)
i6=input(50, "Extreme Value", minval=1)
hiDif = high - high[1]
loDif = low[1] - low
uDM = hiDif > loDif and hiDif > 0 ? hiDif : 0
dDM =  loDif > hiDif and loDif > 0 ? loDif : 0
ATR = rma(tr(true), i1)
DIu = 100 * rma(uDM, i1) / ATR
DId = 100 * rma(dDM, i1) / ATR
HLM2 =  DIu - DId
DTI = (100 * ema(ema(ema(HLM2, i2), i3), i4)) /  ema(ema(ema(abs(HLM2), i2), i3), i4)
signal = ema(DTI, i5)


// === RISK MANAGEMENT INPUTS ===
inpTakeProfit   = input(defval = 0, title = "Take Profit (In Market MinTick Value)", minval = 0)
inpStopLoss     = input(defval = 100, title = "Stop Loss (In Market MinTick Value)", minval = 0)

// === RISK MANAGEMENT VALUE PREP ===
// if an input is less than 1, assuming not wanted so we assign 'na' value to disable it.
useTakeProfit   = inpTakeProfit  >= 1 ? inpTakeProfit  : na
useStopLoss     = inpStopLoss    >= 1 ? inpStopLoss    : na

// === STRATEGY - LONG POSITION EXECUTION ===
enterLong = (((low<=lowerband1) and (close >lowerband1)) or ((open <= lowerband1) and (close > lowerband1))) and (strategy.opentrades <1) and (atr(3) > atr(50)) and (signal>signal[3])
exitLong = (high > middleband)
strategy.entry(id = "Long", long = true, when = enterLong)
strategy.close(id = "Long", when = exitLong)

// === STRATEGY - SHORT POSITION EXECUTION ===
enterShort = (((high>=upperband1) and (close < upperband1)) or ((open >= upperband1) and (close < upperband1))) and (strategy.opentrades <1) and (atr(3) > atr(50)) and (signal<signal[3])
exitShort = (low < middleband)
strategy.entry(id = "Short", long = false, when = enterShort)
strategy.close(id = "Short", when = exitShort)

// === STRATEGY RISK MANAGEMENT EXECUTION ===
strategy.exit("Exit Long", from_entry = "Long", profit = useTakeProfit, loss = useStopLoss)
strategy.exit("Exit Short", from_entry = "Short", profit = useTakeProfit, loss = useStopLoss)

// === CHART OVERLAY ===
plot(upperband1, color=#C10C00, linewidth=3)
plot(lowerband1, color=#23E019, linewidth=3)
plot(middleband, color=#00E2E2, linewidth=3)
//plot(strategy.equity, title="equity", color=red, linewidth=2, style=areabr)Published by ChaoZhang on the FMZ strategy square · last modified 2023-12-06. Collected in the Quant Trading Vault. Unvalidated research: re-test with your own data and costs before trusting it.
Build this with AgenKit
A spec is not a trading system. Paste this into your coding agent and AgenKit runs a specialist team — architecture, test-first build, risk gates, review — with paper trading on by default.
/agenkit build a production-grade trading bot with a backtest engine, risk controls and paper trading by default from strategies/Honey-Trend-ATR-Breakout-Strategy.md- npx agenkit install engineering-kit in your project
- Paste the command into your agent and approve each phase
- Get tests, backtest, risk controls and a paper-trading switch
Understand it first
Before you run this, read the lesson behind the idea and how to backtest it honestly. Specs like this one are the survivors of an unknown number of trials; deflate their results accordingly.
Related specs
- Moving Average Crossover and Upper Rail Breakthrough Impulse StrategyPine Script · Breakout · 1m
- Volatility Breakthrough StrategyPine Script · Breakout · 10m
- Triple Pattern Oscillation Trading StrategyPine Script · Breakout · 1h
- Multi Timeframe Momentum Breakout StrategyPine Script · Breakout · 1d
- Momentum Breakout Moving Average StrategyPine Script · Breakout · 1d
- Momentum Breakout Trading Strategy 440964Pine Script · Breakout · 5m