Strategy vault / Trend following
ICHIMOKU Cloud and STOCH Indicator Based Trend Tracking Strategy
This strategy is based on the ICHIMOKU cloud chart pattern indicator and the STOCH random indicator to determine and track trends. The strategy name is "ICHIMOKU Cloud Stoch Trend Tracking Strategy".
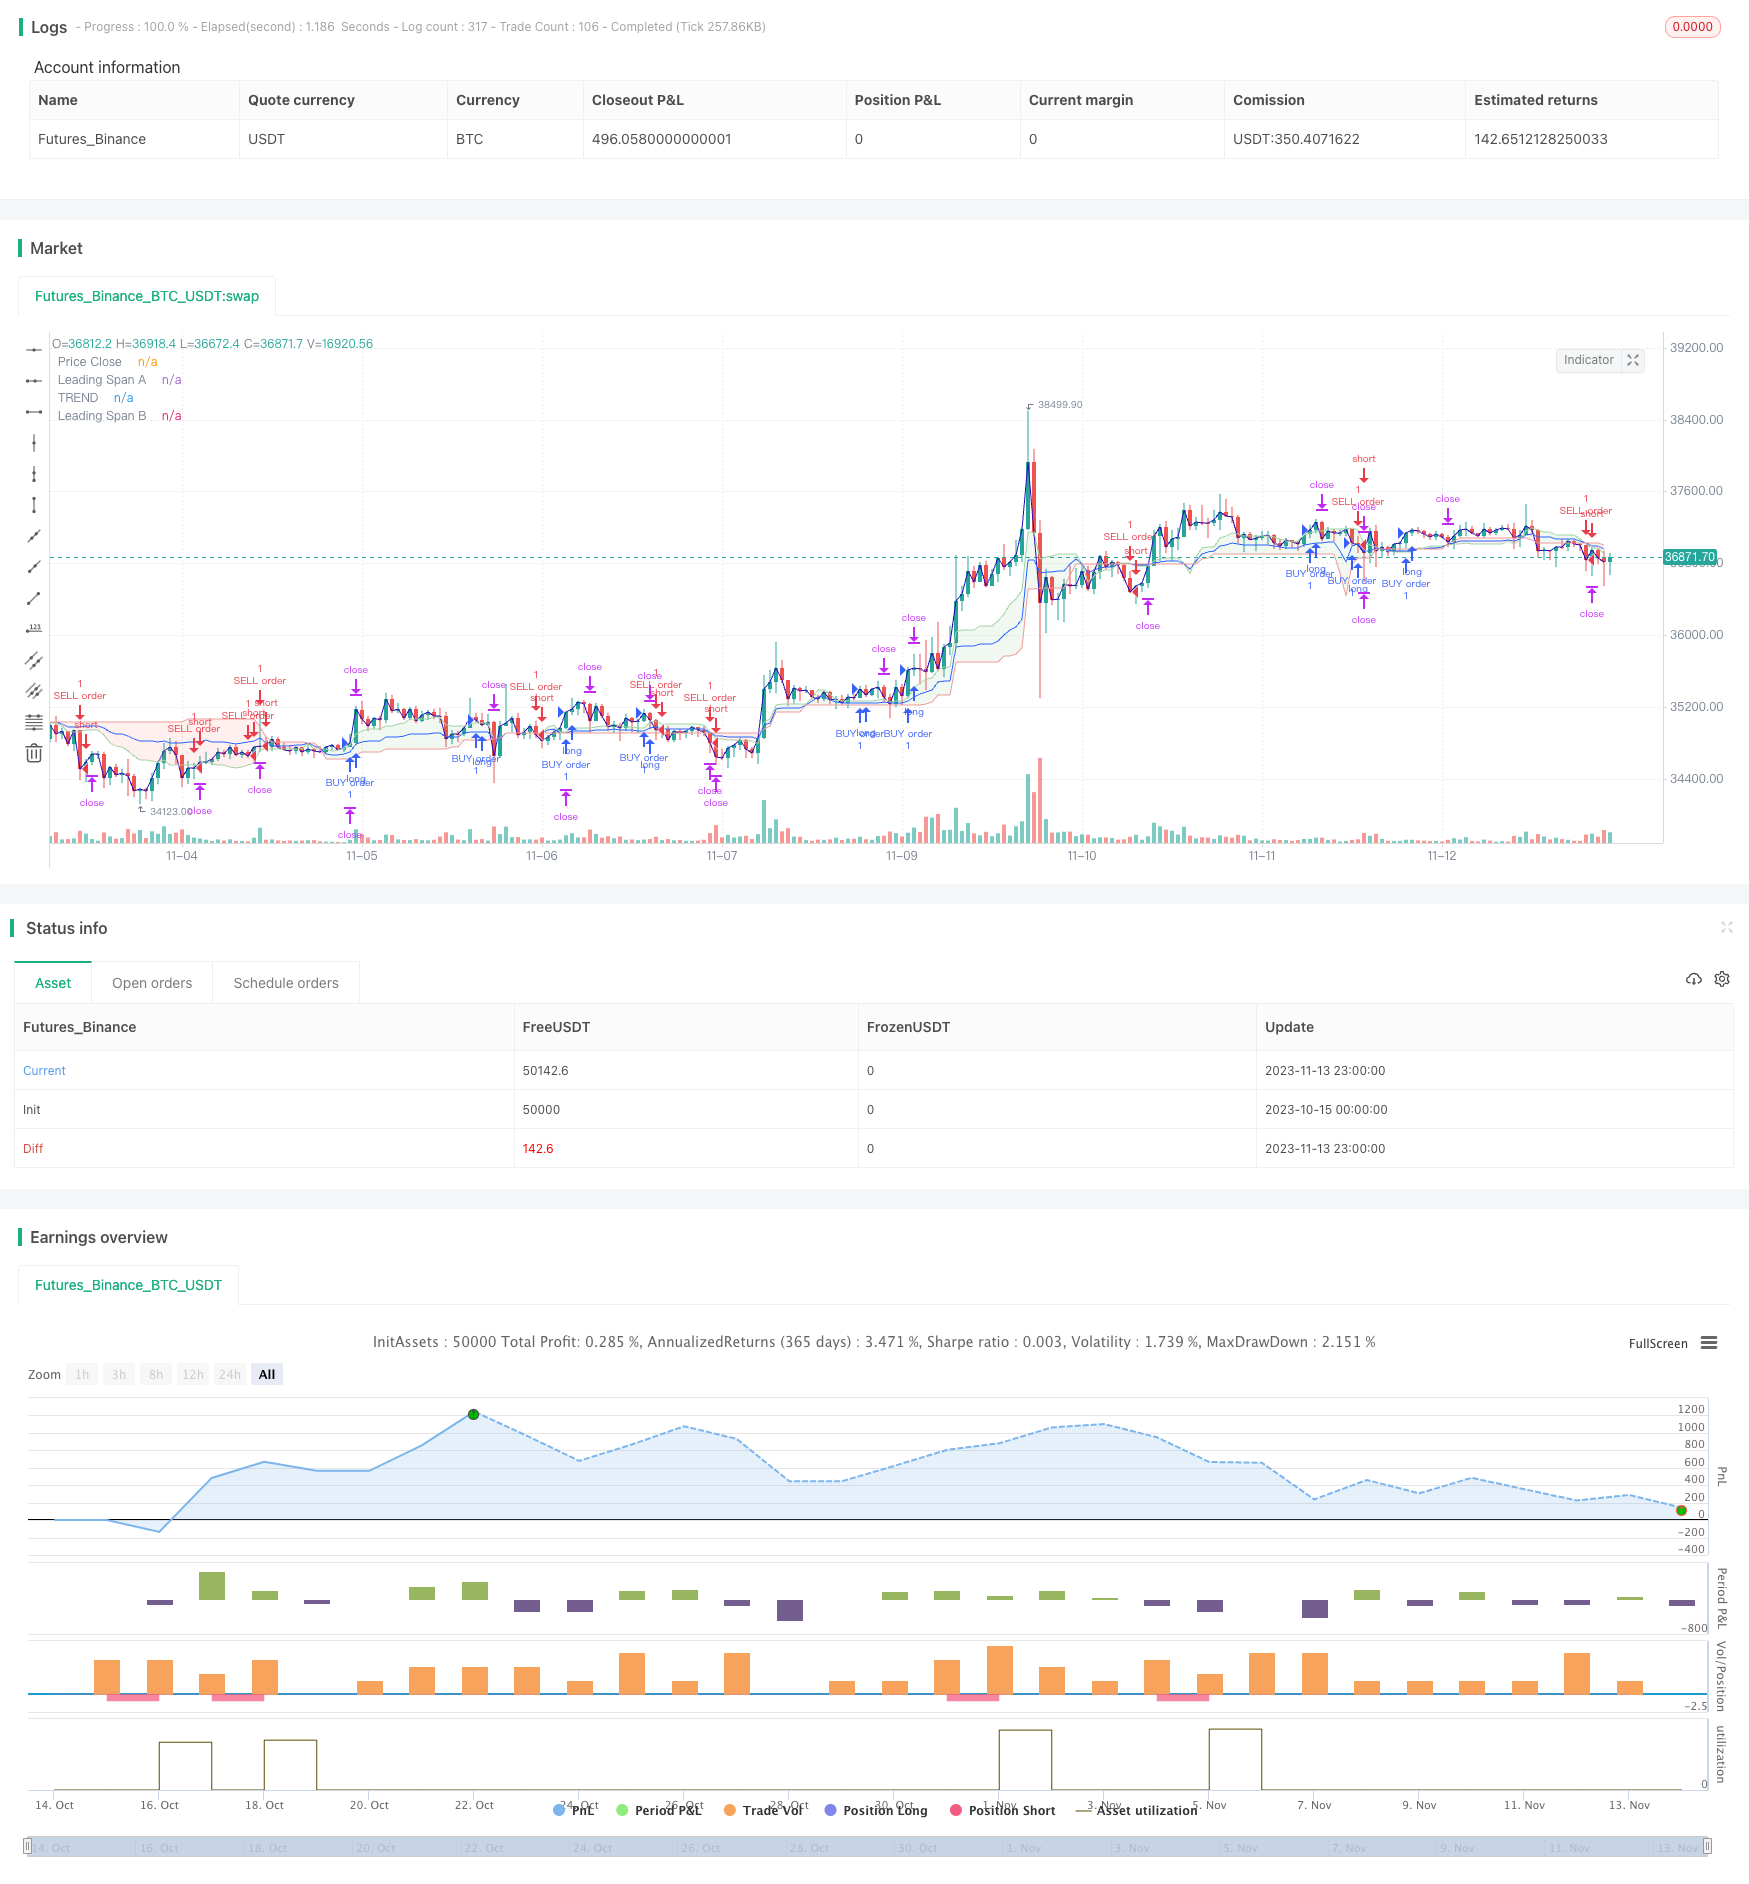
Overview
This strategy is based on the ICHIMOKU cloud chart pattern indicator and the STOCH random indicator to determine and track trends. The strategy name is "ICHIMOKU Cloud Stoch Trend Tracking Strategy".
Strategy Principle
The strategy mainly judges the current trend direction and overbought/oversold situations through the ICHIMOKU cloud chart and the STOCH indicator.
When the Conversion Line crosses above the Base Line and the Stoch indicator bounces back from the oversold area, it is considered a bullish trend and the strategy takes a bullish direction. When the Conversion Line crosses below the Base Line and the Stoch indicator falls back from the overbought area, it is considered a bearish trend and the strategy takes a bearish direction.
In the code, the Conversion Line is defined as the average of the highest and lowest prices of the last N1 bars; The Base Line is defined as the average of the highest and lowest prices of the last N2 bars. A bullish signal is generated when the conversion line crosses above the base line.
The Stoch indicator defines overbought and oversold threshold lines, as well as smoothing parameters K and D. A bullish signal is generated when the Stoch bounces back from the oversold area, and a bearish signal is generated when it falls back from the overbought area.
By combining the two indicators, the strategy determines the trend direction.
Advantage Analysis
The strategy combines chart pattern indicators and overbought/oversold indicators to effectively determine the trend direction.
Compared to using a single trend judgment indicator, this strategy comprehensively considers both trend and overrun situations, and can more accurately determine entry timing.
The ICHIMOKU cloud chart can identify medium and long term trends, while the Stoch indicator can discover short-term overbought/oversold situations. The two complement each other to form systematic judgments.
Risk Analysis
The main risks of this strategy are:
The risk of indicator failure in case of black swan events.
There is some lag, which may miss part of the trend or reverse opening positions.
The combined multiple factors judgment has some subjectivity, and improper parameter settings may cause mistakes.
High trading frequency may impact profits due to transaction costs.
Corresponding optimization measures:
Combine news events to avoid blind trading during major policy events.
Appropriately shorten cycle parameters to reduce lag probability.
Optimize parameters through backtesting to improve scientific settings.
Appropriately increase take profit and stop loss ranges to reduce trading frequency.
Optimization Directions
The main optimization directions for this strategy are:
Optimize the cycle parameters of the ICHIMOKU conversion line and base line to better fit different market characteristics.
Optimize the K, D smoothing parameters and overbought/oversold threshold values of the Stoch indicator.
Increase other indicators to form a multifactor model and improve system reliability.
Optimize take profit and stop loss points to reduce trading frequency while ensuring profitability.
Add a module to judge emergencies and avoid failure during major events.
Summary
This strategy combines ICHIMOKU cloud charts and Stoch indicators to make comprehensive judgments on trend direction and overbought/oversold situations, which can effectively track trending markets. By considering chart patterns and quantitative indicators, the strategy is more systematic. Future optimizations may include adjusting parameters, adding other indicators, adding emergency judgment modules, etc.
Parameters
| Name | Default | What it controls |
|---|---|---|
| v_input_int_1 | 20 | length |
| v_input_1 | 5 | smoothK |
| v_input_2 | 3 | smoothD |
| v_input_3 | 25 | OverBought |
| v_input_4 | 65 | OverSold |
| v_input_5 | 1800 | Profit |
| v_input_6 | 1200 | Stop |
| v_input_int_2 | 9 | Conversion Line Length |
| v_input_int_3 | 26 | Base Line Length |
| v_input_int_4 | 52 | Leading Span B Length |
| v_input_int_5 | true | Lagging Span |
Source Pine Script
/*backtest
start: 2023-10-15 00:00:00
end: 2023-11-14 00:00:00
period: 1h
basePeriod: 15m
exchanges: [{"eid":"Futures_Binance","currency":"BTC_USDT"}]
*/

//@version=5
strategy("ICHI + STOCH V1", overlay=true)
length = input.int(20, minval=1)
smoothK = input(5)
smoothD = input(3)
OverBought = input(25)
OverSold = input(65)
Profit = input(1800)
Stop = input(1200)
k = ta.sma(ta.stoch(close, high, low, length), smoothK)
d = ta.sma(k, smoothD)
co = ta.crossover(k,d)
cu = ta.crossunder(k,d)
conversionPeriods = input.int(9, minval=1, title="Conversion Line Length")
basePeriods = input.int(26, minval=1, title="Base Line Length")
laggingSpan2Periods = input.int(52, minval=1, title="Leading Span B Length")
displacement = input.int(1, minval=1, title="Lagging Span")
conversionLine = math.avg(ta.lowest(conversionPeriods), ta.highest(conversionPeriods))
baseLine = math.avg(ta.lowest(basePeriods), ta.highest(basePeriods))
leadLine1 = math.avg(conversionLine, baseLine)
leadLine2 = math.avg(ta.lowest(laggingSpan2Periods), ta.highest(laggingSpan2Periods))
TREND = ta.ema(math.avg(leadLine1,leadLine2),displacement)
//plot(conversionLine, color=#2962FF, title="Conversion Line")
//plot(baseLine, color=#B71C1C, title="Base Line")
//plot(close, offset = -displacement + 1, color=#43A047, title="Lagging Span")
plot(TREND, color=#2962FF, title="TREND")
p1 = plot(leadLine1,style=plot.style_line, offset = displacement - 1, color=#A5D6A7,
	 title="Leading Span A")

p2 = plot(leadLine2,style=plot.style_line, offset = displacement - 1, color=#EF9A9A,
	 title="Leading Span B")
fill(p1, p2, color = leadLine1 > leadLine2 ? color.rgb(67, 160, 71, 90) : color.rgb(244, 67, 54, 90))
close_price = ta.sma(close,1)
pc = plot(close_price,style=plot.style_line, color=#2a0ab9,
	 title="Price Close")
if (not na(k) and not na(d))
	if (co and k < OverSold)and(close_price > TREND)
		strategy.entry("BUY order", strategy.long, comment="BUY order")
		strategy.exit("exitBUY", "BUY order", profit = Profit, loss = Stop)
	if (cu and k > OverBought)and(close_price < TREND)
		strategy.entry("SELL order", strategy.short, comment="SELL order")
		strategy.exit("exitSELL", "SELL order", profit = Profit, loss = Stop)
//plot(strategy.equity, title="equity", color=color.red, linewidth=2, style=plot.style_areabr)
Published by ChaoZhang on the FMZ strategy square · last modified 2023-11-15. Collected in the Quant Trading Vault. Unvalidated research: re-test with your own data and costs before trusting it.
Build this with AgenKit
A spec is not a trading system. Paste this into your coding agent and AgenKit runs a specialist team — architecture, test-first build, risk gates, review — with paper trading on by default.
/agenkit build a production-grade trading bot with a backtest engine, risk controls and paper trading by default from strategies/ICHIMOKU-Cloud-and-STOCH-Indicator-Based-Trend-Tracking-Strategy.md- npx agenkit install engineering-kit in your project
- Paste the command into your agent and approve each phase
- Get tests, backtest, risk controls and a paper-trading switch
Understand it first
Before you run this, read the lesson behind the idea and how to backtest it honestly. Specs like this one are the survivors of an unknown number of trials; deflate their results accordingly.
Related specs
- Ichimoku Cloud MACD and Stochastic Based Multi Timeframe Trend Tracking StrategyPine Script · Trend following · 4h
- Trend Following Strategy Based on Moving Average Crossover 430022Pine Script · Trend following · 1d
- Dual ATR Channel Trend Following StrategyPine Script · Trend following · 15m
- EMA AROON ASHPine Script · Trend following · 3m
- EMA SMA Multi Indicator Comprehensive Trend Following StrategyPine Script · Trend following · 1h
- EMA200 and Stochastic RSI StrategyPine Script · Trend following · 1h