Low Point Rebound Strategy
The Low Point Rebound strategy is a simple and effective stock trading strategy. It captures low point rebound opportunities and enters the market when stock prices reverse upwards. It aims to profit in the short…
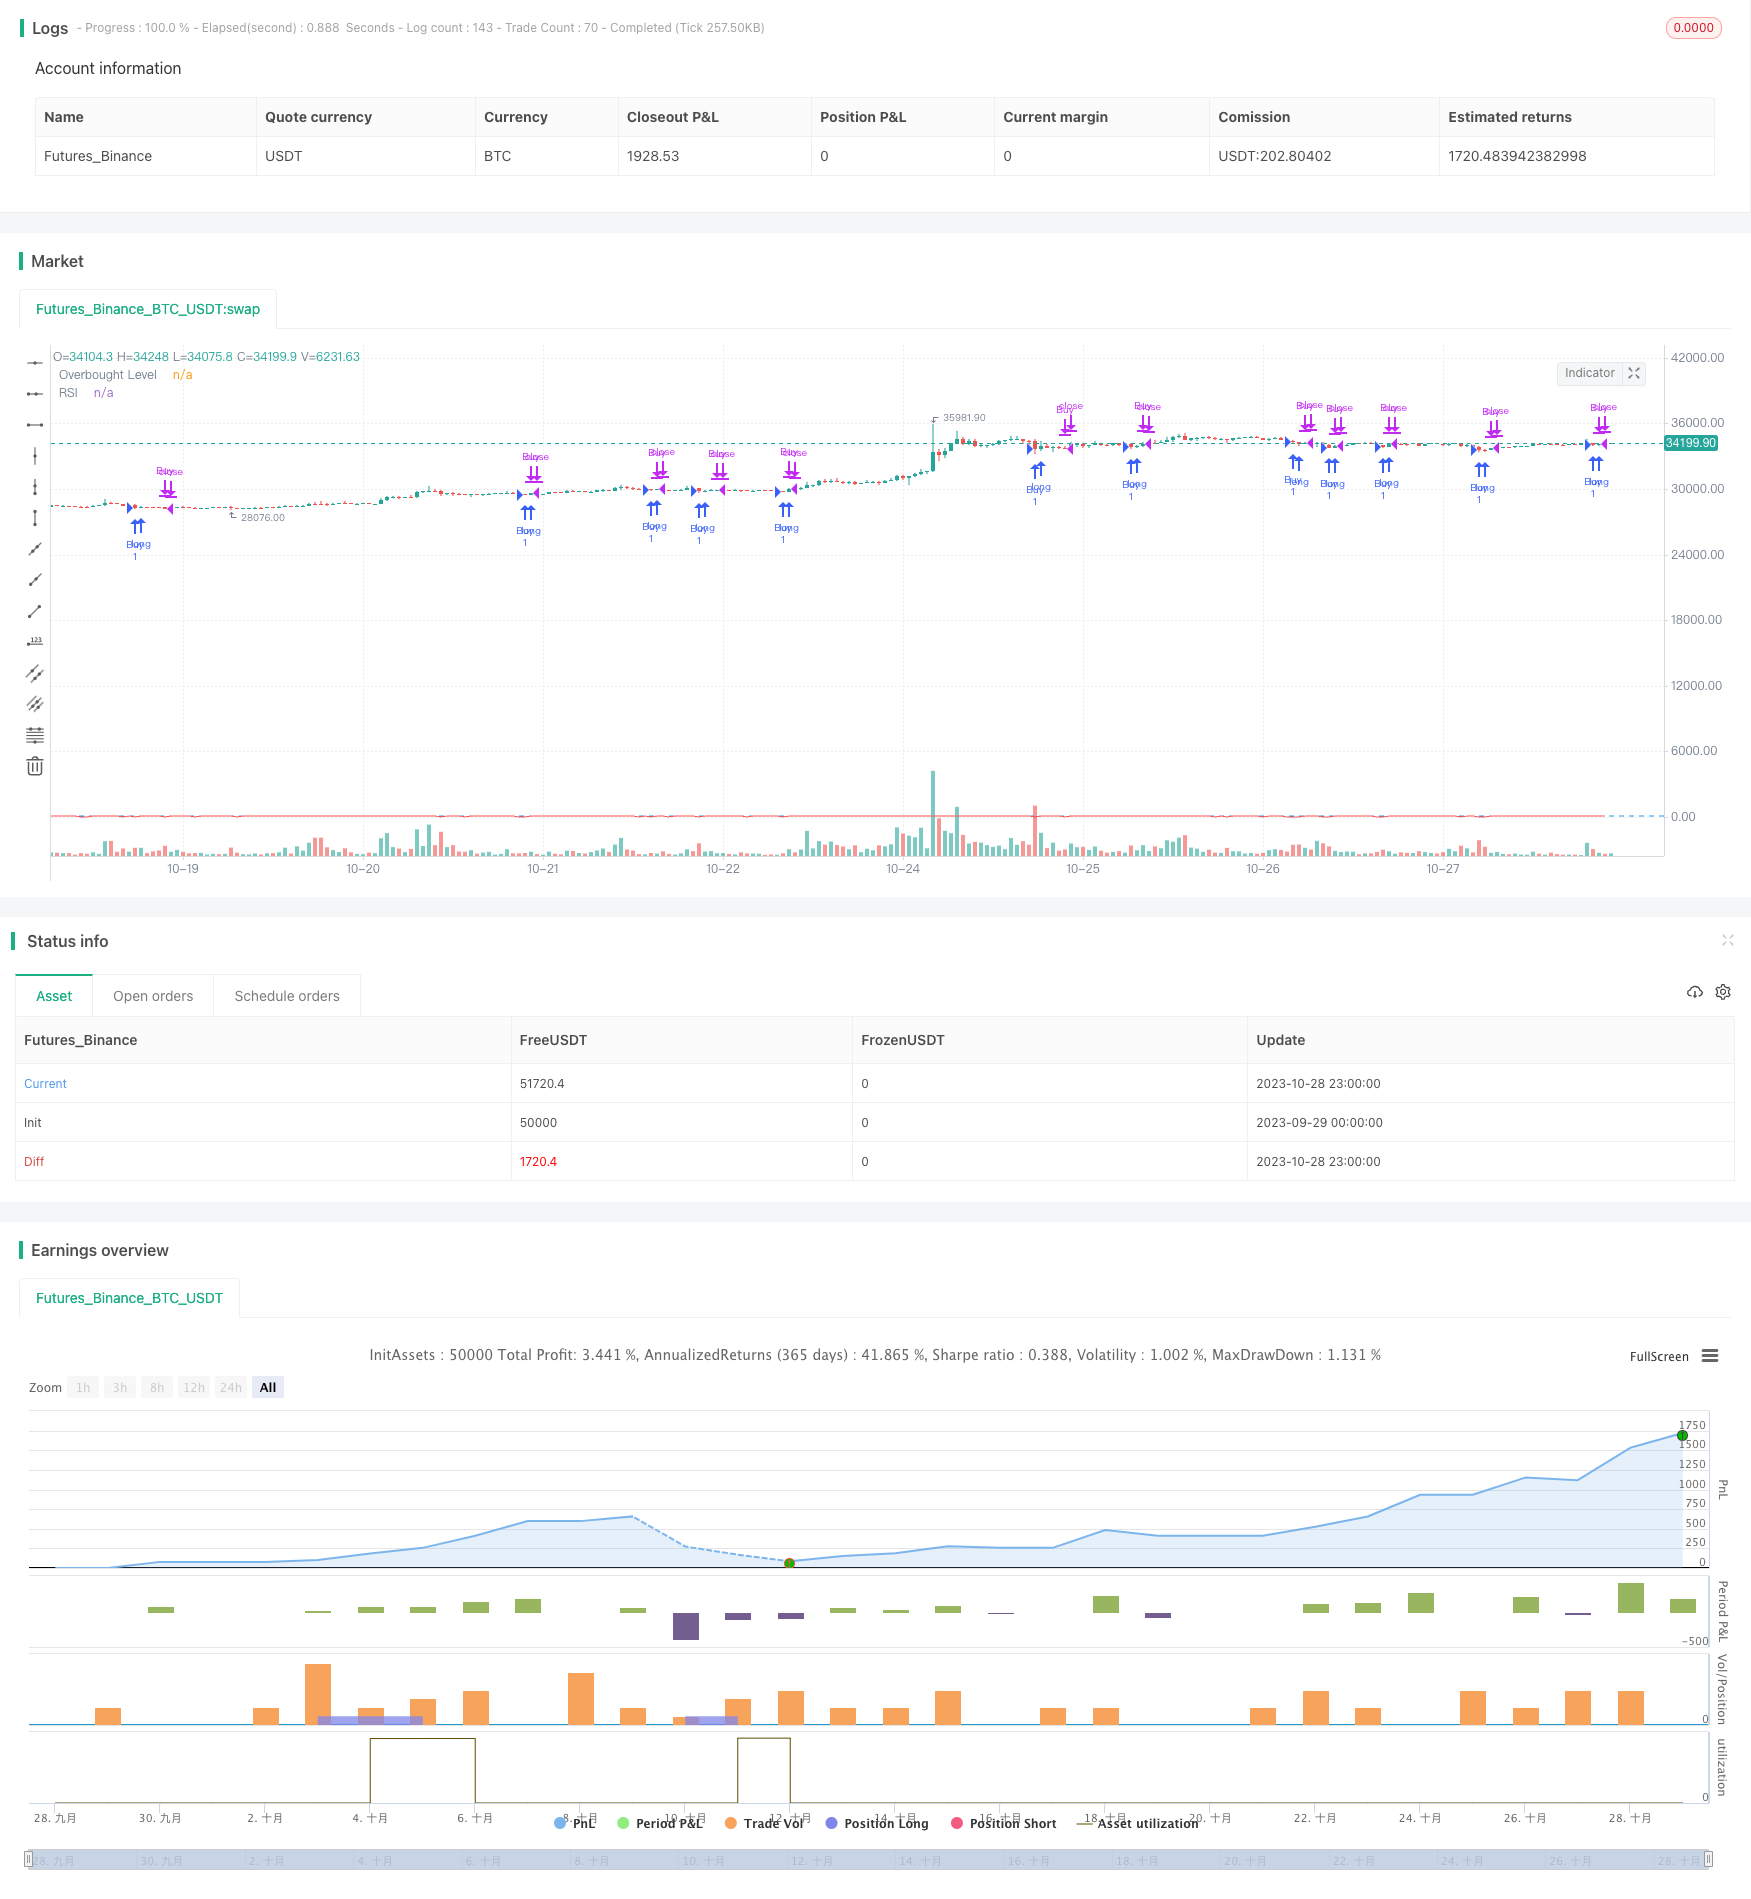
Overview
The Low Point Rebound strategy is a simple and effective stock trading strategy. It captures low point rebound opportunities and enters the market when stock prices reverse upwards. It aims to profit in the short term and exit quickly with stop loss.
Strategy Logic
This strategy mainly uses two indicators: the 5-day lowest price to determine entry timing and the 2-day RSI to determine exit timing.
The specific process is as follows:
If today's close is below yesterday's 5-day lowest price, go long at today's close.
If 2-day RSI closes above the overbought level (default 50), close long position at today's close to take profit.
If held for more than 5 days without meeting profit taking criteria, forced exit with stop loss.
This allows us to enter long around key points when prices reverse upwards. RSI overbought signals are used to lock in profits, while stop loss controls risk.
Advantage Analysis
This strategy has the following advantages:
Simple to implement. Only two indicators to monitor, clear rules for quick decisions.
Captures significant trends by entering before reversal upswings.
Stop loss and take profit points control single trade loss and achieve stable profits.
High capital turnover without long waiting times. Can repeat trades frequently.
Widely applicable to most stocks, especially those with clear short-term low price reversals.
Risk Analysis
There are also some risks to this strategy:
Picking wrong reversal timing may lead to losses. Identifying reversals needs experience.
Improper stop loss placement may magnify losses. Reasonable stop loss percentage should be considered.
Price whipsaws may prevent take profit from triggering. RSI parameters could be adjusted.
Only suitable for short-term trading, not long term holds.
High turnover increases transaction and slippage costs.
Improvement Directions
This strategy can be further optimized in the following aspects:
Add trend indicators to avoid counter trend trades. E.g. MACD, KDJ etc.
Test different lowest price lookback periods to find better reversal confirmation.
Optimize RSI parameters for better profit taking levels.
Consider dynamic stop loss module using ATR.
Improve entry timing with confirmation after reversal signal. Filter fake breakouts.
Set reasonable profit targets considering transaction costs. Control trade frequency.
Conclusion
The Low Point Rebound strategy is a typical short-term trading strategy. It capitalizes on low point reversal opportunities using simple indicators for entry and exit timing, enabling quick profit taking and stopping losses. Compared to buy and hold, it offers higher risk adjusted returns. With continuous parameter and rule optimization, this strategy can be adapted for most stocks to generate steady profits. But trading costs from high turnover should be monitored. Overall, the Low Point Rebound is an easy to use yet effective strategy for stock market trading.
Source Pine Script
/*backtest
start: 2023-09-29 00:00:00
end: 2023-10-29 00:00:00
period: 1h
basePeriod: 15m
exchanges: [{"eid":"Futures_Binance","currency":"BTC_USDT"}]
*/

// This source code is subject to the terms of the Mozilla Public License 2.0 at https://mozilla.org/MPL/2.0/
// © hobbiecode

// If today's close is below yesterday's five-day low, go long at the close.
// Sell at the close when the two-day RSI closes above 50.
// There is a time stop of five days if the sell criterium is not triggered.

//@version=5
strategy("Hobbiecode - Five Day Low RSI Strategy", overlay=true)

// RSI parameters
rsi_period = 2
rsi_upper = 50

// Calculate RSI
rsi_val = ta.rsi(close, rsi_period)

// Check if today's close is below yesterday's 5-day low
conditionEntry = close < ta.lowest(low[1], 5) and strategy.position_size < 1
if (conditionEntry)
    strategy.entry("Buy", strategy.long)

// Check if RSI closes above 50
if (strategy.position_size > 0 and rsi_val > rsi_upper)
    strategy.close("Buy")

// If position held for more than 5 days without sell criteria, then close position
if (strategy.position_size > 0 and ta.barssince(conditionEntry) >= 5)
    strategy.close("Buy")


// Plot RSI on chart
plot(rsi_val, title="RSI", color=color.red)
hline(rsi_upper, title="Overbought Level", color=color.blue)
Published by ChaoZhang on the FMZ strategy square · last modified 2023-10-30. Collected in the Quant Trading Vault. Unvalidated research: re-test with your own data and costs before trusting it.
Build this with AgenKit
A spec is not a trading system. Paste this into your coding agent and AgenKit runs a specialist team — architecture, test-first build, risk gates, review — with paper trading on by default.
/agenkit build a production-grade trading bot with a backtest engine, risk controls and paper trading by default from strategies/Low-Point-Rebound-Strategy.md- npx agenkit install engineering-kit in your project
- Paste the command into your agent and approve each phase
- Get tests, backtest, risk controls and a paper-trading switch
Understand it first
Before you run this, read the lesson behind the idea and how to backtest it honestly. Specs like this one are the survivors of an unknown number of trials; deflate their results accordingly.
Related specs
- MA Trendline Breakthrough StrategyPine Script · Breakout · 1d
- Momentum Breakout Moving Average StrategyPine Script · Breakout · 1d
- Momentum Breakout Trading Strategy 440964Pine Script · Breakout · 5m
- Moving Average Crossover and Upper Rail Breakthrough Impulse StrategyPine Script · Breakout · 1m
- Multi Technical Indicator Dynamic Wave Trading StrategyPine Script · Breakout · 1h
- Quantitative Trading Strategy Based on Ichimoku with Multiple SignalsPine Script · Breakout · 1h