MA Trendline Breakthrough Strategy
This strategy realizes continuous profitability in volatile markets by tracking moving average line breakthroughs. The core logic of this strategy is to open positions based on moving average line breakthroughs. It…
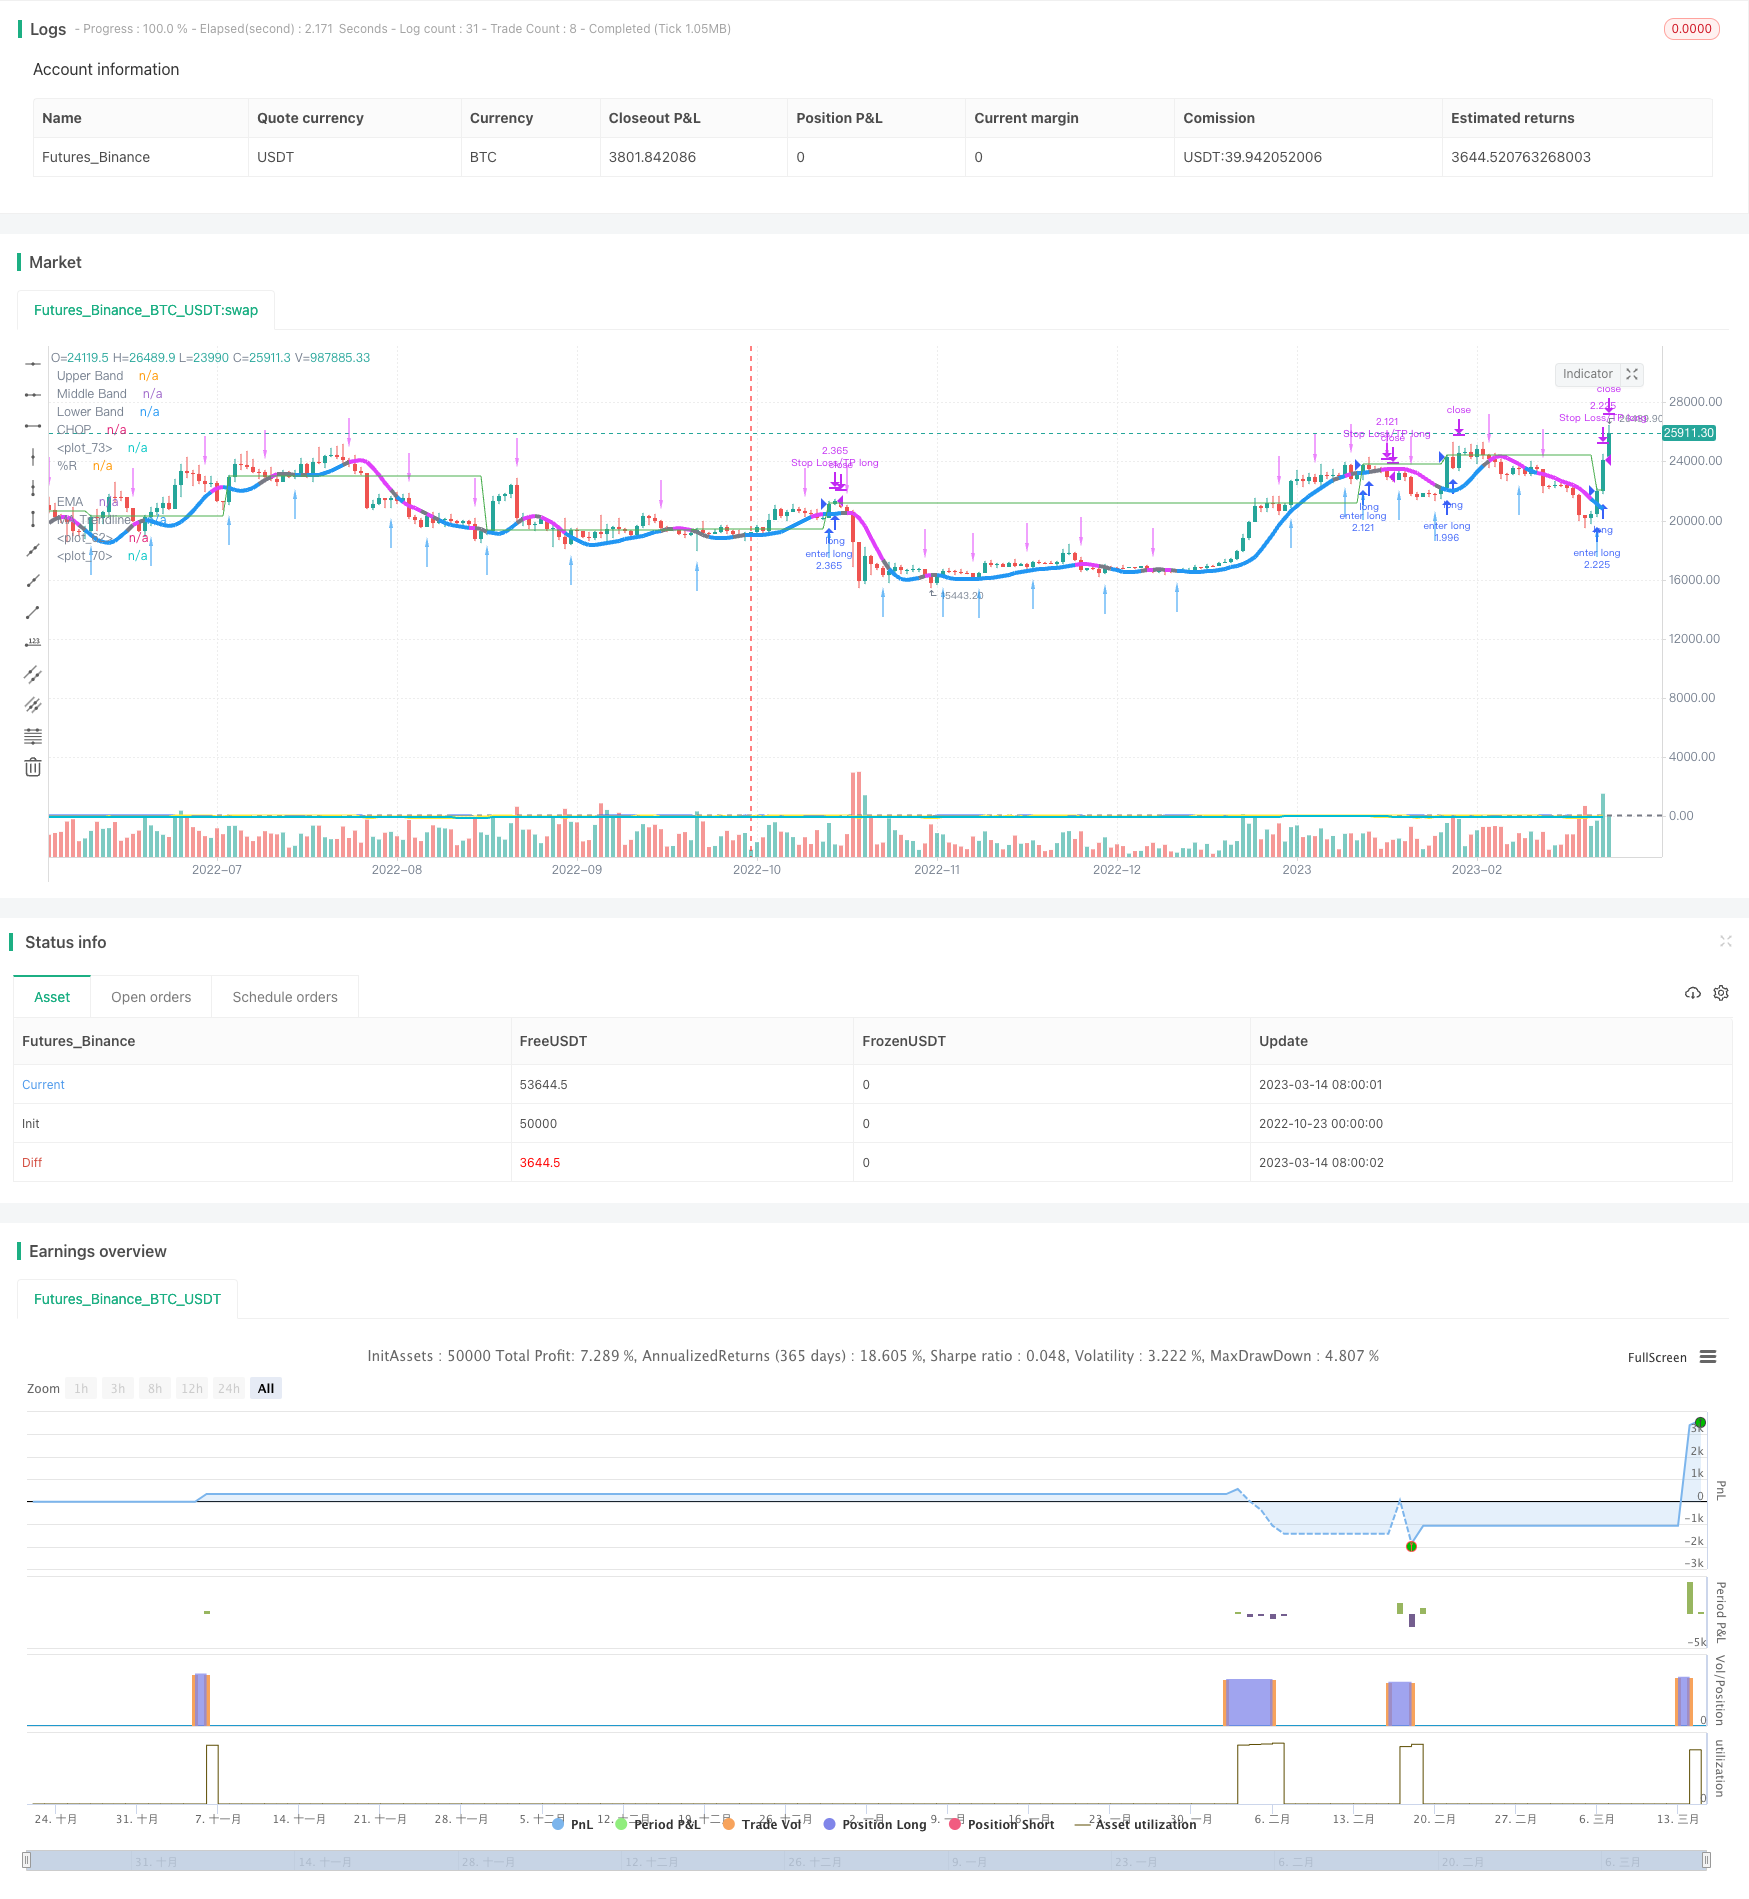
This strategy realizes continuous profitability in volatile markets by tracking moving average line breakthroughs.
Strategy Logic
The core logic of this strategy is to open positions based on moving average line breakthroughs. It uses MA to aggregate multiple moving averages to form the main moving average line. Trading signals are generated when the price breaks through the main moving average line.
Specifically, the strategy adopts a 60-period WMA double moving average as the main moving average line. At the same time, it calculates the true range of the price and draws upper and lower bands. Go long when the price breaks through the upper band, and go short when it breaks through the lower band.
On top of the breakthrough signals, the strategy also incorporates RSI and EMA as auxiliary indicators. It requires RSI>50 and price above EMA to go long, and RSI<50 and price below EMA to go short, so as to avoid false breakouts.
In addition, the strategy uses triple moving average formations to determine exit points. When the triple moving averages are in a weak formation (-1), the exit point is chosen as the reverse breakthrough of the channel.
Advantage Analysis
- Using MA to smooth price changes, it can effectively identify trend directions
- Trading based on channel breakouts can generate decent profits in range-bound markets
- Combining RSI and EMA avoids false breakout signals
- Using triple MA formations to determine exit points avoids exhausted trends
Risk Analysis
- MA lines may generate many false breakouts in wildly fluctuating markets
- Triple MA exit timings may not be very accurate
- Improper RSI parameters can lead to over-trading
These risks can be reduced by optimizing MA periods, tuning triple MA settings, using RSI cautiously etc.
Optimization Directions
- Optimize MA periods to find better settings for the main moving average line
- Try different auxiliary indicators to replace RSI, e.g. KDJ, MACD etc.
- Adjust triple MA parameters to identify reversal points more precisely
- Add stop loss to control risk per trade
Summary
In summary, this is an excellent breakout strategy for range-bound markets. The core idea is to open positions based on MA breakouts, filtered by trend indicators, and realize steady profits in non-trending markets. Exits are determined earlier using triple MA formations. There is ample room for optimizing parameters, improving entry/exit logic etc. to maximize performance in ranging markets.
Parameters
| Name | Default | What it controls |
|---|---|---|
| v_input_1 | 0.1 | Stop Loss % |
| v_input_2 | 0.33 | Take Profit % |
| v_input_3 | 21 | length |
| v_input_int_1 | 14 | lengthChop |
| v_input_int_2 | false | Offset |
| v_input_4 | 13 | EMA |
Source Pine Script
/*backtest
start: 2022-10-23 00:00:00
end: 2023-03-15 00:00:00
period: 1d
basePeriod: 1h
exchanges: [{"eid":"Futures_Binance","currency":"BTC_USDT"}]
*/


//@version=5

//exapple bot
strategy('RIPO BOT', shorttitle='RIPO BOT', overlay=true, process_orders_on_close=true, calc_on_order_fills=false, default_qty_type=strategy.percent_of_equity, default_qty_value=100)
sl_inp = input(0.1, title='Stop Loss %') / 100
tp_inp = input(0.33, title='Take Profit %') / 100

length = input(defval=21)
upper = ta.highest(length)
lower = ta.lowest(length)

lengthChop = input.int(14, minval=1)
ci = 100 * math.log10(math.sum(ta.atr(1), lengthChop) / (ta.highest(lengthChop) - ta.lowest(lengthChop))) / math.log10(lengthChop)
offset = input.int(0, "Offset",  minval = -500, maxval = 500)
plot(ci, "CHOP", color=#2962FF, offset = offset)
band1 = hline(61.8, "Upper Band", color=#787B86, linestyle=hline.style_dashed)
hline(50, "Middle Band", color=color.new(#787B86, 50))
band0 = hline(38.2, "Lower Band", color=#787B86, linestyle=hline.style_dashed)
fill(band1, band0, color = color.rgb(33, 150, 243, 90), title = "Background")

rsi = ta.rsi(close, 14)

var float entry_price = na

output = 100 * (close - upper) / (upper - lower)
ema = ta.ema(output, input(defval=13, title='EMA'))

ma(src, len) =>
    ta.wma(2 * ta.wma(src, len / 2) - ta.wma(src, len), math.round(math.sqrt(len)))
BBMC = ma(close, 60)
rangema = ta.ema(ta.tr, 60)
upperk = BBMC + rangema * 0.2
lowerk = BBMC - rangema * 0.2
color_bar = close > upperk ? color.blue : close < lowerk ? color.fuchsia : color.gray

ExitHigh = ma(high, 15)
ExitLow = ma(low, 15)
Hlv3 = int(na)
Hlv3 := close > ExitHigh ? 1 : close < ExitLow ? -1 : Hlv3[1]
sslExit = Hlv3 < 0 ? ExitHigh : ExitLow
base_cross_Long = ta.crossover(close, sslExit)
base_cross_Short = ta.crossover(sslExit, close)
codiff = base_cross_Long ? 1 : base_cross_Short ? -1 : na
entry_long = false

entry_short = false


if ta.crossover(close, BBMC) and output > ema
    entry_long := true

if ta.crossunder(close, BBMC) and output < ema
    entry_short := true

if entry_long and strategy.position_size == 0
    entry_price := close
    strategy.entry('enter long', strategy.long, comment='ENTER-LONG_BYBIT_MATICUSDT_BOT-NAME_1M_85915e4dc80fb663')
if strategy.position_size > 0
    strategy.exit('Stop Loss/TP long', 'enter long', limit=entry_price * (1 + tp_inp), stop = color_bar == color.fuchsia ? BBMC : na, comment='EXIT-LONG_BYBIT_MATICUSDT_BOT-NAME_1M_85915e4dc80fb663')
plot(entry_price * (1 + tp_inp), color=color.new(color.green, 0))


//if entry_short and strategy.position_size == 0
    //entry_price := close
    //strategy.entry('enter short', strategy.short, comment='ENTER-SHORT_BYBIT_MATICUSDT_BOT-NAME_1M_85915e4dc80fb663')
if strategy.position_size < 0
    strategy.exit('Stop Loss/TP short', 'enter short', limit=entry_price * (1 - tp_inp), stop = color_bar == color.blue ? BBMC : na, comment='EXIT-SHORT_BYBIT_MATICUSDT_BOT-NAME_1M_85915e4dc80fb663')
plot(entry_price * (1 + tp_inp), color=color.new(color.green, 0))
// plot(entry_price * (1 - sl_inp), color=color.new(color.red, 0))

plot(rsi, color=color.yellow)

plot(output, title='%R', color=color.new(color.yellow, 0), linewidth=2)
plot(ema, title='EMA', color=color.new(color.aqua, 0), linewidth=2)

plotarrow(codiff, colorup=color.new(color.blue, 35), colordown=color.new(color.fuchsia, 35), title='Exit Arrows', maxheight=20, offset=0)
plot(BBMC, color=color_bar, linewidth=4, title='MA Trendline')
Published by ChaoZhang on the FMZ strategy square · last modified 2023-10-30. Collected in the Quant Trading Vault. Unvalidated research: re-test with your own data and costs before trusting it.
Build this with AgenKit
A spec is not a trading system. Paste this into your coding agent and AgenKit runs a specialist team — architecture, test-first build, risk gates, review — with paper trading on by default.
/agenkit build a production-grade trading bot with a backtest engine, risk controls and paper trading by default from strategies/MA-Trendline-Breakthrough-Strategy.md- npx agenkit install engineering-kit in your project
- Paste the command into your agent and approve each phase
- Get tests, backtest, risk controls and a paper-trading switch
Understand it first
Before you run this, read the lesson behind the idea and how to backtest it honestly. Specs like this one are the survivors of an unknown number of trials; deflate their results accordingly.
Related specs
- Momentum Breakout Moving Average StrategyPine Script · Breakout · 1d
- Momentum Breakout Trading Strategy 440964Pine Script · Breakout · 5m
- Moving Average Crossover and Upper Rail Breakthrough Impulse StrategyPine Script · Breakout · 1m
- Multi Technical Indicator Dynamic Wave Trading StrategyPine Script · Breakout · 1h
- Quantitative Trading Strategy Based on Ichimoku with Multiple SignalsPine Script · Breakout · 1h
- Multifactor Dynamic Money Management StrategyPine Script · Breakout · 10m