MACD based Dual Trading Strategy
This strategy implements a dual trading strategy based on the MACD indicator. It can go long when there is a golden cross on the MACD and go short when there is a death cross, with additional filters based on other…
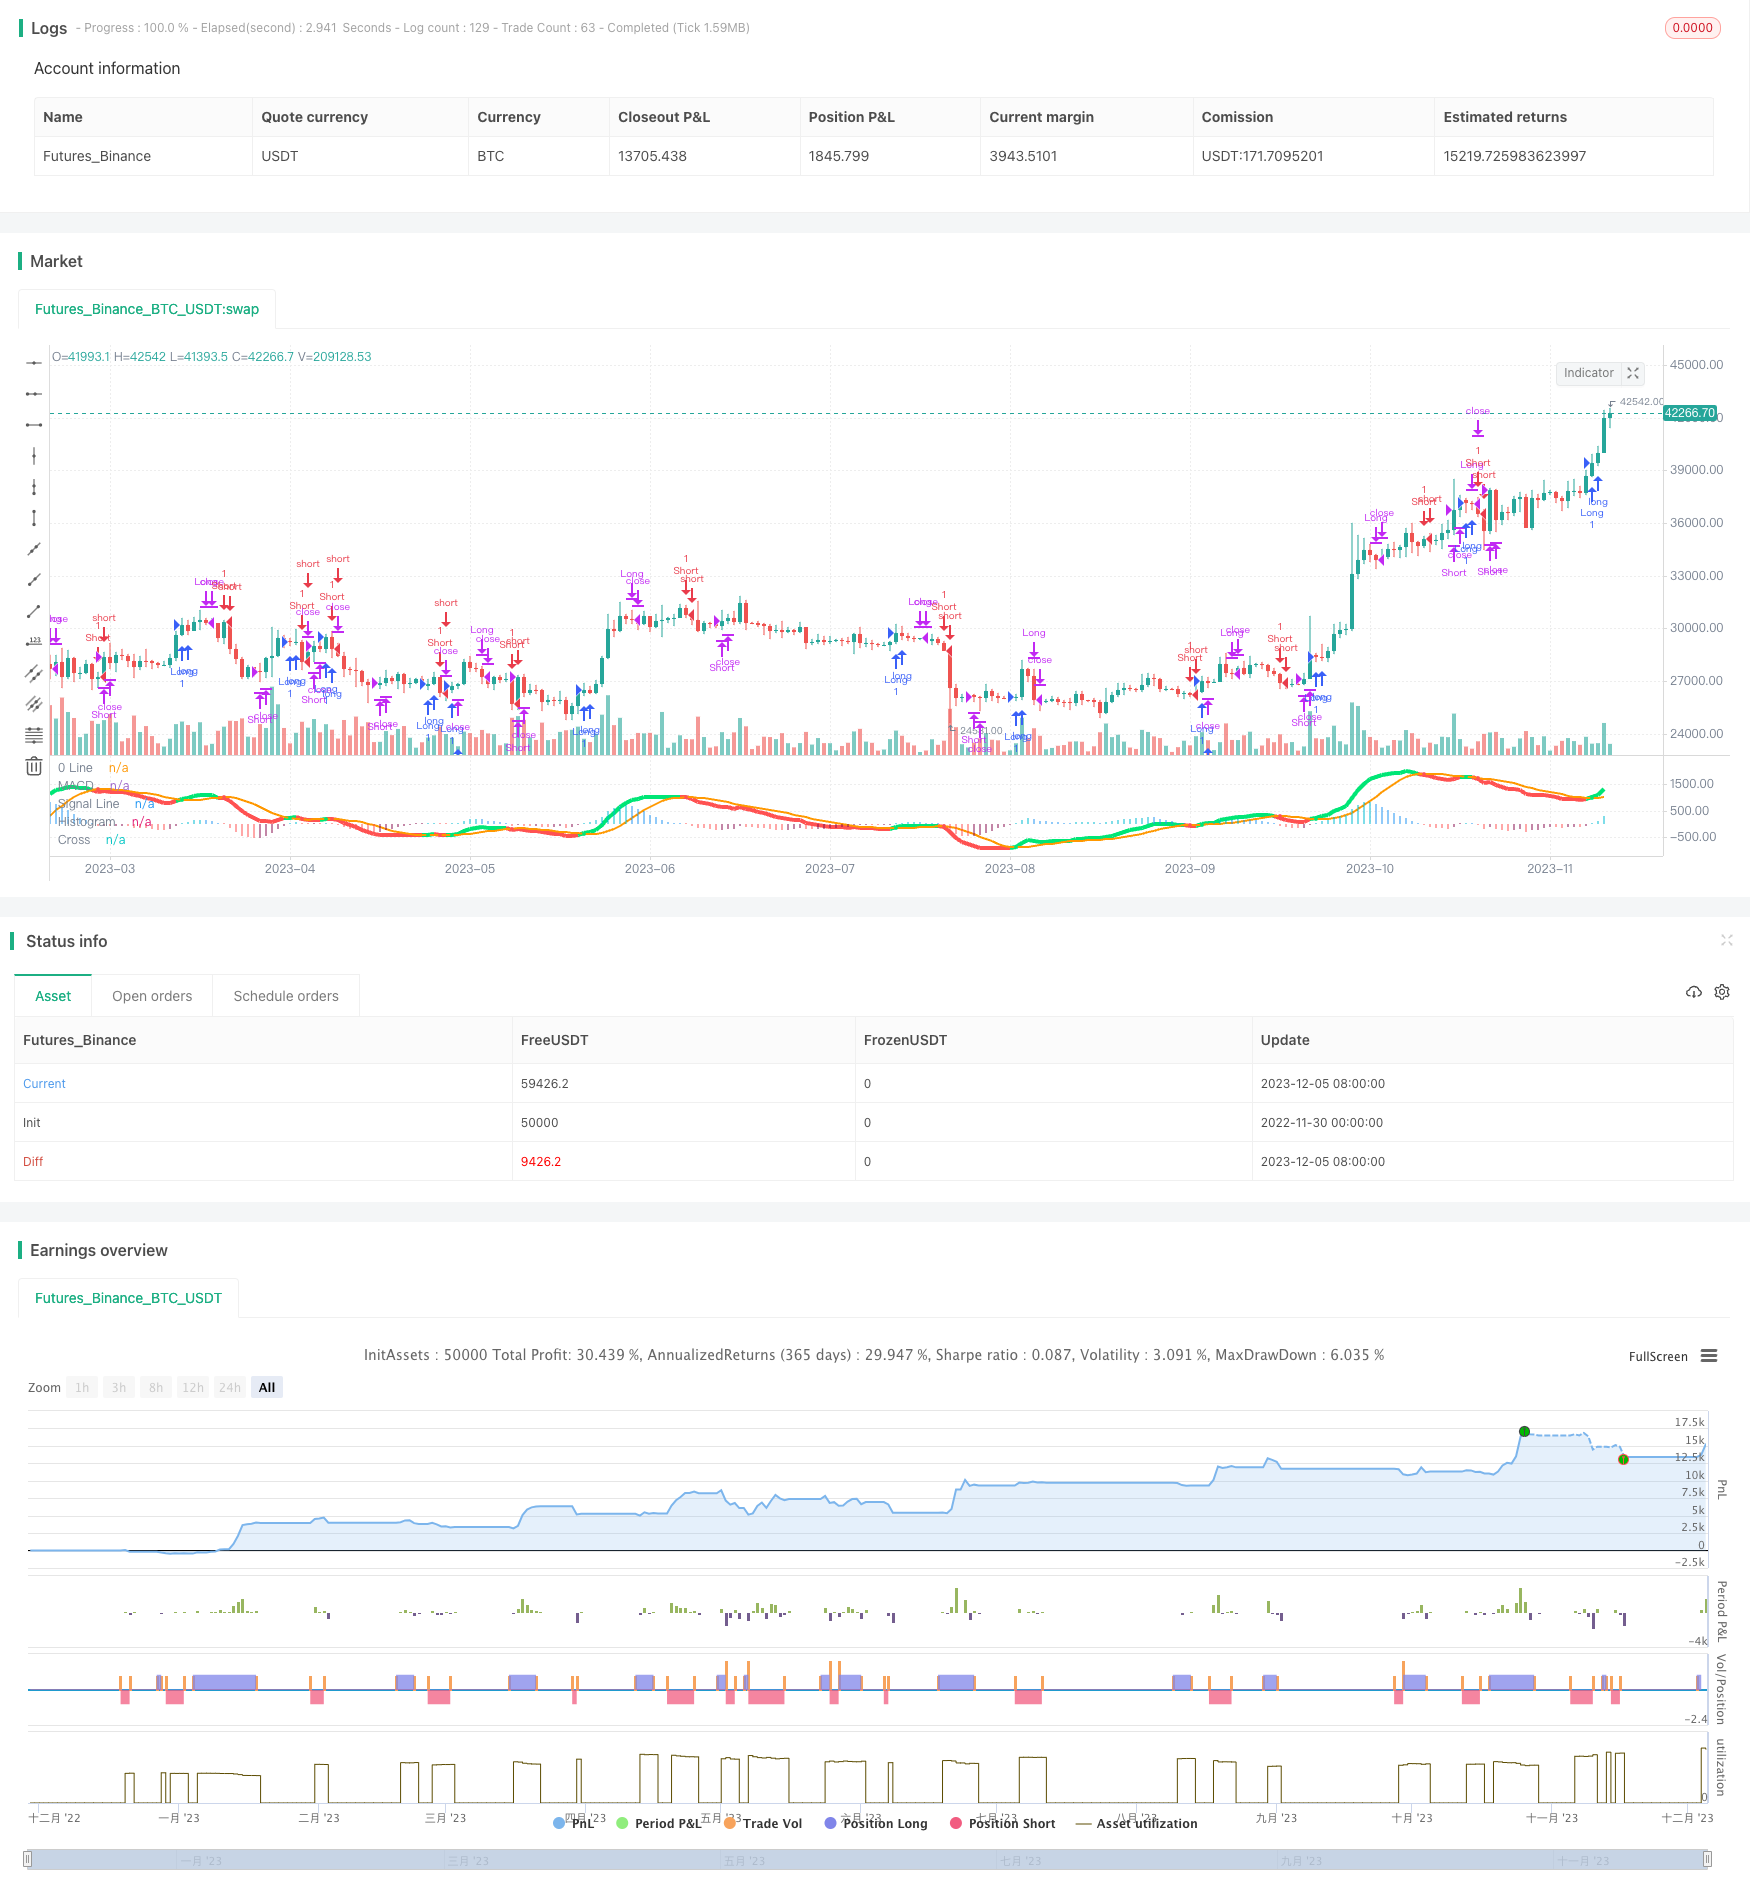
Overview
This strategy implements a dual trading strategy based on the MACD indicator. It can go long when there is a golden cross on the MACD and go short when there is a death cross, with additional filters based on other indicators to eliminate some invalid signals.
Strategy Principle
The core of this strategy is utilizing the MACD indicator to realize dual-directional trading. Specifically, it calculates the fast moving average, slow moving average and MACD signal line. When the fast MA crosses over the slow MA, a golden cross is generated for going long. When the fast MA crosses below the slow MA, a death cross is generated for going short.
To filter out some invalid signals, the strategy also sets a ±30 range as a filter, so that trade signals are only triggered when the MACD histogram exceeds this range. In addition, when closing positions, it also judges the direction of the MACD histogram - positions are closed only when the directions of two successive histogram bars change.
Advantages
- MACD indicator is used as the main trading signal, which is sensitive to price movements in both directions
- Added filters help eliminate some invalid signals
- The two-bar directional logic for closing positions avoids some false breakouts to some extent
Risks
- MACD indicator tends to generate frequent trade signals, leading to high trading frequency
- Relying solely on one indicator makes the strategy vulnerable to signal delays
- The closing logic based on histogram direction is not rigorous enough, risks missing some signals
Optimization Directions
- Consider combining with other indicators for signal confirmation, like KDJ, Bollinger Bands etc.
- Research more advanced indicators to replace MACD, like KD
- Optimize the closing logic by setting stop loss and take profit to control single trade loss
Conclusion
In summary, this is a basically feasible dual directional trading strategy. It utilizes the advantages of MACD indicator and also adds some filters to control signal quality. However, MACD itself has some issues as well. Further testing and optimization in live trading is still needed to make the strategy more reliable. Overall speaking, this strategy lays the foundation for dual-directional trading strategies, and can be further optimized incrementally to become a powerful quantitative trading strategy. ]
Parameters
| Name | Default | What it controls |
|---|---|---|
| v_input_1 | true | Use Current Chart Resolution? |
| v_input_2 | 60 | Use Different Timeframe? Uncheck Box Above |
| v_input_3 | true | Show MacD & Signal Line? Also Turn Off Dots Below |
| v_input_4 | true | Show Dots When MacD Crosses Signal Line? |
| v_input_5 | true | Show Histogram? |
| v_input_6 | true | Change MacD Line Color-Signal Line Cross? |
| v_input_7 | true | MacD Histogram 4 Colors? |
| v_input_8 | 12 | fastLength |
| v_input_9 | 26 | slowLength |
| v_input_10 | 9 | signalLength |
Source Pine Script
/*backtest
start: 2022-11-30 00:00:00
end: 2023-12-06 00:00:00
period: 1d
basePeriod: 1h
exchanges: [{"eid":"Futures_Binance","currency":"BTC_USDT"}]
*/

//@version=3

//Created by user ChrisMoody updated 4-10-2014
//Regular MACD Indicator with Histogram that plots 4 Colors Based on Direction Above and Below the Zero Line
//Update allows Check Box Options, Show MacD & Signal Line, Show Change In color of MacD Line based on cross of Signal Line.
//Show Dots at Cross of MacD and Signal Line, Histogram can show 4 colors or 1, Turn on and off Histogram.
//Special Thanks to that incredible person in Tech Support whoem I won't say you r name so you don't get bombarded with emails
//Note the feature Tech Support showed me on how to set the default timeframe of the indicator to the chart Timeframe, but also allow you to choose a different timeframe.
//By the way I fully disclose that I completely STOLE the Dots at the MAcd Cross from "TheLark"

strategy("MACD Strategy", overlay=false)
// study(title="CM_MacD_Ult_MTF", shorttitle="CM_Ult_MacD_MTF")
source = close
useCurrentRes = input(true, title="Use Current Chart Resolution?")
resCustom = input(title="Use Different Timeframe? Uncheck Box Above", defval="60")
smd = input(true, title="Show MacD & Signal Line? Also Turn Off Dots Below")
sd = input(true, title="Show Dots When MacD Crosses Signal Line?")
sh = input(true, title="Show Histogram?")
macd_colorChange = input(true,title="Change MacD Line Color-Signal Line Cross?")
hist_colorChange = input(true,title="MacD Histogram 4 Colors?")

res = useCurrentRes ? timeframe.period : resCustom

fastLength = input(12, minval=1), slowLength=input(26,minval=1)
signalLength=input(9,minval=1)

fastMA = ema(source, fastLength)
slowMA = ema(source, slowLength)

macd = fastMA - slowMA
signal = sma(macd, signalLength)
hist = macd - signal

outMacD = request.security(syminfo.tickerid, res, macd)
outSignal = request.security(syminfo.tickerid, res, signal)
outHist = request.security(syminfo.tickerid, res, hist)

histA_IsUp = outHist > outHist[1] and outHist > 0
histA_IsDown = outHist < outHist[1] and outHist > 0
histB_IsDown = outHist < outHist[1] and outHist <= 0
histB_IsUp = outHist > outHist[1] and outHist <= 0

//MacD Color Definitions
macd_IsAbove = outMacD >= outSignal
macd_IsBelow = outMacD < outSignal


// strategy.entry("Long", strategy.long, 1, when = shouldPlaceLong)

// strategy.close("Long", shouldExitLong)


// strategy.entry("Short", strategy.short, 1, when = shouldPlaceShort)

// strategy.close("Short", shouldExitShort)


isWithinZeroMacd = outHist < 30 and outHist > -30

delta = hist
// shouldExitShort = false//crossover(delta, 0)
// shouldExitLong = false//crossunder(delta, 0)

// if(crossover(delta, 0))// and not isWithinZeroMacd)
//     strategy.entry("Long", strategy.long, comment="Long")

// if (crossunder(delta, 0))// and not isWithinZeroMacd)
//     strategy.entry("Short", strategy.short, comment="Short")

shouldPlaceLong = crossover(delta, 0)

strategy.entry("Long", strategy.long, 1, when = shouldPlaceLong)

shouldExitLong = not histA_IsUp and histA_IsDown

shouldExitShort = not histA_IsUp and not histA_IsDown and not histB_IsDown and histB_IsUp

shouldPlaceShort = crossunder(delta, 0)
strategy.entry("Short", strategy.short, 1, when = shouldPlaceShort)

// plot_color = gray
plot_color = if(hist_colorChange)
	if(histA_IsUp)
	    aqua
	else
		if(histA_IsDown)
			//need to sell
// 			if(not isWithinZeroMacd)
// 			shouldExitLong = true
			    //   strategy.entry("Short", strategy.short, comment="Short")

			blue
		else
			if(histB_IsDown)
				red
			else
				if(histB_IsUp)
					//need to buy
				// 	if(not isWithinZeroMacd)
				// 	shouldExitShort = true
					   // strategy.entry("Long", strategy.long, comment="Long")


					maroon
				else
					yellow
else
	gray


// plot_color = hist_colorChange ? histA_IsUp ? aqua : histA_IsDown ? blue : histB_IsDown ? red : histB_IsUp ? maroon :yellow :gray
macd_color = macd_colorChange ? macd_IsAbove ? lime : red : red
signal_color = macd_colorChange ? macd_IsAbove ? orange : orange : lime

circleYPosition = outSignal

plot(smd and outMacD ? outMacD : na, title="MACD", color=macd_color, linewidth=4)
plot(smd and outSignal ? outSignal : na, title="Signal Line", color=signal_color, style=line ,linewidth=2)
plot(sh and outHist ? outHist : na, title="Histogram", color=plot_color, style=histogram, linewidth=4)
plot(sd and cross(outMacD, outSignal) ? circleYPosition : na, title="Cross", style=circles, linewidth=4, color=macd_color)

// plot( isWithinZeroMacd ? outHist : na, title="CheckSmallHistBars", style=circles, linewidth=4, color=black)

hline(0, '0 Line',  linewidth=2, color=white)


strategy.close("Short", shouldExitShort)
strategy.close("Long", shouldExitLong)

// fastLength = input(12)
// slowlength = input(26)
// MACDLength = input(9)

// MACD = ema(close, fastLength) - ema(close, slowlength)
// aMACD = ema(MACD, MACDLength)
// delta = MACD - aMACD


// if (crossover(delta, 0))
   // strategy.entry("MacdLE", strategy.long, comment="MacdLE")

//if last two macd bars are higher than current, close long position

// if (crossunder(delta, 0))
   // strategy.entry("MacdSE", strategy.short, comment="MacdSE")

//if last two macd bars are higher than current, close long position

// plot(strategy.equity, title="equity", color=red, linewidth=2, style=areabr)Published by ChaoZhang on the FMZ strategy square · last modified 2023-12-07. Collected in the Quant Trading Vault. Unvalidated research: re-test with your own data and costs before trusting it.
Build this with AgenKit
A spec is not a trading system. Paste this into your coding agent and AgenKit runs a specialist team — architecture, test-first build, risk gates, review — with paper trading on by default.
/agenkit build a production-grade trading bot with a backtest engine, risk controls and paper trading by default from strategies/MACD-based-Dual-Trading-Strategy.md- npx agenkit install engineering-kit in your project
- Paste the command into your agent and approve each phase
- Get tests, backtest, risk controls and a paper-trading switch
Understand it first
Before you run this, read the lesson behind the idea and how to backtest it honestly. Specs like this one are the survivors of an unknown number of trials; deflate their results accordingly.
Related specs
- Momentum Breakout Moving Average StrategyPine Script · Breakout · 1d
- Momentum Breakout Trading Strategy 440964Pine Script · Breakout · 5m
- Momentum Breakout Trading StrategyPine Script · Breakout · 4h
- Moving Average Crossover and Upper Rail Breakthrough Impulse StrategyPine Script · Breakout · 1m
- Multiple Moving Average Bollinger Bands StrategyPine Script · Breakout · 1d
- Quadruple Crossing StrategyPine Script · Breakout · 1h