MACD Histogram Strategy of RSI
This strategy generates trading signals based on the MACD of RSI indicator. It combines the RSI indicator's ability to judge overbought and oversold levels in the market, as well as MACD's advantage in determining…
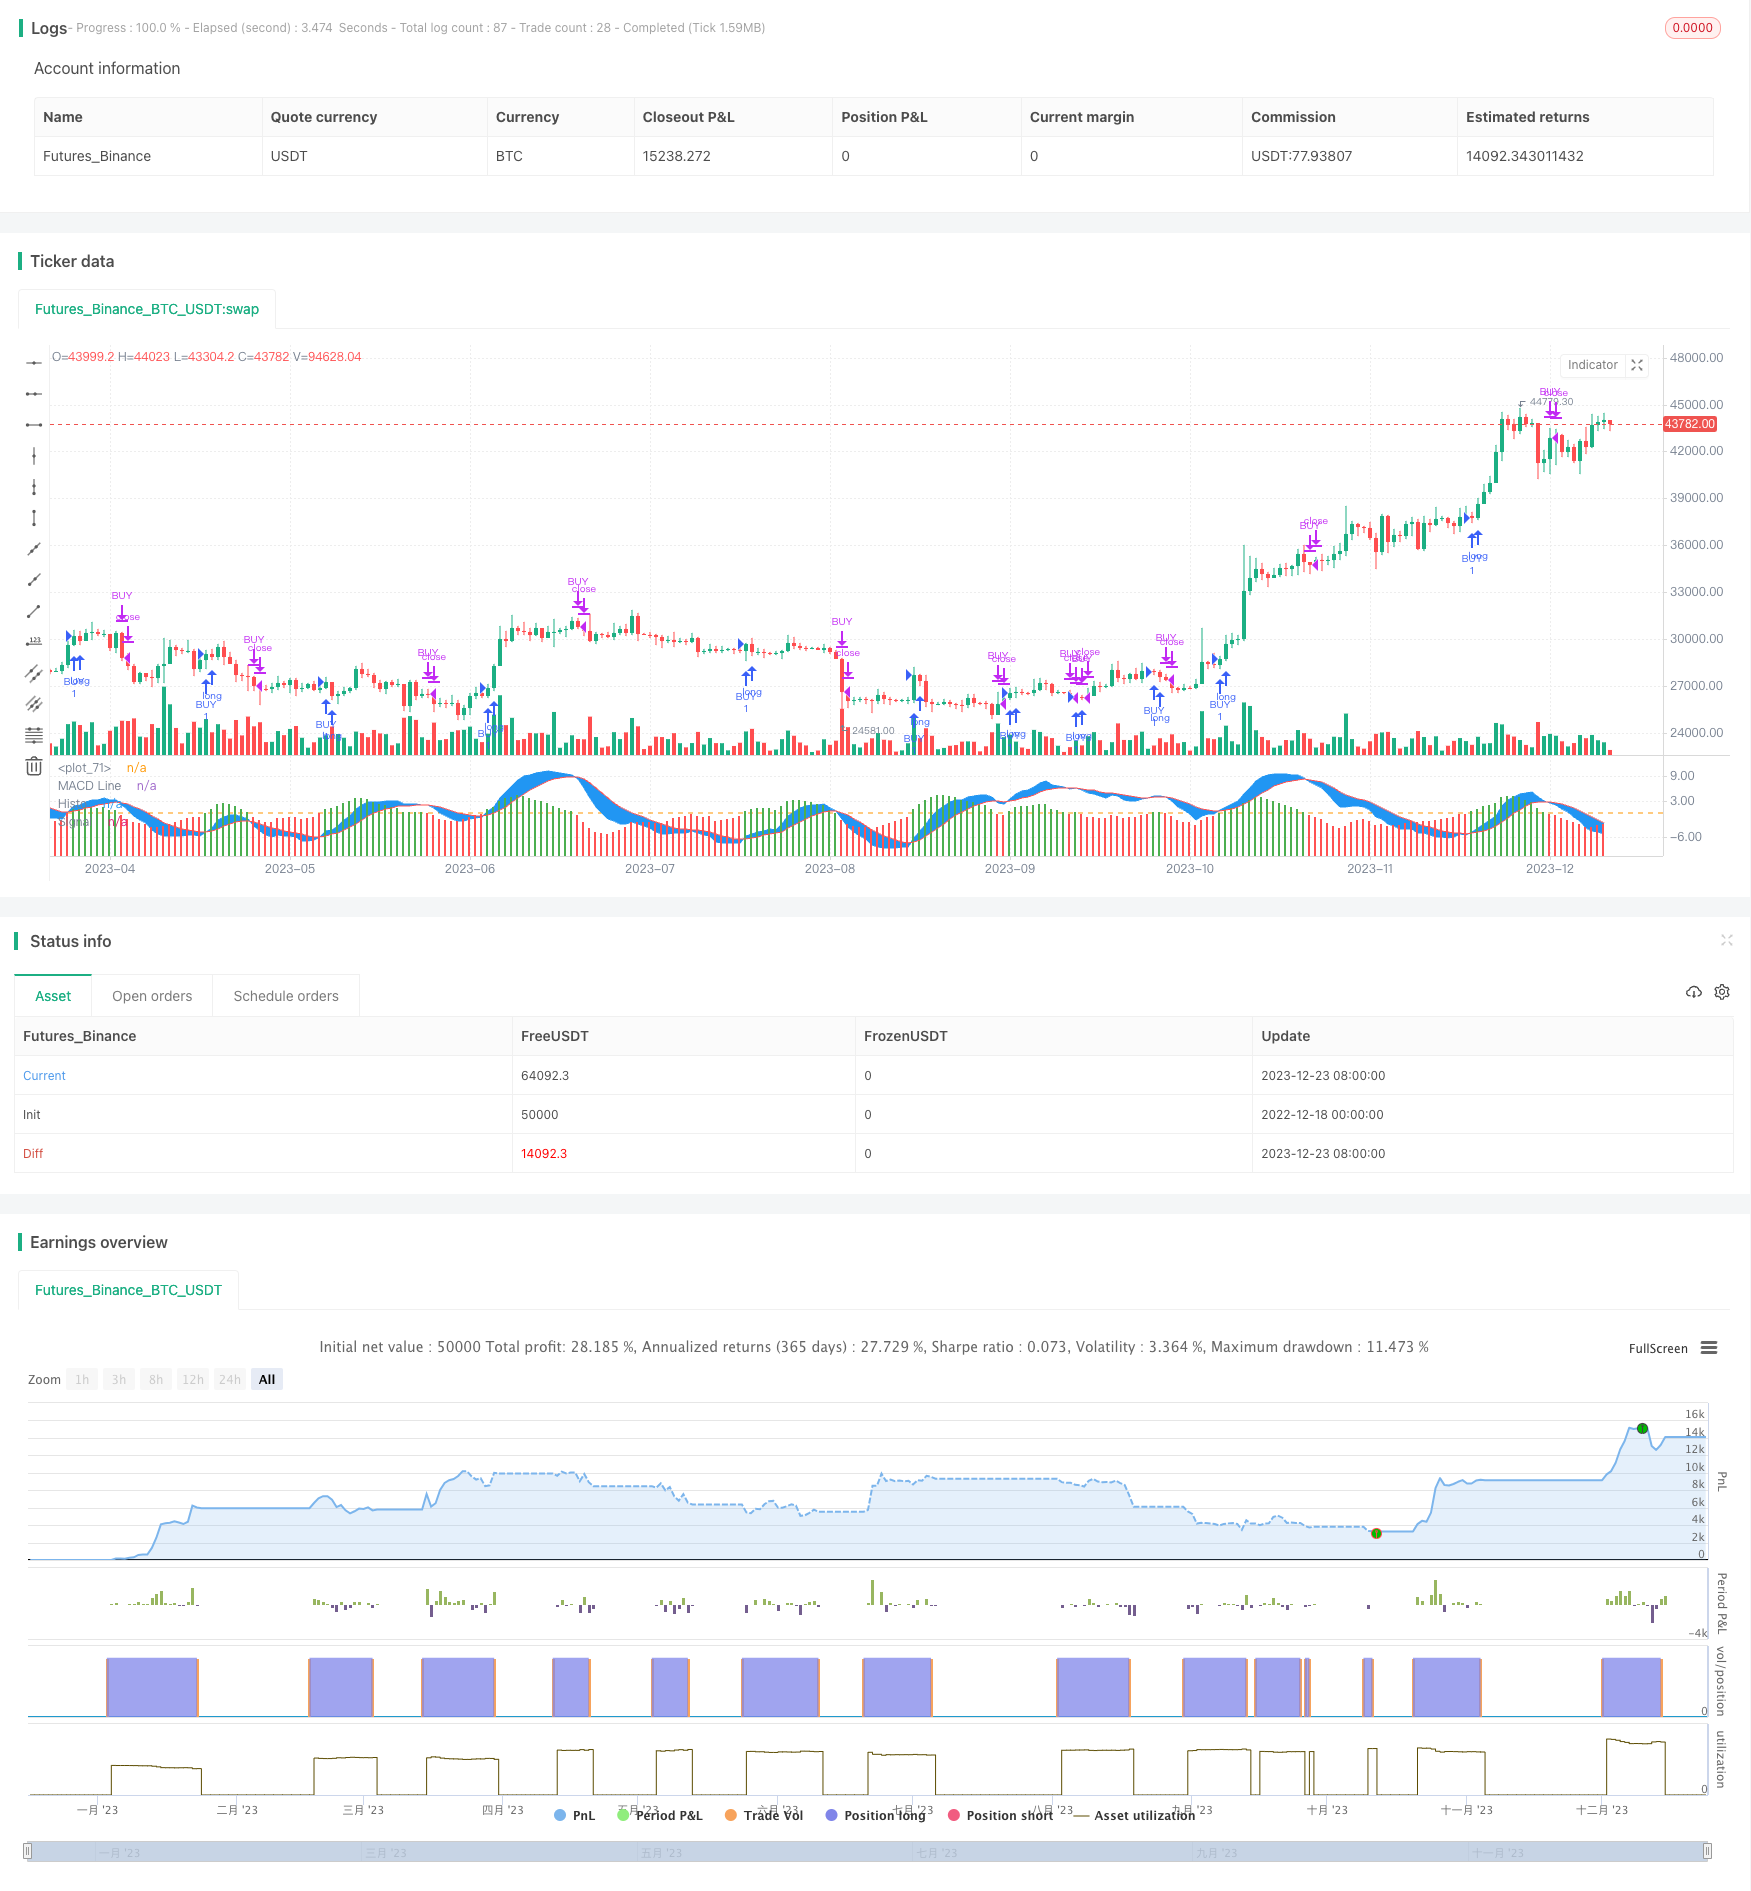
Overview
This strategy generates trading signals based on the MACD of RSI indicator. It combines the RSI indicator's ability to judge overbought and oversold levels in the market, as well as MACD's advantage in determining market trend and momentum changes, to design a strategy that utilizes multiple indicators to provide trading signals.
Strategy Logic
The strategy first calculates the RSI indicator, then computes the MACD based on the RSI indicator. The RSI indicator can determine the overbought and oversold conditions in the market, while the MACD captures changes in market trend and momentum.
Specifically, the strategy first calculates the 14-period RSI indicator. Then based on the RSI, the MACD indicator is computed, including 12 and 26-period EMAs, as well as a 9-period signal line. The MACD histogram is then calculated.
When the MACD histogram crosses above 0, a buy signal is generated. When the MACD histogram crosses below 0, a sell signal is triggered. This way, the strategy utilizes RSI to judge overbought/oversold levels, while also using MACD to determine trend and momentum changes, to generate trade signals.
Advantages of the Strategy
This strategy combines the strengths of both RSI and MACD indicators, allowing for a more comprehensive judgment of market conditions, resulting in more reliable signals.
Using RSI to judge overbought/oversold levels helps with stock selection and preventing false breakouts.
MACD's judgment of trend and momentum changes makes trade signals clearer.
The combination of RSI and MACD, with judgments based on multiple factors, helps filter out false signals.
Risks of the Strategy
Parameter settings for RSI and MACD affect strategy performance and require tuning and optimization.
The combination of multiple indicators increases strategy complexity and the probability of errors.
MACD trade signals may lag and need to be complemented by other indicators.
Optimization Directions
Optimize RSI and MACD parameters to find best parameter combinations.
Incorporate other indicators like KDJ, Bollinger Bands to form an indicator cluster and improve signal accuracy.
Incorporate stop loss strategies to control per trade loss.
Optimize entry and exit logic to prevent conflicting signals.
Conclusion
This strategy utilizes the combined strengths of RSI and MACD indicators to form trade signals, judging overbought/oversold levels while also considering trend and momentum factors, effectively filtering out false signals and providing quality signals. Next steps involve further enhancements like parameter optimization, stop loss, adding more indicators etc. to improve signal accuracy and reliability.
Parameters
| Name | Default | What it controls |
|---|---|---|
| v_input_1 | 14 | Length |
| v_input_2 | 12 | fastLength |
| v_input_3 | 26 | slowLength |
| v_input_4 | 9 | signalLength |
| v_input_5 | 6 | monthfrom |
| v_input_6 | 12 | monthuntil |
| v_input_7 | true | dayfrom |
| v_input_8 | 31 | dayuntil |
Source Pine Script
/*backtest
start: 2022-12-18 00:00:00
end: 2023-12-24 00:00:00
period: 1d
basePeriod: 1h
exchanges: [{"eid":"Futures_Binance","currency":"BTC_USDT"}]
*/

//@version=3

strategy(title = "MACD of RSI", overlay = false)
//////////////////////// RSI ///////////////////////////

src = close, len = input(14, minval=1, title="Length")

up = sma(max(change(src), 0), len)

down = sma(-min(change(src), 0), len)

rsi = down == 0 ? 100 : up == 0 ? 0 : 100 - (100 / (1 + up / down))

//////////////////////// RSI   //////////////////////////

//////////////// MACD  ////////////////////////////

sourcemacd = rsi

fastLength = input(12, minval=1), slowLength=input(26,minval=1)

signalLength=input(9,minval=1)


fastMA = ema(sourcemacd, fastLength)

slowMA = ema(sourcemacd, slowLength)

macd = fastMA - slowMA

signal = ema(macd, signalLength)

delta=macd-signal

swap1 = delta>0?green:red


plot(delta,color=swap1,style=columns,title='Histo',histbase=0,transp=20)

p1 = plot(macd,color=blue,title='MACD Line')

p2 = plot(signal,color=red,title='Signal')

fill(p1, p2, color=blue)

hline(0)

/////////////////////////MACD  //////////////////////////

// Conditions

longCond = na

sellCond = na

longCond :=  crossover(delta,0)

sellCond :=  crossunder(delta,0)

monthfrom =input(6)

monthuntil =input(12)

dayfrom=input(1)

dayuntil=input(31)

if (  longCond   )

    strategy.entry("BUY", strategy.long, stop=close, oca_name="TREND", comment="BUY")

else

    strategy.cancel(id="BUY")

if ( sellCond   )

strategy.close("BUY")Published by ChaoZhang on the FMZ strategy square · last modified 2023-12-25. Collected in the Quant Trading Vault. Unvalidated research: re-test with your own data and costs before trusting it.
Build this with AgenKit
A spec is not a trading system. Paste this into your coding agent and AgenKit runs a specialist team — architecture, test-first build, risk gates, review — with paper trading on by default.
/agenkit build a production-grade trading bot with a backtest engine, risk controls and paper trading by default from strategies/MACD-Histogram-Strategy-of-RSI.md- npx agenkit install engineering-kit in your project
- Paste the command into your agent and approve each phase
- Get tests, backtest, risk controls and a paper-trading switch
Understand it first
Before you run this, read the lesson behind the idea and how to backtest it honestly. Specs like this one are the survivors of an unknown number of trials; deflate their results accordingly.
Related specs
- Momentum Breakout Moving Average StrategyPine Script · Breakout · 1d
- Momentum Breakout Trading Strategy 440964Pine Script · Breakout · 5m
- Moving Average Crossover and Upper Rail Breakthrough Impulse StrategyPine Script · Breakout · 1m
- Quadruple Crossing StrategyPine Script · Breakout · 1h
- Moving Average Breakout and Bollinger Band Breakout StrategyPine Script · Breakout · 4h
- MACD Bollinger Turtle Trading StrategyPine Script · Breakout · 1d