Momentum Breakout and Engulfing Pattern Algorithmic Trading Strategy
This article introduces an algorithmic trading strategy that identifies profitable opportunities through engulfing patterns and uses price crossover with moving average as entry signals. Combining technical analysis…
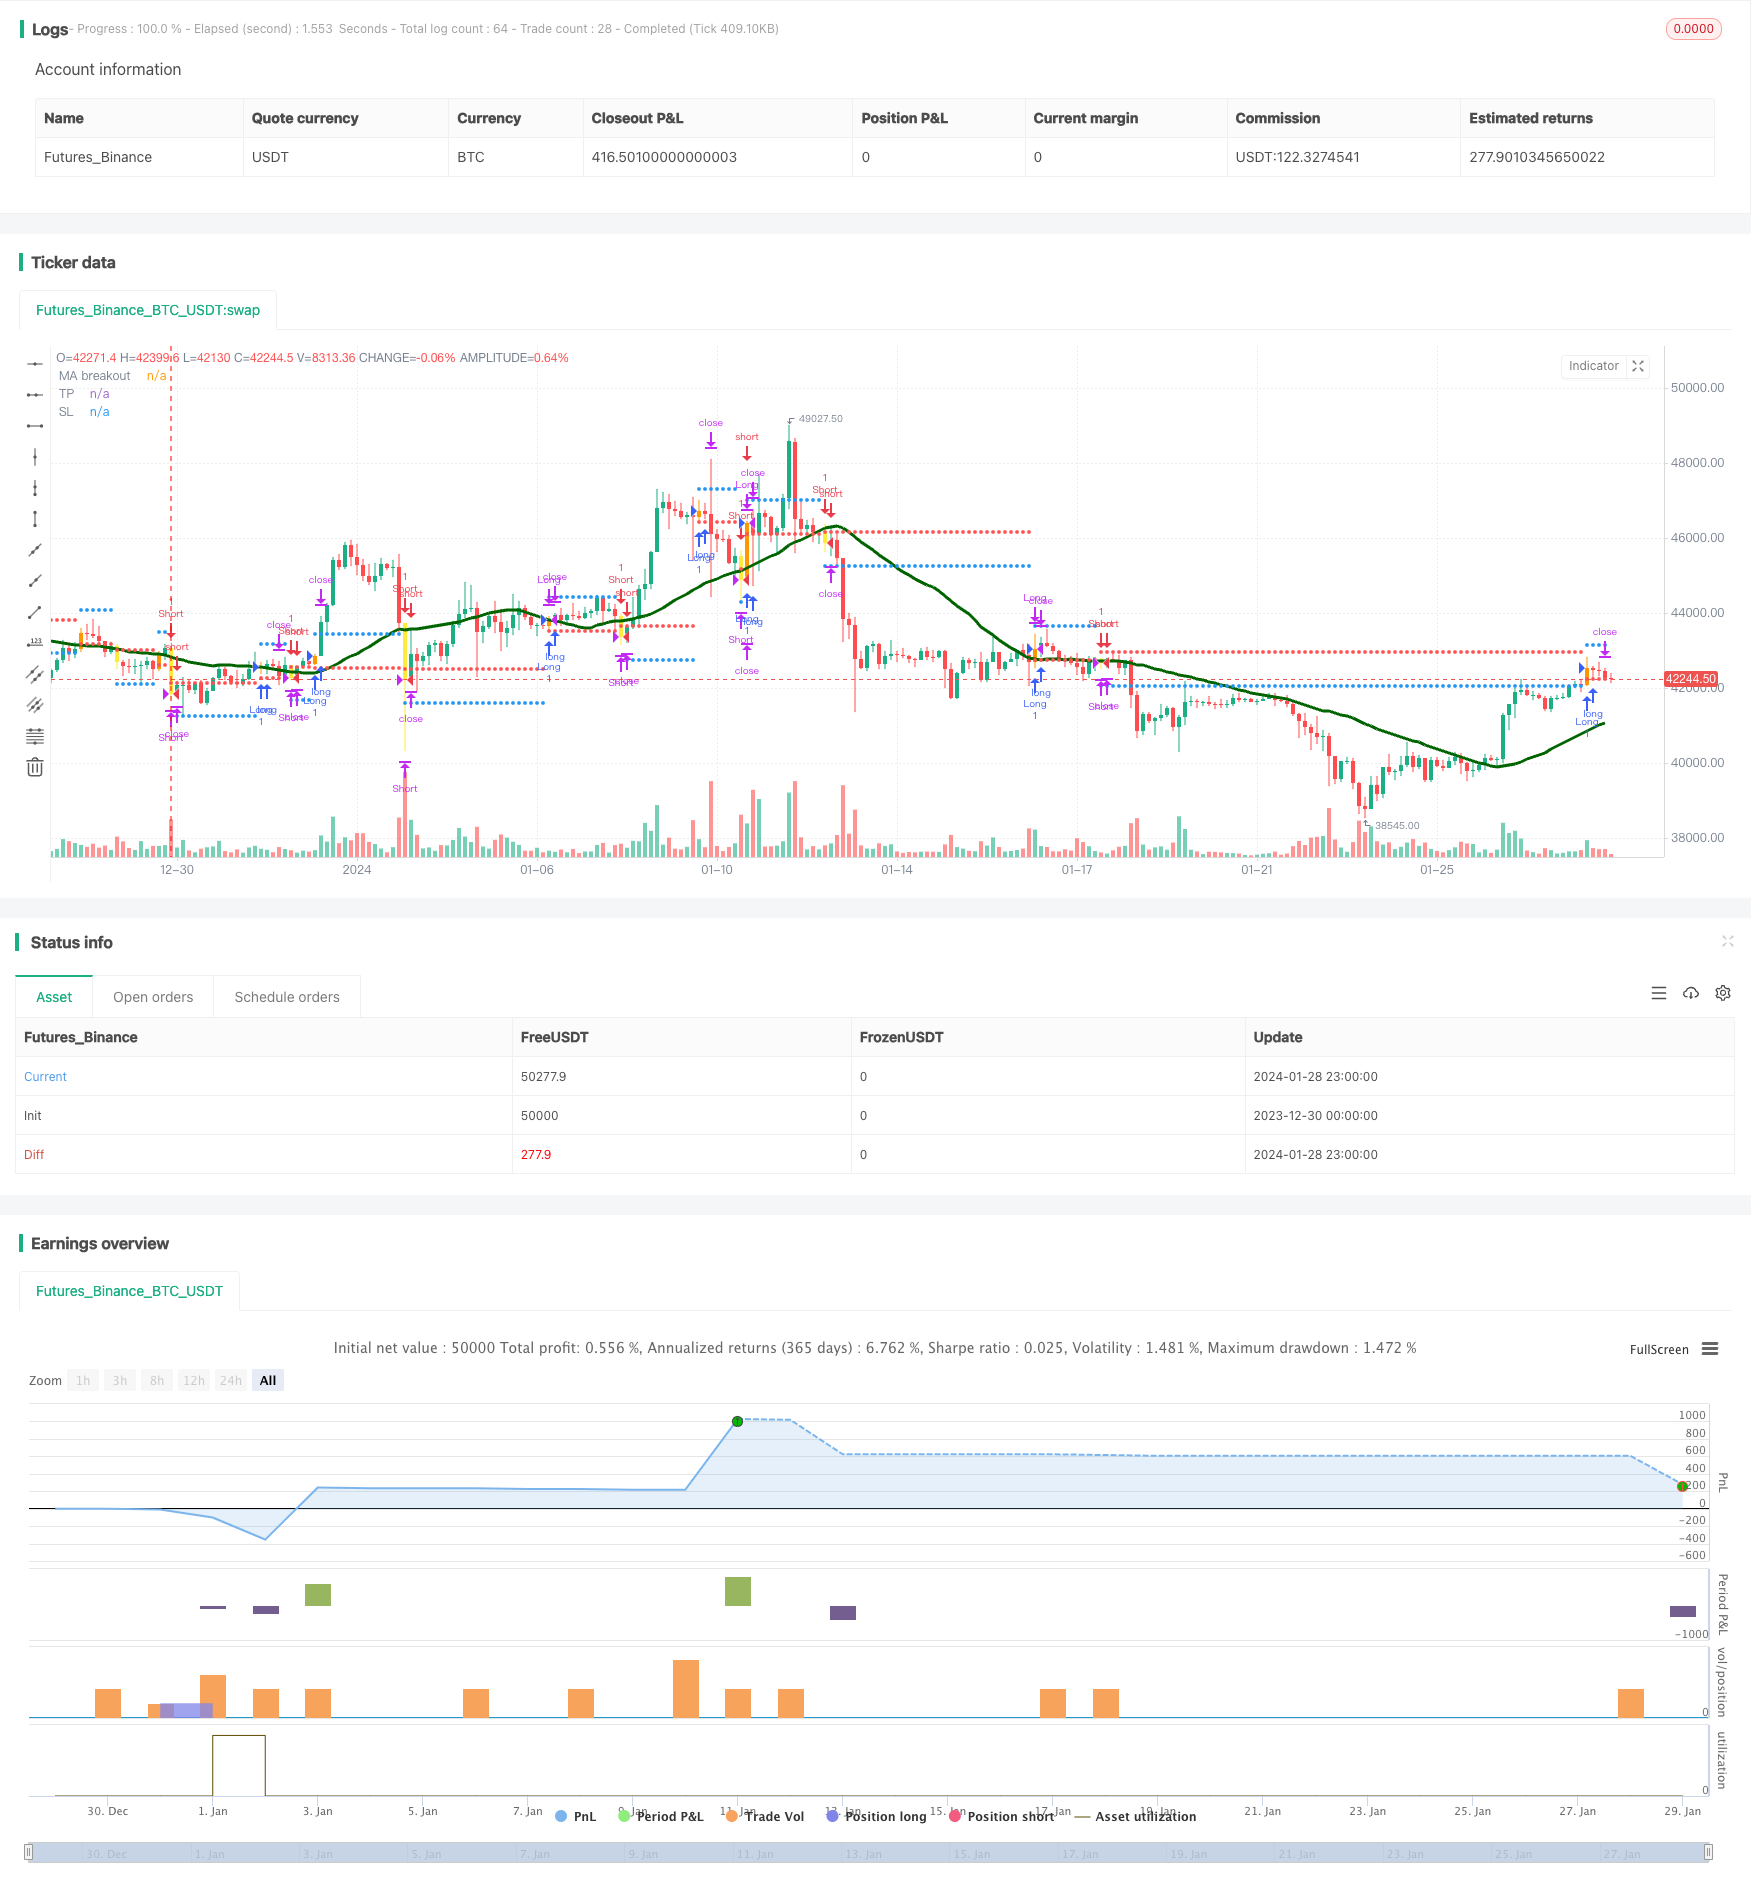
Overview
This article introduces an algorithmic trading strategy that identifies profitable opportunities through engulfing patterns and uses price crossover with moving average as entry signals. Combining technical analysis with trend following methods, this strategy aims to profit at consolidation and trend reversal points.
Principles
The core logic of this strategy is based on the convergence of two unrelated indicators:
Engulfing Pattern: A two-candlestick reversal pattern in which the body of the second candle completely "engulfs" the body of the first one, used to identify reversal opportunities.
Price Crossover with Moving Average: A buy signal is generated when the price crosses above the moving average line from below; A sell signal is when the price crosses below the moving average line from above.
By judging the timing of potential market reversal with engulfing patterns and using price crossover with moving average as confirmation signals, the probability of profiting can be improved.
Specifically, this strategy tracks three types of engulfing patterns - bullish, bearish and no shadow engulfing to determine possible consolidation and reversals. Together with the golden cross and dead cross signals of price and moving average crossover, the direction of opening positions is finally determined.
Advantages
The biggest advantage of this strategy is utilizing the convergence of unrelated indicators to improve decision efficacy. Engulfing patterns judge the timing and probability of market reversal; while price crossover with moving average verifies the direction and momentum of the reversal. The two validate each other and can effectively reduce trading losses caused by false signals.
Another advantage is the flexibility of parameter settings. Users can set parameters like moving average period and stop loss range to optimize the strategy themselves.
Risks
Although using multiple indicators improves judgement, there are still some risks of false signals in this strategy. Engulfing patterns are not 100% reliable reversal signals, and failure scenarios also exist in price crossover with moving average. These can all lead to losses from premature opening positions.
Moreover, like most technical analysis strategies, it also performs poorly in conflicting trending markets like ranging and consolidation. Prolonged sideways price action may trigger stop loss or limit profit capturing space.
To control risks, parameters like moving average period and stop loss range can be adjusted accordingly. Other indicators can also be considered to identify trending and sideways markets, so that strategy participation can be managed dynamically.
Optimization Directions
The following areas can be optimized for this strategy:
Test more moving average types to find optimal parameter sets, like weighted moving average, double smoothed moving average etc.
Add trend judging indicators to avoid opening positions in sideways markets. Examples are ADX, Bollinger Bands etc.
Optimize stop loss methods to improve efficacy. Trailing stop loss, Chandelier Exit can be considered.
Increase machine learning methods to judge candlestick patterns and improve engulfing recognition accuracy.
Add parameter optimization functions for adaptive adjustment.
Conclusion
This strategy identifies reversal timing with engulfing patterns and verifies the direction using price crossover with moving average. By improving decision efficacy through indicator convergence, it is a technical analysis approach. Advantages include complementary indicators and flexible parameters. Disadvantages are risks of false signals and weakness in sideways markets. Ways to further enhance this strategy include optimizing moving average parameters, stop loss methods, adding trend filtering indicators etc.
Parameters
| Name | Default | What it controls |
|---|---|---|
| v_input_1_close | 0 | Source Price vs MA: close | high | low | open | hl2 | hlc3 | hlcc4 | ohlc4 |
| v_input_2 | 0 | Type of MA: SMA | RMA | EMA | WMA | VWMA | SMMA | KMA | TMA | HullMA | DEMA | TEMA |
| v_input_3 | 32 | MA Length |
| v_input_4 | 2017 | Backtest Start Year |
| v_input_5 | true | Backtest Start Month |
| v_input_6 | true | Backtest Start Day |
| v_input_7 | 2020 | Backtest Stop Year |
| v_input_8 | 12 | Backtest Stop Month |
| v_input_9 | 31 | Backtest Stop Day |
| v_input_10 | 600 | Backtest Profit Goal (in USD) |
| v_input_11 | 300 | Backtest STOP Goal (in USD) |
Source Pine Script
/*backtest
start: 2023-12-30 00:00:00
end: 2024-01-29 00:00:00
period: 3h
basePeriod: 15m
exchanges: [{"eid":"Futures_Binance","currency":"BTC_USDT"}]
*/

//@version=4
//@author=Daveatt

StrategyName = "BEST Engulfing + MA"
ShortStrategyName = "BEST Engulfing + MA"

strategy(title=StrategyName, shorttitle=ShortStrategyName, overlay=true)

includeEngulfing = true

includeMA = true
source_ma = input(title="Source Price vs MA", type=input.source, defval=close)
typeofMA = input(title="Type of MA", defval="SMA", options=["RMA", "SMA", "EMA", "WMA", "VWMA", "SMMA", "KMA", "TMA", "HullMA", "DEMA", "TEMA"])
length_ma = input(32, title = "MA Length", type=input.integer)

// ---------- Candle components and states
GreenCandle = close > open
RedCandle = close < open
NoBody = close==open
Body = abs(close-open)


// bullish conditions
isBullishEngulfing1 = max(close[1],open[1]) < max(close,open) and min(close[1],open[1]) > min(close,open) and Body > Body[1] and GreenCandle and RedCandle[1]
isBullishEngulfing2 = max(close[1],open[1]) < max(close,open) and min(close[1],open[1]) <= min(close,open) and Body > Body[1] and GreenCandle and RedCandle[1]

// bearish conditions
isBearishEngulfing1 = max(close[1],open[1]) < max(close,open) and min(close[1],open[1]) > min(close,open) and Body > Body[1] and RedCandle and GreenCandle[1]
isBearishEngulfing2 = max(close[1],open[1]) >= max(close,open) and min(close[1],open[1]) > min(close,open) and Body > Body[1] and RedCandle and GreenCandle[1]

// consolidation of conditions
isBullishEngulfing = isBullishEngulfing1 or isBullishEngulfing2
isBearishEngulfing = isBearishEngulfing1 or isBearishEngulfing2

//isBullishEngulfing = max(close[1],open[1]) < max(close,open) and min(close[1],open[1]) > min(close,open) and Body > Body[1] and GreenCandle and RedCandle[1]
//isBearishEngulfing = max(close[1],open[1]) < max(close,open) and min(close[1],open[1]) > min(close,open) and Body > Body[1] and RedCandle and GreenCandle[1]

Engulf_curr = 0 - barssince(isBearishEngulfing) + barssince(isBullishEngulfing)
Engulf_Buy = Engulf_curr < 0 ? 1 : 0
Engulf_Sell = Engulf_curr > 0 ? 1 : 0


// Price vs MM


smma(src, len) =>
    smma = 0.0
    smma := na(smma[1]) ? sma(src, len) : (smma[1] * (len - 1) + src) / len
    smma

ma(smoothing, src, length) =>
    if smoothing == "RMA"
        rma(src, length)
    else
        if smoothing == "SMA"
            sma(src, length)
        else
            if smoothing == "EMA"
                ema(src, length)
            else
                if smoothing == "WMA"
                    wma(src, length)
				else
					if smoothing == "VWMA"
						vwma(src, length)
					else
						if smoothing == "SMMA"
						    smma(src, length)
						else
							if smoothing == "HullMA"
								wma(2 * wma(src, length / 2) - wma(src, length), round(sqrt(length)))
							else
								if smoothing == "LSMA"
									src
								else
								    if smoothing == "KMA"
								        xPrice = src
                                        xvnoise = abs(xPrice - xPrice[1])
                                        nfastend = 0.666
                                        nslowend = 0.0645
                                        nsignal = abs(xPrice - xPrice[length])
                                        nnoise = sum(xvnoise, length)
                                        nefratio = iff(nnoise != 0, nsignal / nnoise, 0)
                                        nsmooth = pow(nefratio * (nfastend - nslowend) + nslowend, 2)
                                        nAMA = 0.0
                                        nAMA := nz(nAMA[1]) + nsmooth * (xPrice - nz(nAMA[1]))
                                        nAMA
								    else
								        if smoothing == "TMA"
									        sma(sma(close, length), length)
						                else
							                if smoothing == "DEMA"
							                    2 * src - ema(src, length)
							                else
							                    if smoothing == "TEMA"
							                        3 * (src - ema(src, length)) + ema(ema(src, length), length)
							                    else
		    							            src


MA = ma(typeofMA, source_ma, length_ma)

plot(MA, color=#006400FF, title="MA breakout", linewidth=3)

macrossover  = crossover (source_ma, MA)
macrossunder = crossunder(source_ma, MA)

since_ma_buy = barssince(macrossover)
since_ma_sell = barssince(macrossunder)
macross_curr = 0 - since_ma_sell + since_ma_buy
bullish_MA_cond = macross_curr < 0 ?  1 : 0
bearish_MA_cond = macross_curr > 0 ? 1  : 0

posUp = (Engulf_Buy ? 1 : 0) + (bullish_MA_cond ? 1 : 0)
posDn = (Engulf_Sell ? 1 : 0) + (bearish_MA_cond ? 1 : 0)

conditionUP = posUp == 2 and posUp[1] < 2
conditionDN = posDn == 2 and posDn[1] < 2


sinceUP = barssince(conditionUP)
sinceDN = barssince(conditionDN)

// primary-first signal of the trend
nUP = crossunder(sinceUP,sinceDN)
nDN = crossover(sinceUP,sinceDN)


// and the following secondary signals

// save of the primary signal
sinceNUP = barssince(nUP)
sinceNDN = barssince(nDN)

buy_trend   = sinceNDN > sinceNUP
sell_trend  = sinceNDN < sinceNUP

// engulfing by
barcolor(nUP ? color.orange : na, title="Bullish condition")
barcolor(nDN ? color.yellow : na, title="Bearish condition")

isLong  = nUP
isShort = nDN

long_entry_price    = valuewhen(nUP, close, 0)
short_entry_price   = valuewhen(nDN, close, 0)

longClose   = close[1] < MA
shortClose  = close[1] > MA

///////////////////////////////////////////////
//* Backtesting Period Selector | Component *//
///////////////////////////////////////////////


StartYear = input(2017, "Backtest Start Year",minval=1980)
StartMonth = input(1, "Backtest Start Month",minval=1,maxval=12)
StartDay = input(1, "Backtest Start Day",minval=1,maxval=31)
testPeriodStart = timestamp(StartYear,StartMonth,StartDay,0,0)

StopYear = input(2020, "Backtest Stop Year",minval=1980)
StopMonth = input(12, "Backtest Stop Month",minval=1,maxval=12)
StopDay = input(31, "Backtest Stop Day",minval=1,maxval=31)
testPeriodStop = timestamp(StopYear,StopMonth,StopDay,0,0)

testPeriod() => true


//////////////////////////
//* Profit Component *//
//////////////////////////

input_tp_pips = input(600, "Backtest Profit Goal (in USD)",minval=0)
input_sl_pips = input(300, "Backtest STOP Goal (in USD)",minval=0)


tp = buy_trend? long_entry_price + input_tp_pips : short_entry_price - input_tp_pips
sl = buy_trend? long_entry_price - input_sl_pips : short_entry_price + input_sl_pips


long_TP_exit  = buy_trend and high >= tp
short_TP_exit = sell_trend and low <= tp

plot(tp, title="TP", style=plot.style_circles, linewidth=3, color=color.blue)
plot(sl, title="SL", style=plot.style_circles, linewidth=3, color=color.red)

if testPeriod()
    strategy.entry("Long", 1, when=isLong)
    strategy.close("Long", when=longClose )
    strategy.exit("XL","Long", limit=tp,  when=buy_trend, stop=sl)


if testPeriod()
    strategy.entry("Short", 0,  when=isShort)
    strategy.close("Short", when=shortClose )
    strategy.exit("XS","Short", when=sell_trend, limit=tp, stop=sl)
Published by ChaoZhang on the FMZ strategy square · last modified 2024-01-30. Collected in the Quant Trading Vault. Unvalidated research: re-test with your own data and costs before trusting it.
Build this with AgenKit
A spec is not a trading system. Paste this into your coding agent and AgenKit runs a specialist team — architecture, test-first build, risk gates, review — with paper trading on by default.
/agenkit build a production-grade trading bot with a backtest engine, risk controls and paper trading by default from strategies/Momentum-Breakout-and-Engulfing-Pattern-Algorithmic-Trading-Strategy.md- npx agenkit install engineering-kit in your project
- Paste the command into your agent and approve each phase
- Get tests, backtest, risk controls and a paper-trading switch
Understand it first
Before you run this, read the lesson behind the idea and how to backtest it honestly. Specs like this one are the survivors of an unknown number of trials; deflate their results accordingly.
Related specs
- Adaptive Multi Period Trading Strategy Based on Wave Trend Momentum BreakoutPine Script · Breakout · 2h
- BB Breakout StrategyPine Script · Breakout · 1d
- BMSB Breakout Strategy BMSBPine Script · Breakout · 1h
- Bollinger Band T3 Moving Average StrategyPine Script · Breakout · 10m
- Bollinger Bands Dual track Breakthrough StrategyPine Script · Breakout · 30m
- Bollinger Breakout StrategyPine Script · Breakout · 30m