Momentum Breakout Strategy 432076
This strategy uses Bollinger Bands combined with ATR indicator and EMA lines to determine signals. It generates buy signals when price breaks through the Bollinger upper band and crosses above EMA line quickly. It…
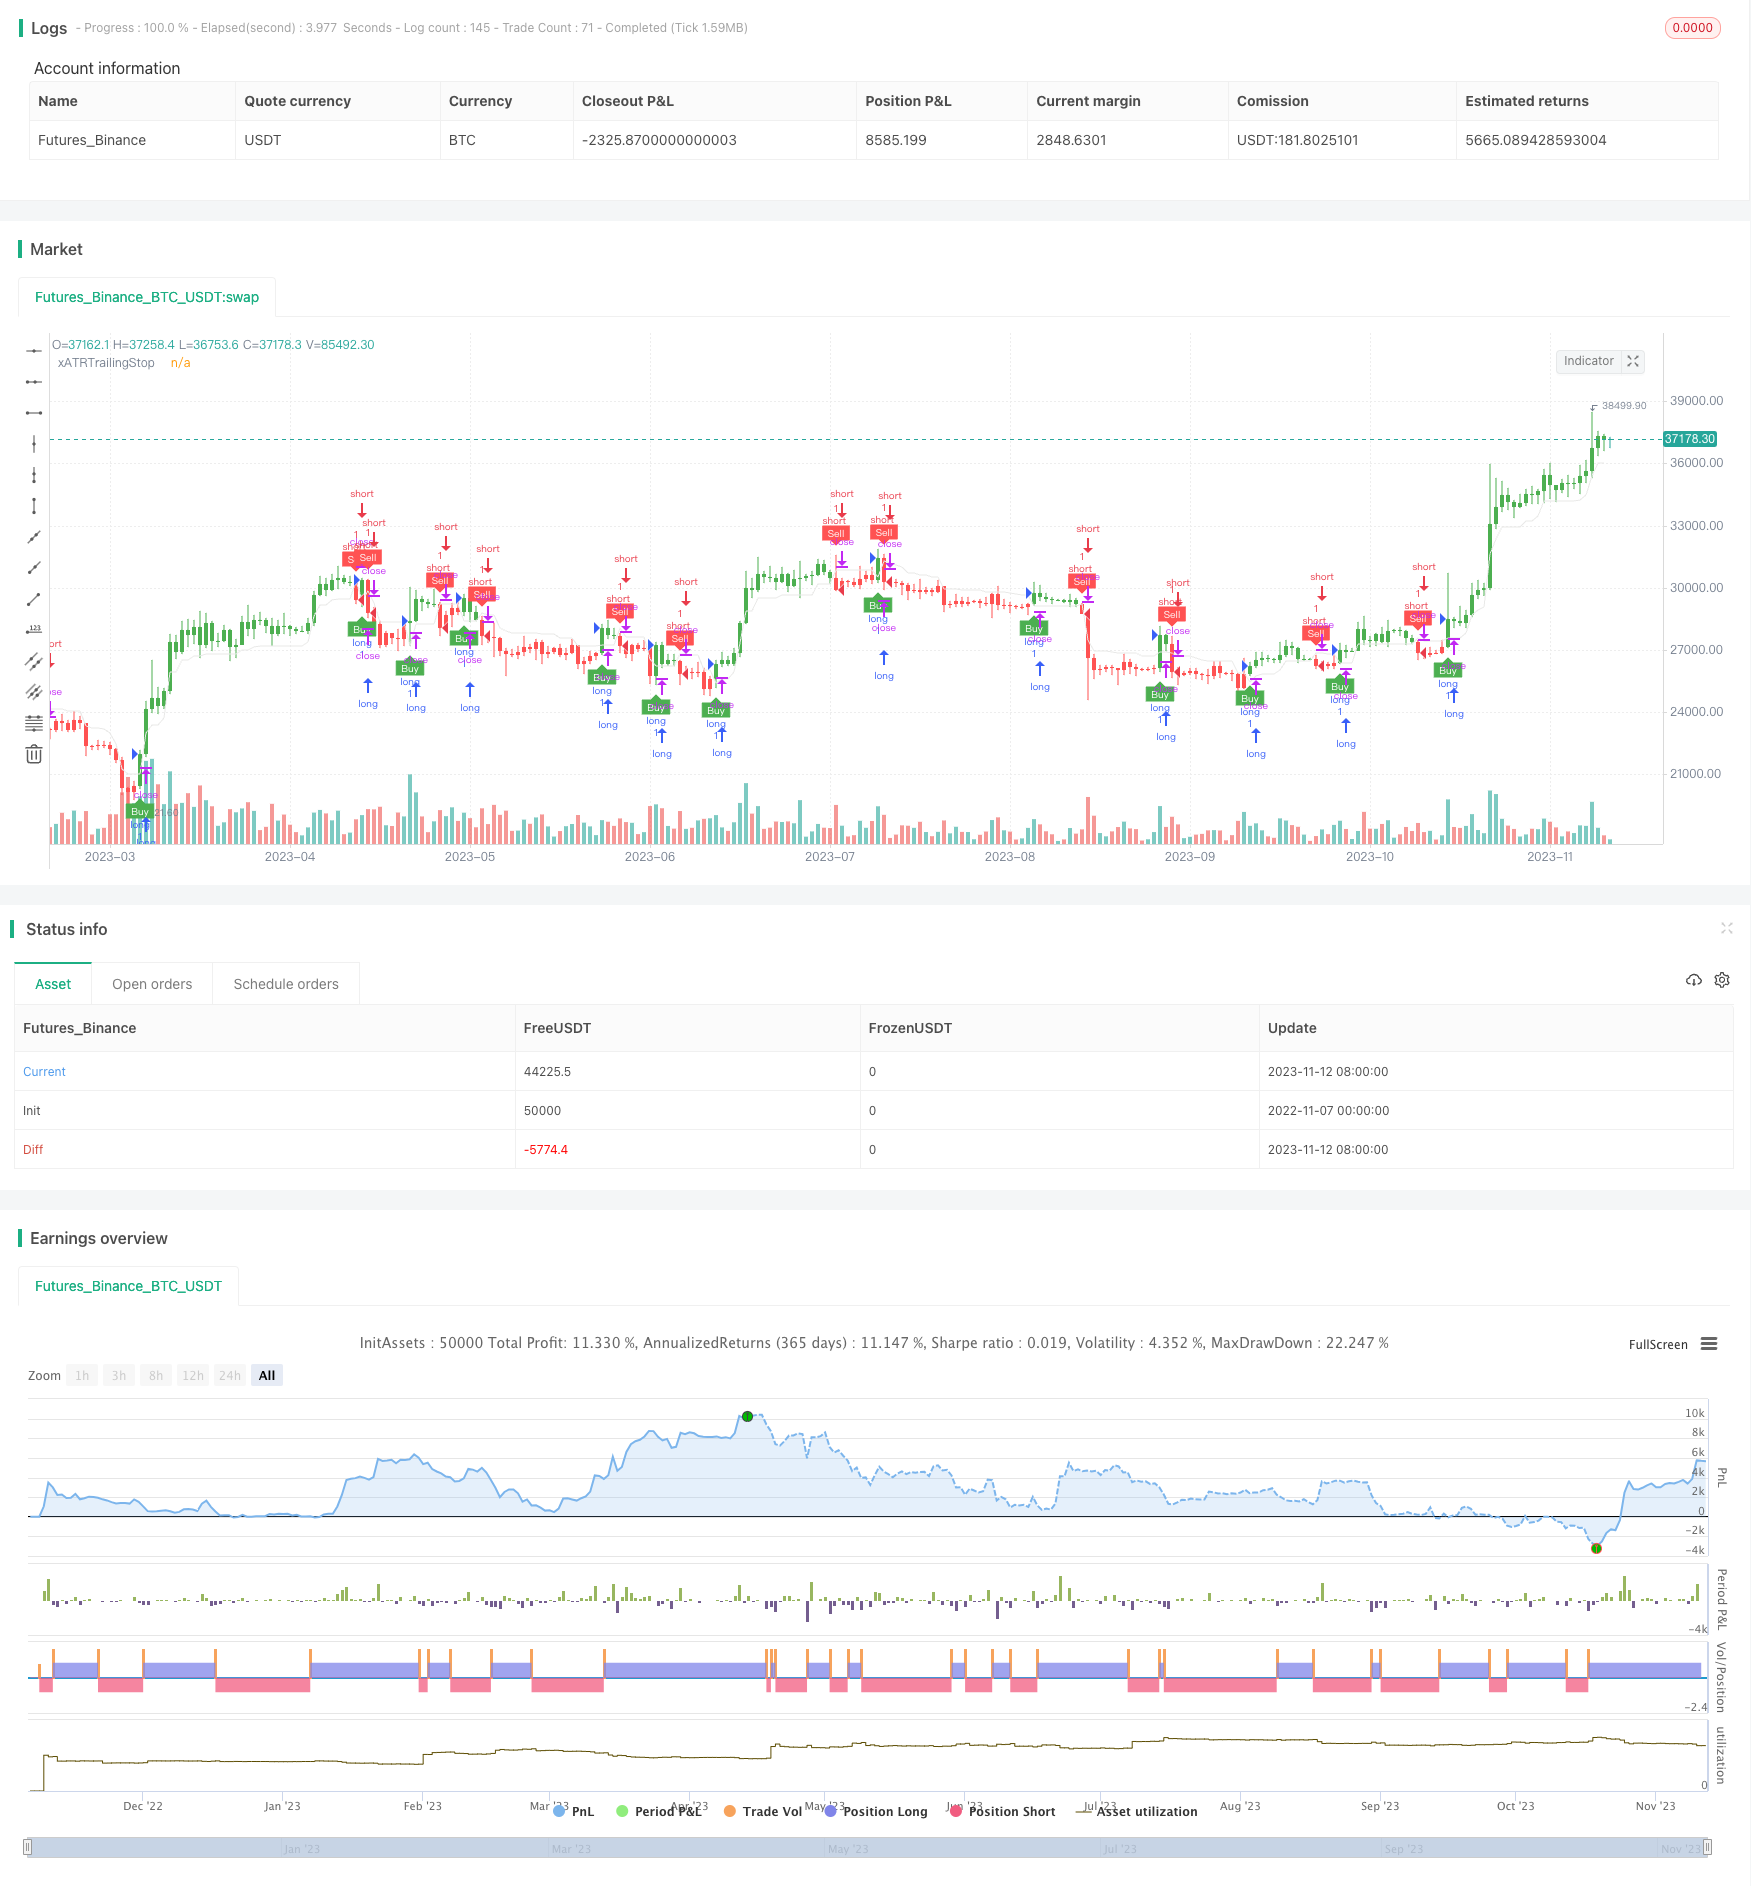
Overview
This strategy uses Bollinger Bands combined with ATR indicator and EMA lines to determine signals. It generates buy signals when price breaks through the Bollinger upper band and crosses above EMA line quickly. It generates sell signals when price breaks through the Bollinger lower band and crosses below EMA line quickly. ATR indicator is used to set stop loss.
Strategy Logic
Calculate Bollinger midline, upper band and lower band. Midline is n-period SMA, upper band is midline + mn-period standard deviation, lower band is midline - mn-period standard deviation.
Calculate ATR indicator to track stop loss.
Calculate 1-period and n-period EMA lines to determine price momentum.
When price crosses above Bollinger upper band and EMA line quickly, a buy signal is generated.
When price crosses below Bollinger lower band and EMA line quickly, a sell signal is generated.
ATR indicator sets stop loss points, tracking price breakout direction to avoid being trapped.
Advantage Analysis
Bollinger Bands combined with ATR stop loss can effectively control risk.
EMA fast and slow lines determine momentum direction, avoiding false breakout.
Adjustable parameters suit different market environments.
Clear buy/sell signals with high trading frequency, suitable for short-term trading.
ATR indicator tracks stop loss in a timely manner.
Risk Analysis
Narrow Bollinger Bands range may cause more noisy trades.
ATR parameter set too small may cause stop loss too close resulting in being trapped.
EMA parameters need adjustment for different cycle effects.
Oscillating market may generate more trades, need caution.
Tracking stop loss may sometimes be too aggressive, causing loss expansion.
Optimization
Combine with other indicators to filter trading signals, e.g. RSI for overbought/oversold, KDJ for divergence etc.
Consider dynamically adjusting Bollinger parameters based on ATR to fit price fluctuation.
Test different EMA cycle parameters for best parameter combination.
Intelligently adjust ATR parameters based on volatility to avoid aggressive stop loss.
Consider incorporating deep learning models to assist timing buy/sell decisions.
Summary
This strategy has clear logic utilizing Bollinger Bands to capture price breakout, ATR to set stop loss range, EMA to determine momentum direction for comprehensive judgment of momentum breakout, which can effectively capture short-term price trends. Combining multiple indicators for comprehensive judgment can improve signal quality. There is still room for optimization via parameter tuning, indicator combinations etc. to further refine this strategy for more stability and elasticity.
Parameters
| Name | Default | What it controls |
|---|---|---|
| v_input_1 | true | Key Vaule. 'This changes the sensitivity' |
| v_input_2 | 10 | ATR Period |
| v_input_3 | false | Signals from Heikin Ashi Candles |
| v_input_4 | 20 | length |
| v_input_5 | 2 | StdDev |
Source Pine Script
/*backtest
start: 2022-11-07 00:00:00
end: 2023-11-13 00:00:00
period: 1d
basePeriod: 1h
exchanges: [{"eid":"Futures_Binance","currency":"BTC_USDT"}]
*/

//@version=4
strategy(title="UT Bot Strategy", overlay = true)
//CREDITS to HPotter for the orginal code. The guy trying to sell this as his own is a scammer lol.
// Inputs
a = input(1,     title = "Key Vaule. 'This changes the sensitivity'")
c = input(10,    title = "ATR Period")
h = input(false, title = "Signals from Heikin Ashi Candles")

src = h ? security(heikinashi(syminfo.tickerid), timeframe.period, close, lookahead = false) : close

length = input(20, minval=1)
mult = input(2.0, minval=0.001, maxval=50, title="StdDev")
basis = sma(src, length)
dev = mult * stdev(src, length)
upper = basis + dev
lower = basis - dev
bbr = (src - lower)/(upper - lower)
// plot(bbr, "Bollinger Bands %B", color=#26A69A)
// band1 = hline(1, "Overbought", color=#787B86, linestyle=hline.style_dashed)
// hline(0.5, "Middle Band", color=color.new(#787B86, 50))
// band0 = hline(0, "Oversold", color=#787B86, linestyle=hline.style_dashed)
// fill(band1, band0, color=color.rgb(38, 166, 154, 90), title="Background")


xATR  = atr(c)
nLoss = a * xATR


xATRTrailingStop = 0.0
xATRTrailingStop := iff(src > nz(xATRTrailingStop[1], 0) and src[1] > nz(xATRTrailingStop[1], 0), max(nz(xATRTrailingStop[1]), src - nLoss),
   iff(src < nz(xATRTrailingStop[1], 0) and src[1] < nz(xATRTrailingStop[1], 0), min(nz(xATRTrailingStop[1]), src + nLoss),
   iff(src > nz(xATRTrailingStop[1], 0), src - nLoss, src + nLoss)))

pos = 0
pos :=	iff(src[1] < nz(xATRTrailingStop[1], 0) and src > nz(xATRTrailingStop[1], 0), 1,
   iff(src[1] > nz(xATRTrailingStop[1], 0) and src < nz(xATRTrailingStop[1], 0), -1, nz(pos[1], 0)))

xcolor = pos == -1 ? color.red: pos == 1 ? color.green : color.blue

ema   = ema(src,1)
emaFast   = ema(src,144)
emaSlow   = ema(src,576)
sma       =  sma(src, c)

above = crossover(ema, xATRTrailingStop)
below = crossover(xATRTrailingStop, ema)

smaabove = crossover(src, sma)
smabelow = crossover(sma, src)


buy  = src > xATRTrailingStop and above and (bbr>20  or bbr<80)
sell = src < xATRTrailingStop and below  and  (bbr>20  or bbr<80)

// buy  = src > xATRTrailingStop
// sell = src < xATRTrailingStop


barbuy  = src > xATRTrailingStop
barsell = src < xATRTrailingStop

// plot(emaFast , color = color.rgb(243, 206, 127), title="emaFast")

plot(xATRTrailingStop, color = color.rgb(233, 233, 232), title="xATRTrailingStop")

plotshape(buy,  title = "Buy",  text = 'Buy',  style = shape.labelup,   location = location.belowbar, color= color.green, textcolor = color.white, transp = 0, size = size.tiny)
plotshape(sell, title = "Sell", text = 'Sell', style = shape.labeldown, location = location.abovebar, color= color.red,   textcolor = color.white, transp = 0, size = size.tiny)


// plotshape(buy,  title = "Sell",  text = 'Sell',  style = shape.labelup,   location = location.belowbar, color= color.green, textcolor = color.white, transp = 0, size = size.tiny)
// plotshape(sell, title = "buy", text = 'buy', style = shape.labeldown, location = location.abovebar, color= color.red,   textcolor = color.white, transp = 0, size = size.tiny)

barcolor(barbuy  ? color.green : na)
barcolor(barsell ? color.red   : na)

// strategy.entry("short",   false, when = buy)
// strategy.entry("long ", true, when = sell)


strategy.entry("long",   true, when = buy)
strategy.entry("short ", false, when = sell)Published by ChaoZhang on the FMZ strategy square · last modified 2023-11-14. Collected in the Quant Trading Vault. Unvalidated research: re-test with your own data and costs before trusting it.
Build this with AgenKit
A spec is not a trading system. Paste this into your coding agent and AgenKit runs a specialist team — architecture, test-first build, risk gates, review — with paper trading on by default.
/agenkit build a production-grade trading bot with a backtest engine, risk controls and paper trading by default from strategies/Momentum-Breakout-Strategy-432076.md- npx agenkit install engineering-kit in your project
- Paste the command into your agent and approve each phase
- Get tests, backtest, risk controls and a paper-trading switch
Understand it first
Before you run this, read the lesson behind the idea and how to backtest it honestly. Specs like this one are the survivors of an unknown number of trials; deflate their results accordingly.
Related specs
- Momentum Breakout Trading Strategy 440964Pine Script · Breakout · 5m
- EMA and Bollinger Bands Breakout StrategyPine Script · Breakout · 1h
- Momentum Breakout Moving Average StrategyPine Script · Breakout · 1d
- Moving Average Crossover and Upper Rail Breakthrough Impulse StrategyPine Script · Breakout · 1m
- Quantitative Trading Strategy Based on Ichimoku with Multiple SignalsPine Script · Breakout · 1h
- Enhanced Bollinger Breakout Quantitative Strategy with Momentum Filter Integration SystemPine Script · Breakout · 2d