Momentum Breakthrough Golden Cross Strategy
This is a quantitative trading strategy that combines MACD, RSI and EMA moving average. It uses MACD golden cross for long entry, RMSI overbought reversal and price breakout below EMA as stop loss exit to track the…
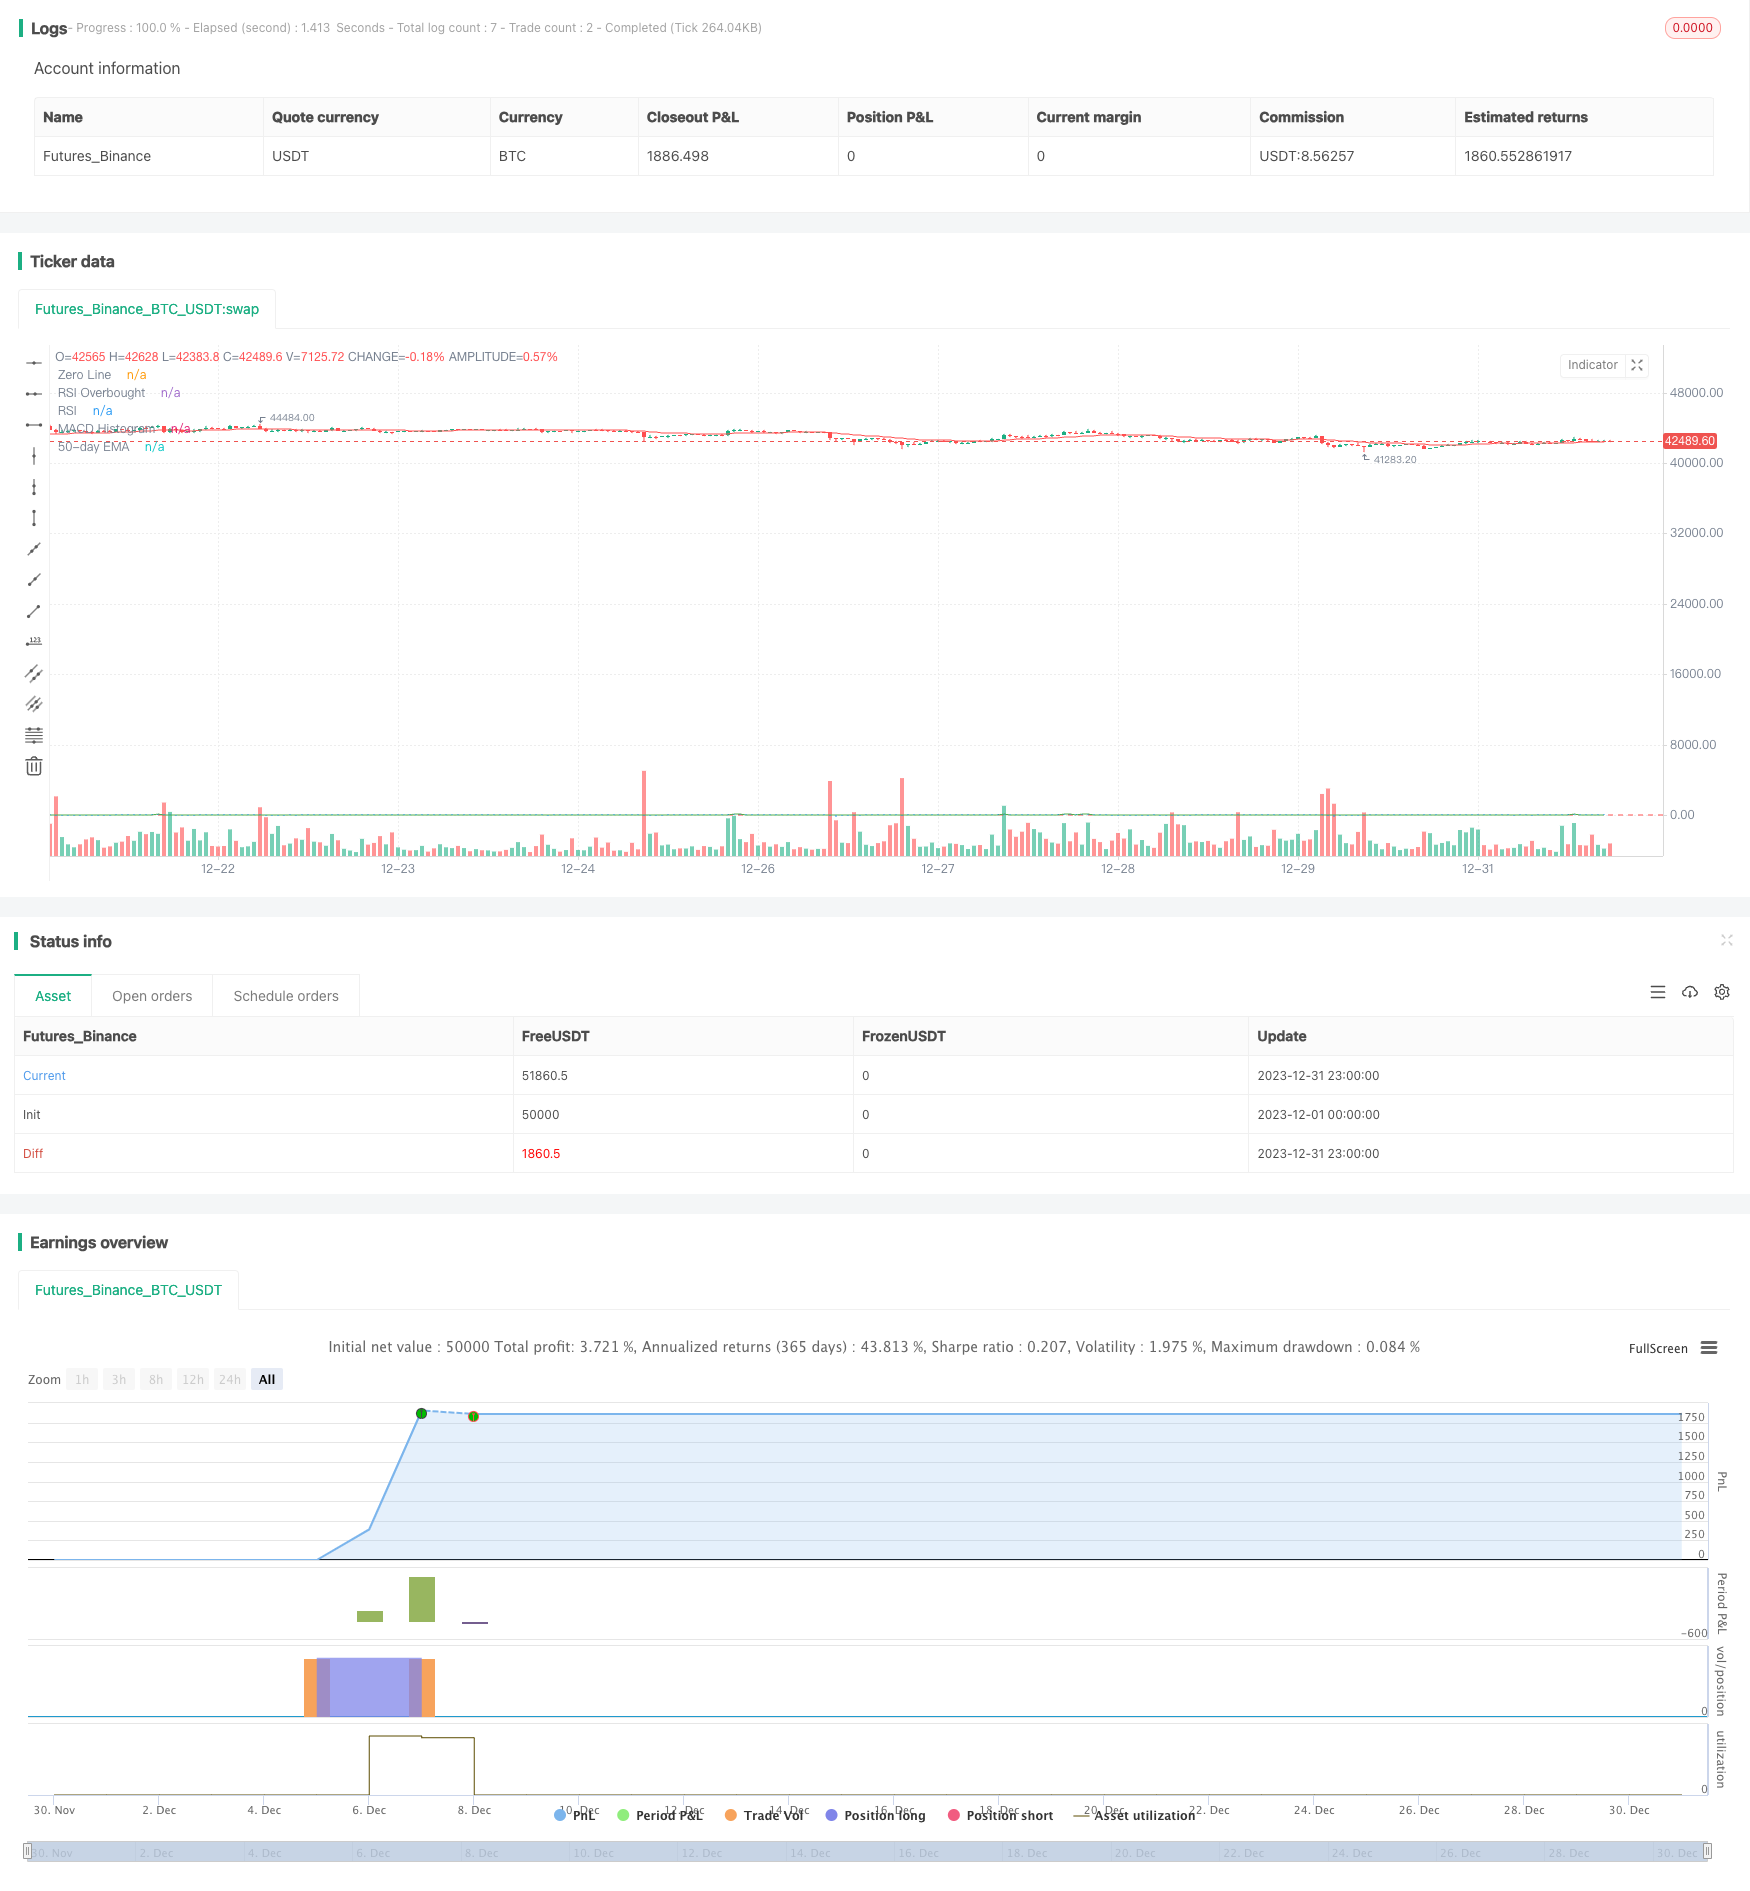
Overview
This is a quantitative trading strategy that combines MACD, RSI and EMA moving average. It uses MACD golden cross for long entry, RMSI overbought reversal and price breakout below EMA as stop loss exit to track the middle-to-long term trends in the market.
Principles
The strategy mainly uses the following three indicators for trading signal judgment and strategy implementation:
MACD: Calculate fast line, slow line and MACD histogram. The strategy judges the timing of entry by the golden cross of fast and slow lines.
RSI: Calculate the 14-period RSI and set the overbought/oversold line. The strategy utilizes the RSI overbought reversal on weekly timeframe to avoid overbought risk.
EMA: Calculate the 50-day EMA line. The strategy sets the stop loss point by the price breakout below this line to control the risk of loss.
A buy signal is generated when the MACD fast line crosses above the slow line from below forming a golden cross. At the same time, require the weekly RSI indicator to be above 50, indicating an overbought state, which helps to grasp the upward trend of this round of market. Finally, a long entry will only be executed when the price is above the 50-day EMA line.
If the price breaks below the 50-day EMA or a MACD dead cross occurs, a stop loss exit will be executed.
Advantage Analysis
The advantage of this strategy combines MACD, RSI and EMA indicators to achieve good breakthrough tracking capability:
MACD golden cross has some lead characteristic that can capture the buy timing of the market earlier.
Based on weekly RSI, it can effectively filter out short-term overbought scenarios and grasp the middle-to-long term uptrend.
The EMA stop loss can make timely stop losses on sudden down trends, effectively controlling DD.
Overall, this strategy can smoothly capture middle-to-long term breakthrough opportunities and gain decent returns after the market breaks out upwards.
Risk Analysis
Pay attention to the following risks:
MACD golden cross has some lagging properties that may miss the optimal entry point of the market.
The parameter settings of RSI and EMA need repeated testing and optimization, otherwise they may become invalid.
The best buying point of a breakthrough market does not necessarily appear at the moment of golden cross, there is some timing risk.
A stop loss set too loose may lead to larger DD, while a stop loss set too tight may easily be broken by breakthrough yang line.
Optimization Directions
There are still several optimization directions for this strategy:
Test and optimize the MACD parameter combination to find a better balance point.
The RSI cycle and overbought/oversold line can also be optimized.
The moving cycle of EMA can also be adjusted appropriately to find better parameters.
Secondary confirmation of the entry timing can be made based on advanced technical indicators, such as the KDJ indicator.
Test stop loss exit strategies by adopting percentage-based moving stop loss or quantitative stop loss to make the stop loss smarter.
Conclusion
In general, this strategy is a typical mid-to-long term tracking strategy. It combines multiple indicators such as MACD, RSI and EMA to judge the timing of entry in order to obtain a better entry point. It also adopts stop loss measures to control trading risks. The strategy suits middle-to-long term tracking investors, and there is still room for further optimization. With proper parameter tuning, decent returns can also be obtained.
Parameters
| Name | Default | What it controls |
|---|---|---|
| v_input_1 | 5 | Fast Length |
| v_input_2 | 13 | Slow Length |
| v_input_3 | 9 | Signal Length |
| v_input_4 | 21 | EMA Length |
| v_input_5 | 14 | RSI Length |
| v_input_6 | 50 | RSI Overbought Level |
Source Pine Script
/*backtest
start: 2023-12-01 00:00:00
end: 2023-12-31 23:59:59
period: 1h
basePeriod: 15m
exchanges: [{"eid":"Futures_Binance","currency":"BTC_USDT"}]
*/

//@version=5
strategy("MACD, EMA, and RSI Strategy", overlay=true)

// Input for MACD
fastLength = input(5, title="Fast Length")
slowLength = input(13, title="Slow Length")
signalLength = input(9, title="Signal Length")

// Input for EMA
emaLength = input(21, title="EMA Length")

// Input for RSI
rsiLength = input(14, title="RSI Length")
rsiOverbought = input(50, title="RSI Overbought Level")

// Calculate MACD on the weekly timeframe
[macdLine, signalLine, _] = ta.macd(close, fastLength, slowLength, signalLength)

// Calculate 50-day EMA
ema50 = ta.ema(close, emaLength)

// Calculate RSI on the weekly timeframe
rsi = ta.rsi(close, rsiLength)

// Condition for Buy Entry
buyCondition = ta.crossover(macdLine, 0) and dayofweek == dayofweek.monday and rsi > rsiOverbought

// Condition for Sell Exit
sellCondition = ta.crossunder(close, ema50) or ta.crossunder(macdLine, 0)

// Execute Buy Entry on the next day's open
if buyCondition
    strategy.entry("My Long Entry Id", strategy.long)

// Execute Sell Exit on the next day's open
if sellCondition
    strategy.close("My Long Entry Id")

// Plotting MACD and EMA
plot(macdLine - signalLine, title="MACD Histogram", color=color.blue, style=plot.style_histogram)
hline(0, "Zero Line", color=color.gray)
plot(ema50, title="50-day EMA", color=color.red)

// Plotting RSI
hline(rsiOverbought, "RSI Overbought", color=color.red)
plot(rsi, title="RSI", color=color.green)
Published by ChaoZhang on the FMZ strategy square · last modified 2024-01-29. Collected in the Quant Trading Vault. Unvalidated research: re-test with your own data and costs before trusting it.
Build this with AgenKit
A spec is not a trading system. Paste this into your coding agent and AgenKit runs a specialist team — architecture, test-first build, risk gates, review — with paper trading on by default.
/agenkit build a production-grade trading bot with a backtest engine, risk controls and paper trading by default from strategies/Momentum-Breakthrough-Golden-Cross-Strategy.md- npx agenkit install engineering-kit in your project
- Paste the command into your agent and approve each phase
- Get tests, backtest, risk controls and a paper-trading switch
Understand it first
Before you run this, read the lesson behind the idea and how to backtest it honestly. Specs like this one are the survivors of an unknown number of trials; deflate their results accordingly.
Related specs
- Bull Market Tracking SystemPine Script · Breakout · 1h
- MA Trendline Breakthrough StrategyPine Script · Breakout · 1d
- Momentum Breakout Moving Average StrategyPine Script · Breakout · 1d
- Momentum Breakout Trading Strategy 440964Pine Script · Breakout · 5m
- Moving Average Crossover and Upper Rail Breakthrough Impulse StrategyPine Script · Breakout · 1m
- Multi Technical Indicator Dynamic Wave Trading StrategyPine Script · Breakout · 1h