Momentum Integral Indicator Strategy
This strategy generates trading signals by calculating the sum of differences between ROC and SMA. It belongs to short-term trading strategies.
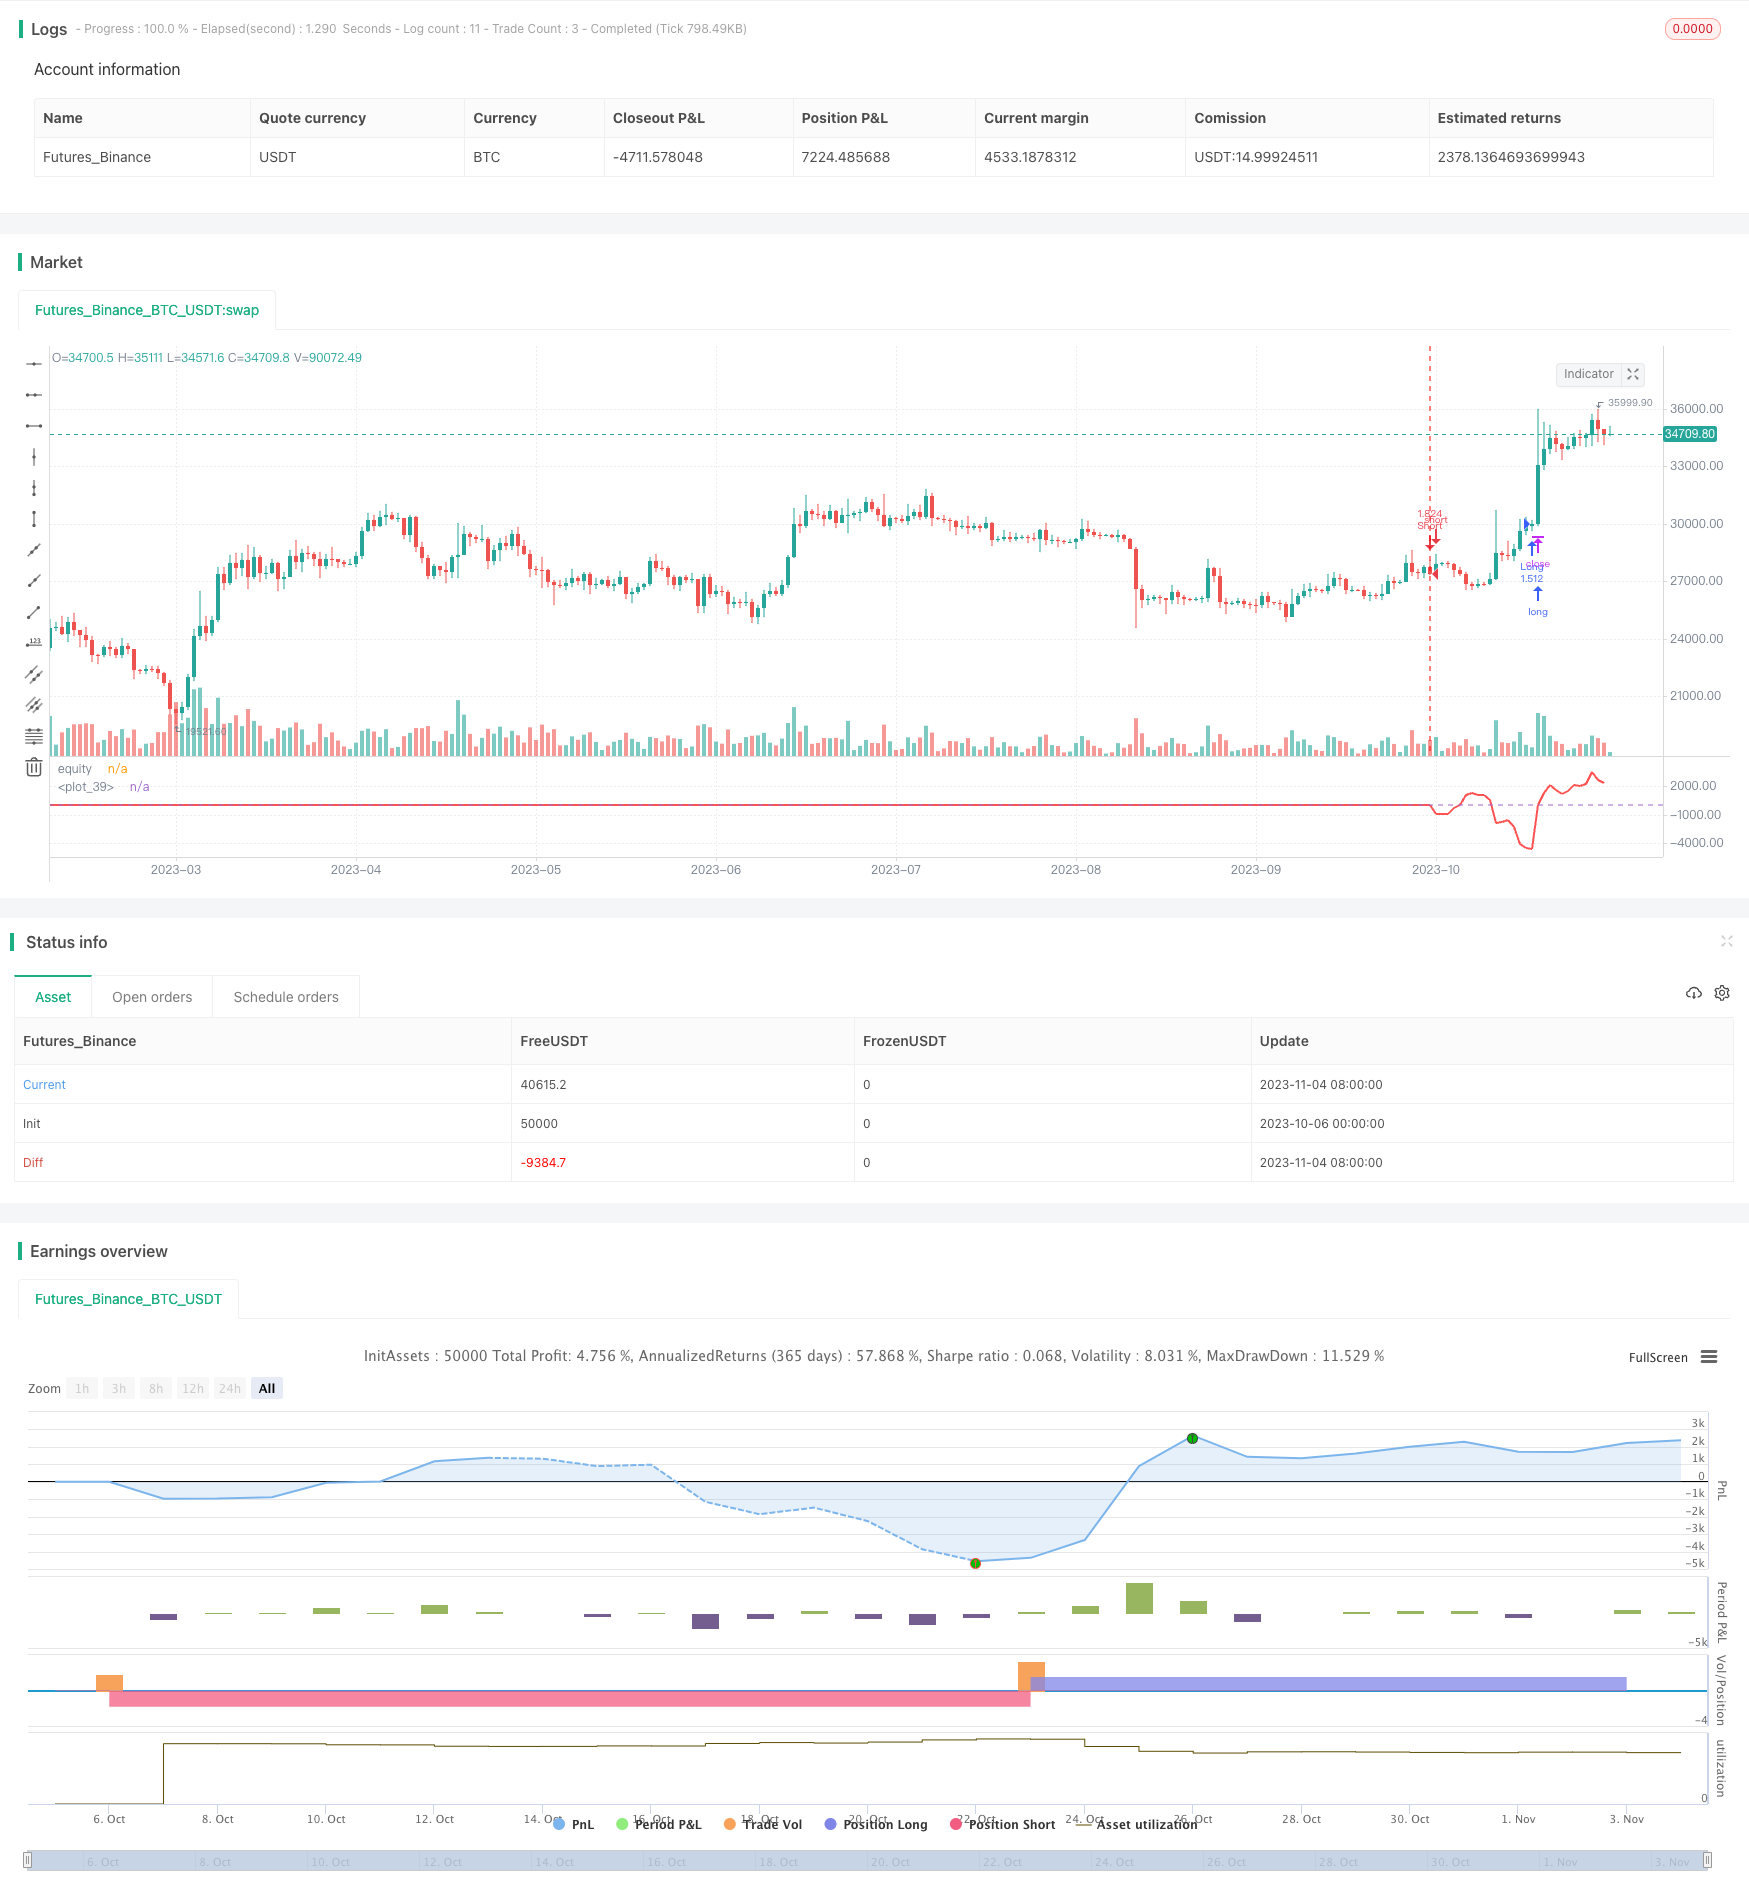
Overview
This strategy generates trading signals by calculating the sum of differences between ROC and SMA. It belongs to short-term trading strategies.
Strategy Logic
The strategy first calculates SMA with length l and ROC. Then it calculates the difference k between close price and SMA. Next it sums up k for s days and gets sum. When sum>0, it goes long. When sum<0, it goes short.
Specifically, in the code:
Calculate SMA with length l, get a.
Calculate ROC with length l, get r.
Calculate difference between close price and SMA: k = close - a.
Sum up k for s days, get sum.
If sum>0, long position; if sum<0, short position.
Exit when sum<0 for long, and sum>0 for short.
The key is to sum up the difference k and use the sign of sum for trading signals. When k>0 for recent days, price is increasing, so go long. When k<0, price is decreasing, so go short.
Advantage Analysis
This simple short-term trading strategy has the following advantages:
The indicators used are simple and easy to understand.
Filtering by the difference of indicators can find more accurate trading opportunities.
Summing up the difference can better capture short-term trends.
The parameters l and s can be adjusted for different cycle.
The logic is clear and easy to modify and optimize.
High capital utilization efficiency for frequent short-term trading.
Risk Analysis
There are also some risks:
Higher risks in short-term trading, losses are possible.
Improper parameters may lead to over-trading or missing opportunities.
Hard to adapt to trend reversal, no stop loss may lead to big losses.
Frequent adjustment of parameters relies heavily on trader's experience.
High trading frequency may increase transaction costs and slippage.
Solutions:
Adjust parameters properly to lower trading frequency.
Add trend indicators to identify reversals.
Optimize stop loss to control single trade loss.
Add auto parameter optimization to lower dependence on experience.
Optimize order execution model to lower transaction costs.
Optimization Directions
The strategy can be further optimized in the following aspects:
Optimize parameter calculation methods, like genetic algorithms, to make parameters adaptive.
Add more indicators and filters to improve signal quality.
Improve stop loss strategy, like trailing stop loss.
Optimize money management strategies like risk point control.
Optimize order execution model with trend following, slippage control etc.
Add backtesting and auto optimization modules.
Add quantitative evaluation of signal quality.
With these optimizations, this strategy can become a more comprehensive, intelligent, stable and controllable short-term trading system.
Summary
In summary, this strategy generates simple signals from indicators, with clear logic and easy implementation. With further optimizations in parameters, stop loss, money management etc., it can become a worthwhile quantitative trading strategy. But no strategy is perfect. Traders still need to apply it rationally based on personal risk preference.
Parameters
| Name | Default | What it controls |
|---|---|---|
| v_input_1 | 170 | Length for indicator |
| v_input_2 | 18 | Length of summation |
| v_input_3 | false | Take Profit |
| v_input_4 | false | Stop Loss |
| v_input_5 | false | Trailing Stop Loss |
| v_input_6 | false | Trailing Stop Loss Offset |
Source Pine Script
/*backtest
start: 2023-10-06 00:00:00
end: 2023-11-05 00:00:00
period: 1d
basePeriod: 1h
exchanges: [{"eid":"Futures_Binance","currency":"BTC_USDT"}]
*/

//@version=2
strategy("Indicator Integrator Strat",default_qty_type = strategy.percent_of_equity, default_qty_value = 100,currency="USD",initial_capital=662, overlay=false)

l = input(defval=170,title="Length for indicator")
s = input(title="Length of summation",defval=18)
a= sma(close,l)
r=roc(close,l)
k=close-a
sum = 0
for i = 0 to s
    sum := sum + k[i]
//plot(a,color=yellow,linewidth=2,transp=0)
//bc =  iff( sum > 0, white, teal)
//plot(sum,color=bc, transp=20, linewidth=3,style=columns)
//plot(sma(sum,3),color=white)
//hline(0)

inpTakeProfit = input(defval = 0, title = "Take Profit", minval = 0)
inpStopLoss = input(defval = 0, title = "Stop Loss", minval = 0)
inpTrailStop = input(defval = 0, title = "Trailing Stop Loss", minval = 0)
inpTrailOffset = input(defval = 0, title = "Trailing Stop Loss Offset", minval = 0)
useTakeProfit = inpTakeProfit >= 1 ? inpTakeProfit : na
useStopLoss = inpStopLoss >= 1 ? inpStopLoss : na
useTrailStop = inpTrailStop >= 1 ? inpTrailStop : na
useTrailOffset = inpTrailOffset >= 1 ? inpTrailOffset : na

////buyEntry = crossover(source, lower)
////sellEntry = crossunder(source, upper)
if sum>0
    strategy.entry("Long", strategy.long, oca_name="Long",  comment="Long")
else
    strategy.cancel(id="Long")
if sum<0
    strategy.entry("Short", strategy.short, oca_name="Short", comment="Short")
else
    strategy.cancel(id="Short")
strategy.initial_capital = 50000
plot(strategy.equity-strategy.initial_capital-strategy.closedtrades*.25/2, title="equity", color=red, linewidth=2)
hline(0)
//longCondition = sum>0
//exitlong = sum<0

//shortCondition = sum<0
//exitshort = sum>0

//strategy.entry(id = "Long", long=true, when = longCondition)
//strategy.close(id = "Long", when = exitlong)
//strategy.exit("Exit Long", from_entry = "Long", profit = useTakeProfit, loss = useStopLoss, trail_points = useTrailStop, trail_offset = useTrailOffset, when=exitlong)

//strategy.entry(id = "Short", long=false, when = shortCondition)
//strategy.close(id = "Short", when = exitshort)
//strategy.exit("Exit Short", from_entry = "Short", profit = useTakeProfit, loss = useStopLoss, trail_points = useTrailStop, trail_offset = useTrailOffset, when=exitshort)
Published by ChaoZhang on the FMZ strategy square · last modified 2023-11-06. Collected in the Quant Trading Vault. Unvalidated research: re-test with your own data and costs before trusting it.
Build this with AgenKit
A spec is not a trading system. Paste this into your coding agent and AgenKit runs a specialist team — architecture, test-first build, risk gates, review — with paper trading on by default.
/agenkit build a production-grade trading bot with a backtest engine, risk controls and paper trading by default from strategies/Momentum-Integral-Indicator-Strategy.md- npx agenkit install engineering-kit in your project
- Paste the command into your agent and approve each phase
- Get tests, backtest, risk controls and a paper-trading switch
Understand it first
Before you run this, read the lesson behind the idea and how to backtest it honestly. Specs like this one are the survivors of an unknown number of trials; deflate their results accordingly.
Related specs
- ADX Momentum Trend StrategyPine Script · Momentum · 10m
- Adaptive Trend Following Strategy Based on Momentum OscillatorPine Script · Momentum · 1d
- Bollinger Bands Momentum Trend Following Quantitative StrategyPine Script · Momentum · 1d
- Confirmed SMA Crossover Momentum StrategyPine Script · Momentum · 1d
- Cross Momentum Trend Following Strategy SMA RSI Cross Momentum SystemPine Script · Momentum · 1h
- Dual Moving Average Momentum Trading Strategy Time Optimized Trend Following SystemPine Script · Momentum · 2m