Momentum Moving Average Crossover Quant Strategy
This strategy combines the moving average and trading volume indicators to design the long and short entry and exit rules, forming a complete quantitative trading strategy.
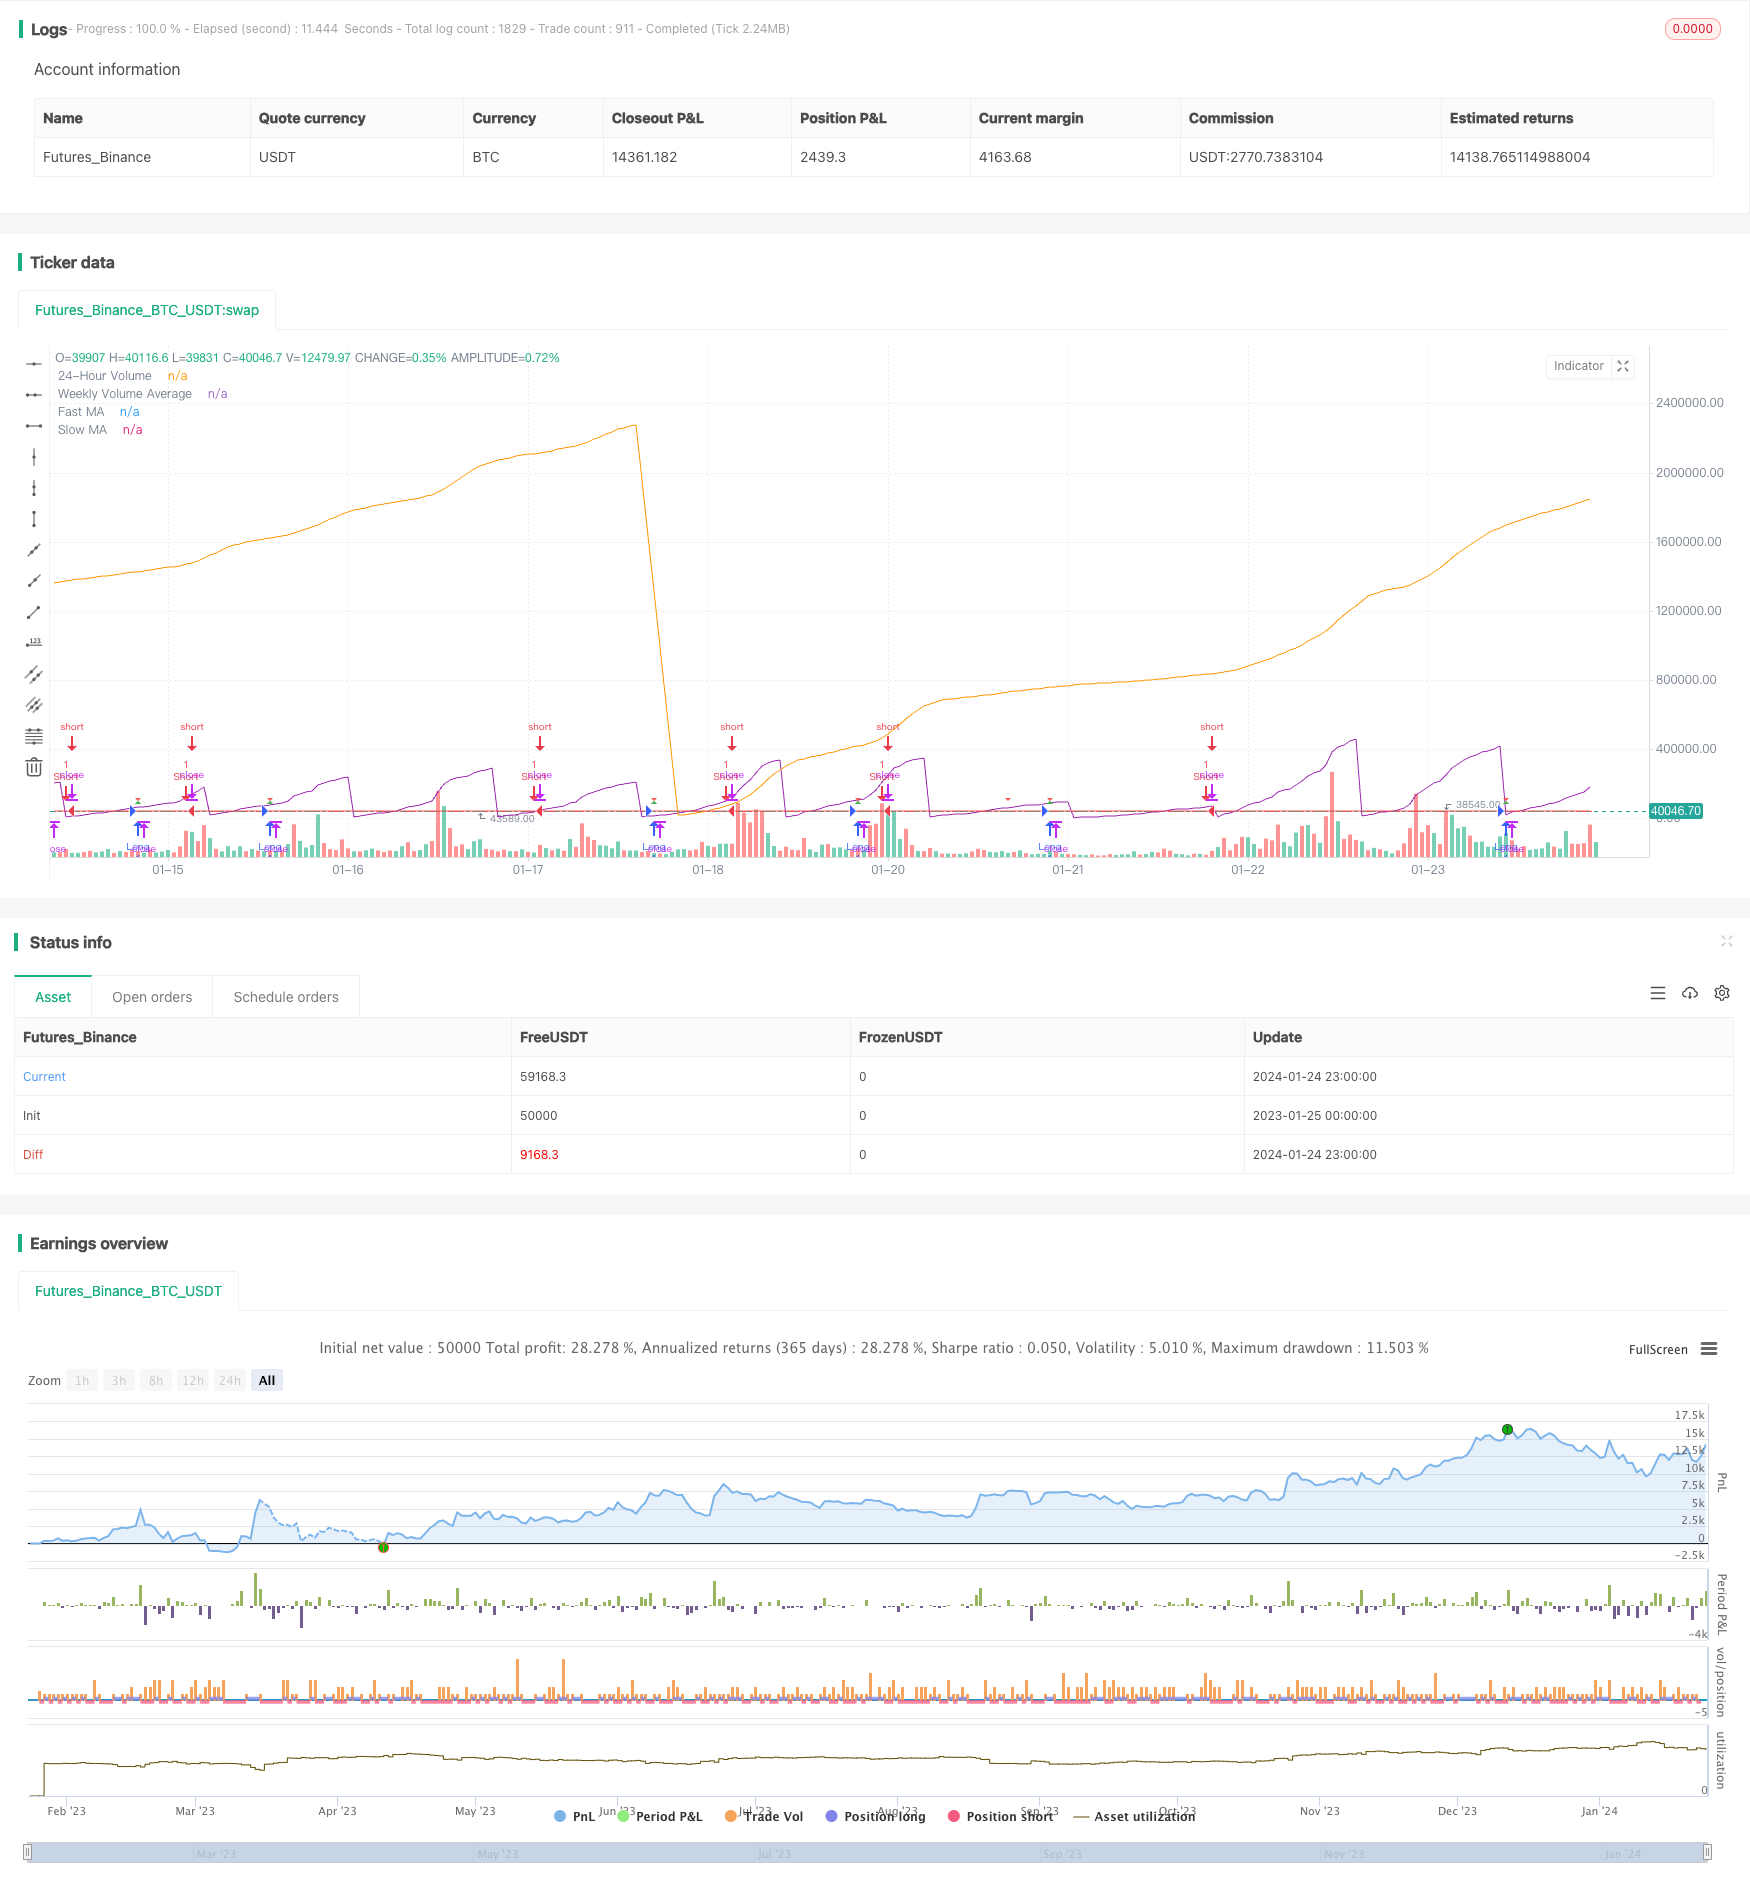
Overview
This strategy combines the moving average and trading volume indicators to design the long and short entry and exit rules, forming a complete quantitative trading strategy.
Strategy Principle
Key Indicators
- Moving Averages: Fast MA (Blue Line) and Slow MA (Red Line)
- Volume: 24-hour Volume (Purple) and 7-day Average Volume (Orange)
Strategy Conditions
Long Entry Conditions:
- Fast MA crosses above Slow MA
- 24-hour Volume below 50% of 7-day Average Volume
Short Entry Conditions:
Fast MA crosses below Slow MA
Entries and Exits
Long Entry: Go long when long conditions are met
Short Entry: Go short when short conditions are met
Take Profit and Stop Loss: Displayed take profit and stop loss levels for long position
Advantage Analysis
- Combining price and volume avoid false breakout
- Clear entry and exit rules
- Take profit and stop loss to control risk
Risk Analysis
- Frequent trading with moving average strategy
- Unreliable volume data quality
- Overoptimization in parameter tuning
Improvements:
- Adjust MA parameters to reduce trading frequency
- Verify signals with more data sources
- Strict backtesting to prevent overoptimization
Optimization Directions
- Add other indicators to filter signals
- Dynamic take profit and stop loss
- Multiple timeframe analysis to improve stability
Summary
This strategy integrates MA and volume indicators to design a complete quant strategy with clear entry conditions, take profit/stop loss, easy to operate. Need to prevent frequent trading issue, monitor volume data quality and overoptimization. NEXT steps are multivariate optimization, dynamic TP/SL and multiple timeframe analysis.
Parameters
| Name | Default | What it controls |
|---|---|---|
| v_input_1 | 9 | Fast MA Length |
| v_input_2 | 21 | Slow MA Length |
| v_input_3 | 50 | Volume Percentage Threshold |
Source Pine Script
/*backtest
start: 2023-01-25 00:00:00
end: 2024-01-25 00:00:00
period: 1h
basePeriod: 15m
exchanges: [{"eid":"Futures_Binance","currency":"BTC_USDT"}]
*/

//@version=5
strategy("MA and Volume Strategy", overlay=true)

// Input parameters
fastLength = input(9, title="Fast MA Length")
slowLength = input(21, title="Slow MA Length")
volumePercentageThreshold = input(50, title="Volume Percentage Threshold")

// Calculate moving averages
fastMA = ta.sma(close, fastLength)
slowMA = ta.sma(close, slowLength)

// Calculate 24-hour volume and weekly volume average
dailyVolume = request.security(syminfo.tickerid, "D", volume)
weeklyVolumeAvg = ta.sma(request.security(syminfo.tickerid, "W", volume), 7)

// Strategy conditions
longCondition = ta.crossover(fastMA, slowMA) and dailyVolume < (weeklyVolumeAvg * volumePercentageThreshold / 100)
shortCondition = ta.crossunder(fastMA, slowMA)

// Set take profit and stop loss levels
takeProfitLong = close * 1.50
stopLossLong = close * 0.90

// Strategy orders
strategy.entry("Long", strategy.long, when=longCondition)
strategy.entry("Short", strategy.short, when=shortCondition)

// Plot moving averages
plot(fastMA, color=color.blue, title="Fast MA")
plot(slowMA, color=color.red, title="Slow MA")

// Plot 24-hour volume and weekly volume average
plot(dailyVolume, color=color.purple, title="24-Hour Volume", transp=0)
plot(weeklyVolumeAvg, color=color.orange, title="Weekly Volume Average")

// Plot entry signals
plotshape(series=longCondition, title="Buy Signal", color=color.green, style=shape.triangleup, size=size.small)
plotshape(series=shortCondition, title="Sell Signal", color=color.red, style=shape.triangledown, size=size.small)

// Plot take profit and stop loss levels only when a valid trade is active
plotshape(series=longCondition, title="Take Profit Long", color=color.green, style=shape.triangleup, size=size.small)
plotshape(series=longCondition, title="Stop Loss Long", color=color.red, style=shape.triangledown, size=size.small)
Published by ChaoZhang on the FMZ strategy square · last modified 2024-01-26. Collected in the Quant Trading Vault. Unvalidated research: re-test with your own data and costs before trusting it.
Build this with AgenKit
A spec is not a trading system. Paste this into your coding agent and AgenKit runs a specialist team — architecture, test-first build, risk gates, review — with paper trading on by default.
/agenkit build a production-grade trading bot with a backtest engine, risk controls and paper trading by default from strategies/Momentum-Moving-Average-Crossover-Quant-Strategy.md- npx agenkit install engineering-kit in your project
- Paste the command into your agent and approve each phase
- Get tests, backtest, risk controls and a paper-trading switch
Understand it first
Before you run this, read the lesson behind the idea and how to backtest it honestly. Specs like this one are the survivors of an unknown number of trials; deflate their results accordingly.
Related specs
- ADX Momentum Trend StrategyPine Script · Momentum · 10m
- Adaptive Trend Following Strategy Based on Momentum OscillatorPine Script · Momentum · 1d
- Bollinger Bands Momentum Trend Following Quantitative StrategyPine Script · Momentum · 1d
- Confirmed SMA Crossover Momentum StrategyPine Script · Momentum · 1d
- Cross Momentum Trend Following Strategy SMA RSI Cross Momentum SystemPine Script · Momentum · 1h
- Dual Moving Average Momentum Trading Strategy Time Optimized Trend Following SystemPine Script · Momentum · 2m