Strategy vault / Machine learning
Moving Average and Stochastic RSI Strategy
This strategy was tested on the BTC/USDT trading pair on the 3-minute timeframe and gave wonderful results. It combines the use of moving averages and the Stochastic RSI indicator to identify trading signals.
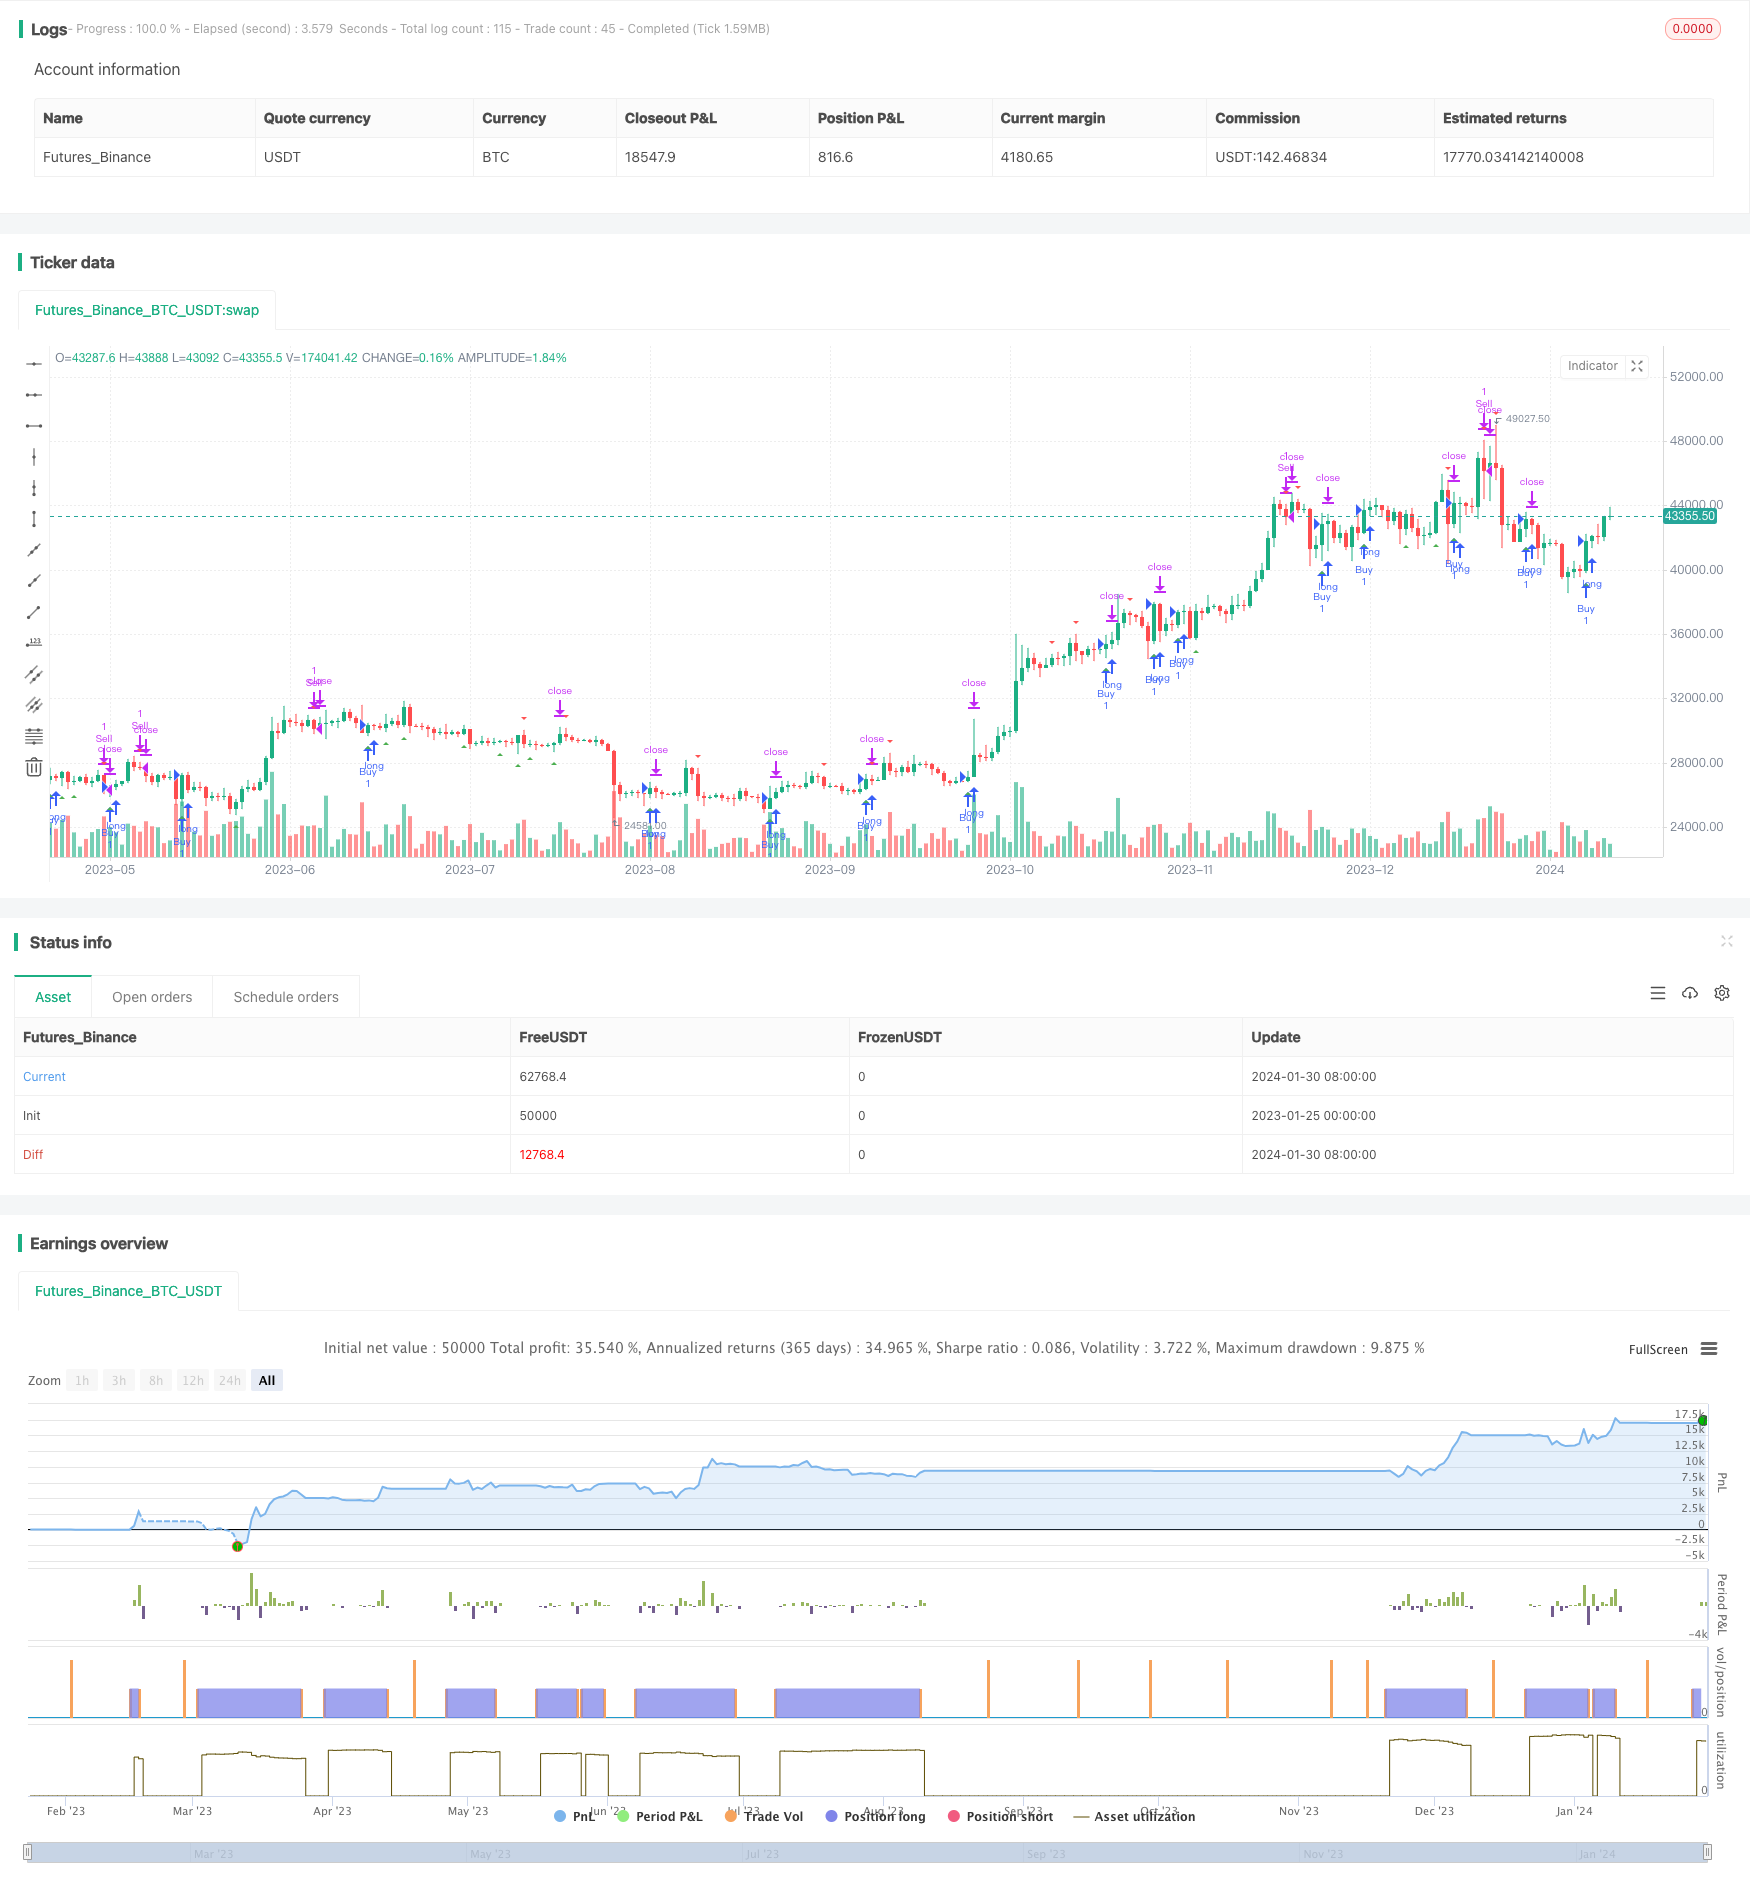
Overview
This strategy was tested on the BTC/USDT trading pair on the 3-minute timeframe and gave wonderful results. It combines the use of moving averages and the Stochastic RSI indicator to identify trading signals.
Strategy Principle
The strategy uses two simple moving averages with different time periods, 20 periods and 50 periods respectively. These two averages are used to judge the price trend. When the short-term moving average crosses above the long-term moving average, it is a bullish signal, and when it crosses below, it is a bearish signal.
The calculation formula of Stochastic RSI indicator is: (RSI - Lowest RSI) / (Highest RSI - Lowest RSI) * 100. This indicator reflects the current level of the RSI indicator relative to the highest and lowest RSI over a recent period of time. When Stochastic RSI crosses above 20, it is an oversold signal, and when it crosses below 80, it is an overbought signal.
This strategy combines the use of moving averages to judge the trend direction and Stochastic RSI to locate potential reversal points as entry opportunities.
Advantage Analysis
Compared with using moving averages or Stochastic RSI alone, this strategy combines the advantages of both to better identify trends while locating potential reversal points, thus improving the probability of profit.
Compared with a single indicator, this strategy integrates multiple indicators and sets strict entry rules, which can effectively filter out false signals and avoid unnecessary trading.
This strategy also controls risks very well by using only 2% of capital for margin trading each time, which can effectively limit the impact of a single loss.
Risk Analysis
This strategy mainly relies on technical indicators to determine trading signals. If the indicators fail, it may generate wrong signals and cause losses. In addition, improper parameter settings will also affect strategy performance.
In times of violent market fluctuations, stop-loss settings may be broken through, leading to the risk of expanding losses.
Optimization Directions
Test more moving average combinations and parameters to find the optimal parameter combination. Other potential indicators such as KD and RSI can also be combined with moving averages.
Choose the best stop-loss modes according to the characteristics of different cryptocurrencies to further control risks.
Introduce machine learning algorithms to automatically optimize parameter settings and signal judgment rules to make the strategy more robust and adaptive.
Conclusion
This strategy successfully combines moving averages and Stochastic RSI indicator to determine trading signals. Compared with a single technical indicator, this strategy can provide more reliable trading signals. With strict risk control and parameter optimization, this strategy has the potential to achieve stable profits.
Parameters
| Name | Default | What it controls |
|---|---|---|
| v_input_int_1 | 20 | MA1 Length |
| v_input_int_2 | 50 | MA2 Length |
| v_input_int_3 | 14 | Stochastic RSI Length |
| v_input_int_4 | 80 | Overbought Level |
| v_input_int_5 | 20 | Oversold Level |
| v_input_float_1 | 2 | Risk Percentage |
Source Pine Script
/*backtest
start: 2023-01-25 00:00:00
end: 2024-01-31 00:00:00
period: 1d
basePeriod: 1h
exchanges: [{"eid":"Futures_Binance","currency":"BTC_USDT"}]
*/

//@version=5
strategy("Moving Average and Stochastic RSI Strategy", shorttitle="MA+Stoch RSI", overlay=true)

// Input variables
ma1_length = input.int(20, title="MA1 Length")
ma2_length = input.int(50, title="MA2 Length")
stoch_length = input.int(14, title="Stochastic RSI Length")
overbought = input.int(80, title="Overbought Level")
oversold = input.int(20, title="Oversold Level")
risk_percentage = input.float(2.0, title="Risk Percentage")

// Calculate moving averages
ma1 = ta.sma(close, ma1_length)
ma2 = ta.sma(close, ma2_length)

// Calculate Stochastic RSI
rsi1 = ta.rsi(close, stoch_length)
rsiH = ta.highest(rsi1, stoch_length)
rsiL = ta.lowest(rsi1, stoch_length)
stoch = (rsi1 - rsiL) / (rsiH - rsiL) * 100

// Determine buy and sell signals based on Stochastic RSI
buySignal = ta.crossover(stoch, oversold)
sellSignal = ta.crossunder(stoch, overbought)

// Plot signals on the chart
plotshape(buySignal, style=shape.triangleup, location=location.belowbar, color=color.green, size=size.small)
plotshape(sellSignal, style=shape.triangledown, location=location.abovebar, color=color.red, size=size.small)

// Calculate position size based on equity and risk percentage
equity = strategy.equity
riskAmount = equity * risk_percentage / 100
positionSize = riskAmount / ta.atr(14)

// Entry and exit conditions
var float stopLoss = na
var float takeProfit = na

if buySignal
    stopLoss := low
    takeProfit := high
    strategy.entry("Buy", strategy.long)
else if sellSignal
    strategy.exit("Sell", from_entry="Buy", stop=stopLoss, limit=takeProfit)
Published by ChaoZhang on the FMZ strategy square · last modified 2024-02-01. Collected in the Quant Trading Vault. Unvalidated research: re-test with your own data and costs before trusting it.
Build this with AgenKit
A spec is not a trading system. Paste this into your coding agent and AgenKit runs a specialist team — architecture, test-first build, risk gates, review — with paper trading on by default.
/agenkit build a production-grade trading bot with a backtest engine, risk controls and paper trading by default from strategies/Moving-Average-and-Stochastic-RSI-Strategy.md- npx agenkit install engineering-kit in your project
- Paste the command into your agent and approve each phase
- Get tests, backtest, risk controls and a paper-trading switch
Understand it first
Before you run this, read the lesson behind the idea and how to backtest it honestly. Specs like this one are the survivors of an unknown number of trials; deflate their results accordingly.
Related specs
- High Frequency Hybrid Technical Analysis Quantitative StrategyPine Script · Machine learning · 15m
- Dual Indicator Stochastic RSI and EMA Trading StrategyPine Script · Machine learning · 1d
- ADX EFI 50 Moving Average Channel Pullback StrategyPine Script · Machine learning · 1h
- Multi indicator Combination StrategyPine Script · Machine learning · 1d
- AI Driven Dynamic Volatility Adaptive Trend Breakout Trading StrategyPine Script · Machine learning · 2d
- AI Powered Volatility Price System Divergence Trading StrategyPine Script · Machine learning · 1h