Strategy vault / Trend following
Moving Average Trend Following Trading Strategy
This strategy calculates the moving average and price change rate to determine whether the current state is in an uptrend or a downtrend combined with K-lines over a certain period, and accordingly goes long or short.
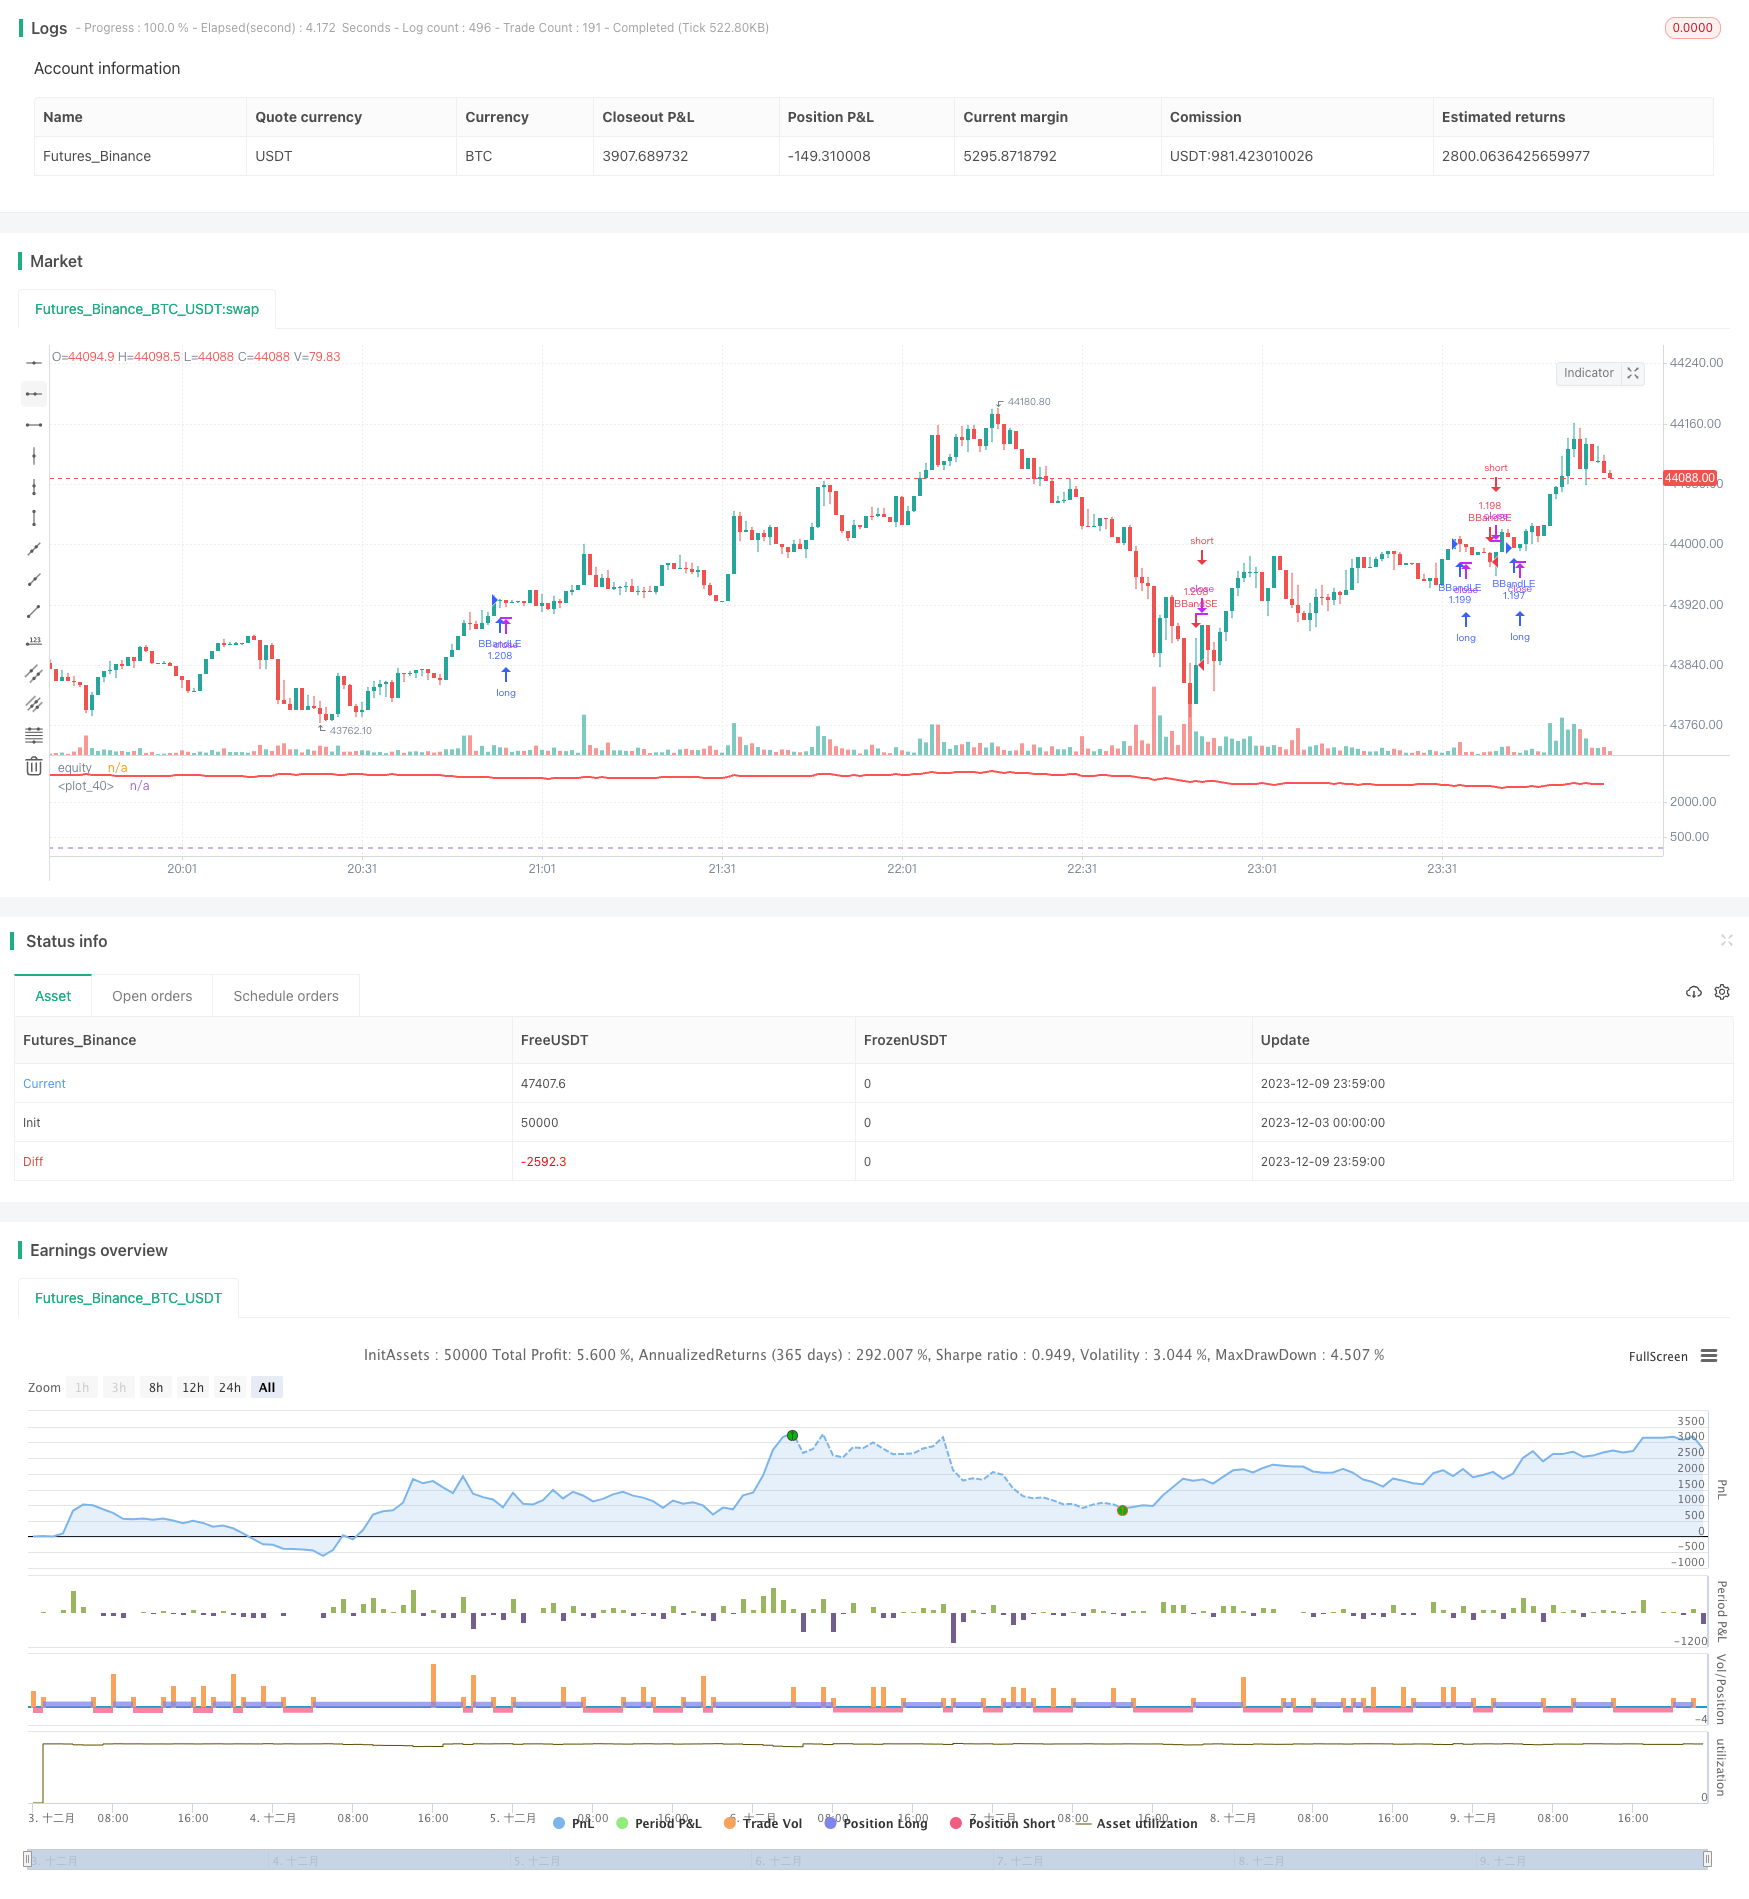
Overview
This strategy calculates the moving average and price change rate to determine whether the current state is in an uptrend or a downtrend combined with K-lines over a certain period, and accordingly goes long or short.
Strategy Principle
This strategy first calculates the simple moving average a of length l and the price change rate r of length l. Then it calculates the difference k between the current K-line price and the moving average. Finally, it calculates the sum sum of k over the past s K-lines.
When sum>0, it indicates a current uptrend and the strategy will go long. When sum<0, it indicates a current downtrend and the strategy will go short.
After going long or short, the position will be held until the trend reverses (sum changes from positive to negative or vice versa), then the position will be closed.
Advantage Analysis
The biggest advantage of this strategy is that it can catch the trend and is suitable for trend trading. Specifically, it has the following advantages:
Using the moving average to determine the overall trend direction can effectively filter market noise and lock in the major trend.
Applying the price change rate indicator to measure momentum strength avoids missing strong momentum.
Taking into account multiple K-lines over a period can more accurately determine the trend and avoid being misled by einzelne Ausreißer.
As long as the trend remains unchanged, continue holding the position to maximize profits from the trending market.
Risk Analysis
The main risks of this strategy are:
Unable to accurately determine the end time of the trend, may stop loss prematurely or miss some profits.
Unable to effectively control the size of single loss, losses may be large in extreme market conditions.
Improper strategy parameters may lead to over-frequent trading or missing some trading opportunities.
Long-term holdings may face overnight interest and margin risks.
To control risks, we can set stop loss points, trade only highly liquid products, optimize parameters and reasonably use leverage.
Optimization Directions
The main aspects to optimize this strategy include:
Test moving averages and price change rates of different lengths to find the best parameter combination.
Try other indicators such as MACD to better determine the trend and further improve accuracy.
Add position management mechanisms, such as taking profit after making some profits, to control single loss.
Incorporate volatility indicators to set dynamic stops to reduce risks in extreme market conditions.
Optimize entry and exit logic to filter false breakouts and improve trading efficiency.
Conclusion
The overall logic of this strategy is clear and easy to implement. By tracking trends for long-term holding trading, drawdown control is relatively reasonable. It is suitable for investors seeking stable returns. Further optimizing the stop loss and position management can expect good long-term steady returns.
Parameters
| Name | Default | What it controls |
|---|---|---|
| v_input_1 | 170 | Length for indicator |
| v_input_2 | 18 | Length of summation |
| v_input_3 | false | Take Profit |
| v_input_4 | false | Stop Loss |
| v_input_5 | false | Trailing Stop Loss |
| v_input_6 | false | Trailing Stop Loss Offset |
Source Pine Script
/*backtest
start: 2023-12-03 00:00:00
end: 2023-12-10 00:00:00
period: 1m
basePeriod: 1m
exchanges: [{"eid":"Futures_Binance","currency":"BTC_USDT"}]
*/

//@version=2
strategy("Indicator Integrator Strat",default_qty_type = strategy.percent_of_equity, default_qty_value = 100,currency="USD",initial_capital=662, overlay=false)

l = input(defval=170,title="Length for indicator")
s = input(title="Length of summation",defval=18)
a= sma(close,l)
r=roc(close,l)
k=close-a
sum = 0
for i = 0 to s
    sum := sum + k[i]
//plot(a,color=yellow,linewidth=2,transp=0)
//bc =  iff( sum > 0, white, teal)
//plot(sum,color=bc, transp=20, linewidth=3,style=columns)
//plot(sma(sum,3),color=white)
//hline(0)

inpTakeProfit = input(defval = 0, title = "Take Profit", minval = 0)
inpStopLoss = input(defval = 0, title = "Stop Loss", minval = 0)
inpTrailStop = input(defval = 0, title = "Trailing Stop Loss", minval = 0)
inpTrailOffset = input(defval = 0, title = "Trailing Stop Loss Offset", minval = 0)
useTakeProfit = inpTakeProfit >= 1 ? inpTakeProfit : na
useStopLoss = inpStopLoss >= 1 ? inpStopLoss : na
useTrailStop = inpTrailStop >= 1 ? inpTrailStop : na
useTrailOffset = inpTrailOffset >= 1 ? inpTrailOffset : na

////buyEntry = crossover(source, lower)
////sellEntry = crossunder(source, upper)
if sum>0
    strategy.entry("BBandLE", strategy.long, oca_name="BollingerBands",  comment="BBandLE")
else
    strategy.cancel(id="BBandLE")
if sum<0
    strategy.entry("BBandSE", strategy.short, oca_name="BollingerBands",  comment="BBandSE")
else
    strategy.cancel(id="BBandSE")

strategy.initial_capital = 50000
plot(strategy.equity-strategy.initial_capital-strategy.closedtrades*.25/2, title="equity", color=red, linewidth=2)
hline(0)
//longCondition = sum>0
//exitlong = sum<0

//shortCondition = sum<0
//exitshort = sum>0

//strategy.entry(id = "Long", long=true, when = longCondition)
//strategy.close(id = "Long", when = exitlong)
//strategy.exit("Exit Long", from_entry = "Long", profit = useTakeProfit, loss = useStopLoss, trail_points = useTrailStop, trail_offset = useTrailOffset, when=exitlong)

//strategy.entry(id = "Short", long=false, when = shortCondition)
//strategy.close(id = "Short", when = exitshort)
//strategy.exit("Exit Short", from_entry = "Short", profit = useTakeProfit, loss = useStopLoss, trail_points = useTrailStop, trail_offset = useTrailOffset, when=exitshort)Published by ChaoZhang on the FMZ strategy square · last modified 2023-12-11. Collected in the Quant Trading Vault. Unvalidated research: re-test with your own data and costs before trusting it.
Build this with AgenKit
A spec is not a trading system. Paste this into your coding agent and AgenKit runs a specialist team — architecture, test-first build, risk gates, review — with paper trading on by default.
/agenkit build a production-grade trading bot with a backtest engine, risk controls and paper trading by default from strategies/Moving-Average-Trend-Following-Trading-Strategy.md- npx agenkit install engineering-kit in your project
- Paste the command into your agent and approve each phase
- Get tests, backtest, risk controls and a paper-trading switch
Understand it first
Before you run this, read the lesson behind the idea and how to backtest it honestly. Specs like this one are the survivors of an unknown number of trials; deflate their results accordingly.
Related specs
- Bollinger Bands and RSI Trend Following StrategyPine Script · Trend following · 1h
- EMA and RSI Trend Trading StrategyPine Script · Trend following · 1d
- Multi Indicator Trend Following Strategy with Dynamic Risk ManagementPine Script · Trend following · 2h
- Relative Volume Trend Following Trading StrategyPine Script · Trend following · 1d
- Trend Following Strategy Based on EMA and SMA CrossoverPine Script · Trend following · 1h
- Dual Rail Trend Tracking StrategyPine Script · Trend following · 3h