Strategy vault / Trend following
Multi factor Moving Average Trend Following Strategy
This is a simple moving average trend following strategy suitable for Bitcoin and Ethereum. It combines multiple indicators such as moving averages, MACD and RSI to identify trend direction, and adopts fixed position…
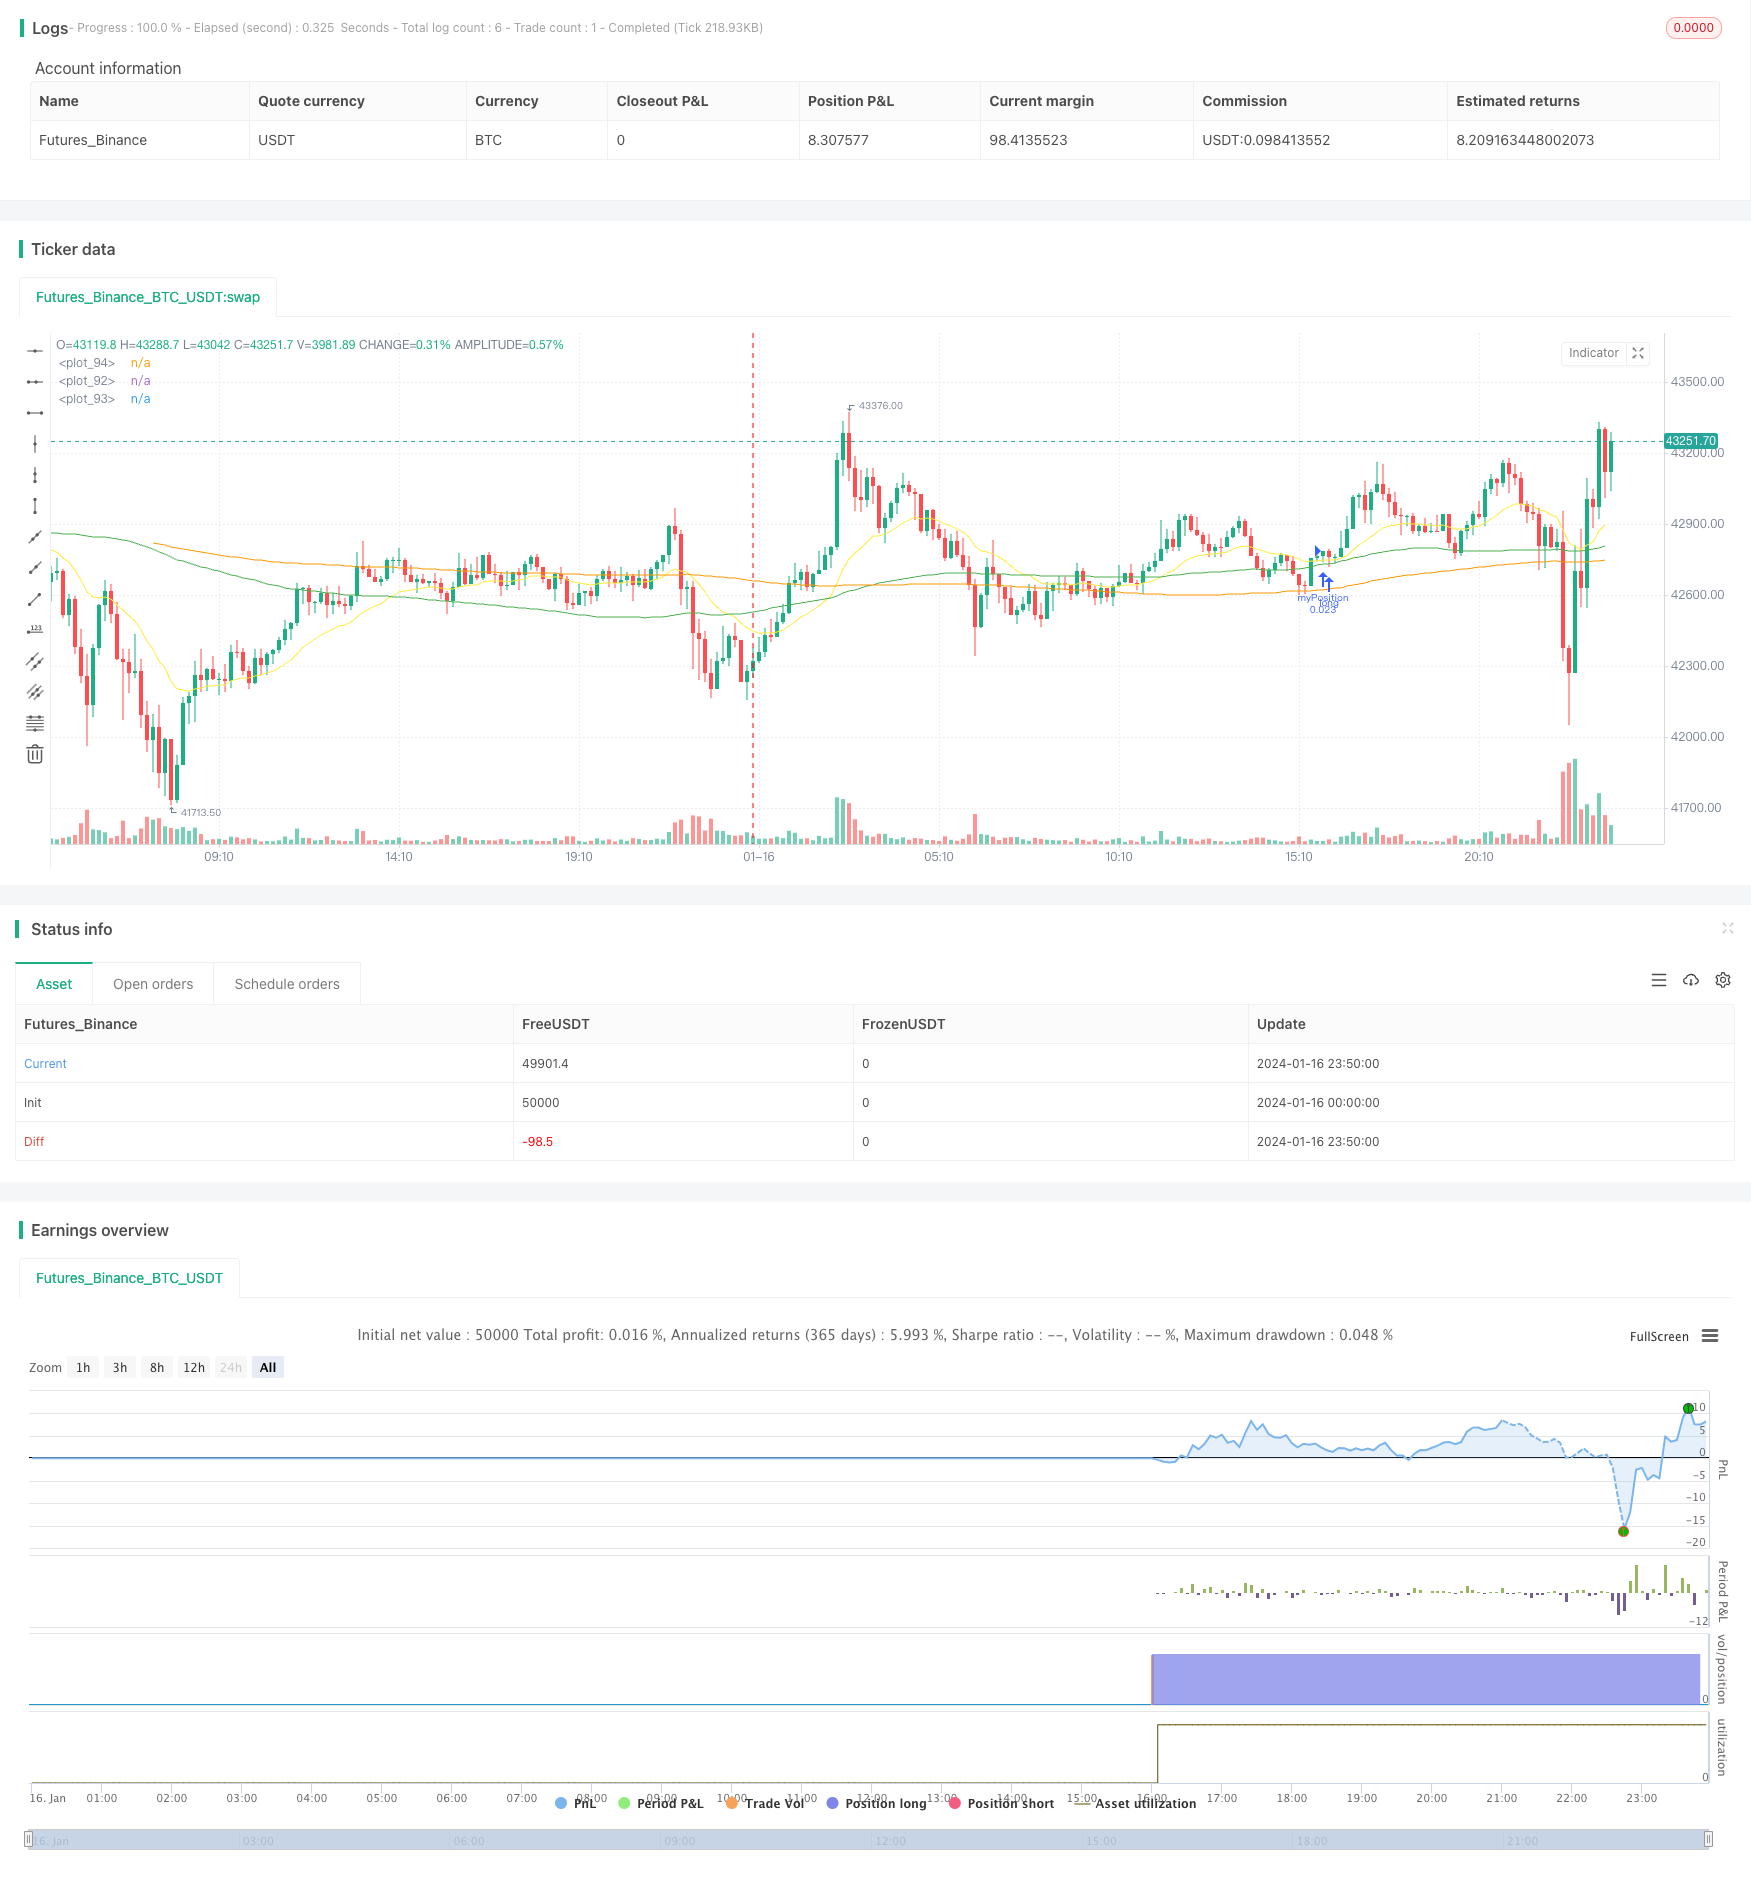
Overview
This is a simple moving average trend following strategy suitable for Bitcoin and Ethereum. It combines multiple indicators such as moving averages, MACD and RSI to identify trend direction, and adopts fixed position sizing for long-term trend tracking.
Strategy Logic
The core logic of the strategy is to go long when the 20-day EMA crosses above the 100-day SMA and the 100-day SMA crosses above the 200-day SMA; close positions when the 20-day EMA crosses below the 100-day SMA. That is, use three moving averages of different periods to determine the trend direction.
Specifically, the strategy calculates the values of 20-day EMA, 100-day SMA and 200-day SMA, and compares their magnitude relationship to judge the trend. When the 20-day EMA crosses above the 100-day SMA, it means that prices have started to rise. At this point, if the 100-day SMA is also greater than the 200-day SMA, it indicates that the medium and long term trends are also rising. This is a strong long signal.
After entering a long position, the strategy will continue to hold the position to follow the trend. When the 20-day EMA crosses below the 100-day SMA again, it indicates that a short-term trend reversal signal has occurred. At this point, the strategy will choose to close positions to stop losses.
In addition, the strategy also incorporates indicators such as MACD and RSI to confirm the trend. Only when the DIF line, DEMA line and HIST bar line of MACD are all rising, and the RSI indicator is above 50, will it choose to open long positions.
Advantages
The biggest advantage of this strategy is that it formulates clear trend trading rules that can effectively track medium and long term trends. The specific advantages are as follows:
Use multiple moving averages combined to judge the trend, which is relatively reliable.
Adopt long-term holding positions to track trend movements without being disturbed by short-term market fluctuations.
Combining indicators such as MACD and RSI for strategy signal confirmation can filter false breakouts.
Using the golden cross and death cross of EMA and SMA lines to determine entry and exit points, the rules are simple and clear.
Can effectively control risks by limiting losses through stop loss.
Risks and Solutions
There are also some risks to this strategy. The main problem is that it cannot stop losses in time when the trend reverses. Specific risks and solutions are as follows:
Unable to track trend reversal points in time: Shorten moving average cycles, or add more indicators for comprehensive judgment.
Long holding time can easily lead to greater losses: Properly shorten exit lines for timely stop loss.
Moving average indicators tend to lag: Add a certain percentage of stop loss lines for active stop loss.
Optimization Directions
This strategy can also be optimized in the following aspects:
Test more combinations of moving average cycles to find the optimal parameters.
Try other indicators or models to judge trends and entry timing. Such as Bollinger Bands, KD Indicator, etc.
Use machine learning and other methods to dynamically optimize parameters. For example, use reinforcement learning to adjust stop loss amplitude.
Incorporate trading volume indicators to avoid false breakouts. For example, On Balance Volume, transaction volume, etc.
Develop automatic stop loss and tracking stop loss systems that can adjust stop loss positions based on market conditions.
Conclusion
In summary, this strategy is a simple and straightforward trend following strategy. It uses moving averages to determine the trend direction, MACD and RSI to filter signals. Adopt relatively long holding periods to track trend movements. It can effectively capture medium and long term trend opportunities. At the same time, there is also the risk of lagging in identifying trend reversals. Future improvements and upgrades can be made through parameter optimization, adding indicators, etc.
Parameters
| Name | Default | What it controls |
|---|---|---|
| v_input_1 | 5 | StopLoss in % |
Source Pine Script
/*backtest
start: 2024-01-16 00:00:00
end: 2024-01-17 00:00:00
period: 10m
basePeriod: 1m
exchanges: [{"eid":"Futures_Binance","currency":"BTC_USDT"}]
*/

//@version=4
strategy(title="BTC_Long_Only_TV01_200507", overlay=true)

//////////// !!!!!!!!!!!!!!!! WORK BEST IN 2 HOURS for BTC, ETH and ETHXBT !!!!!!!!!!!!!!!!!!! /////////////////////
//280820 - After long esting this is the best script for ETHUSD in 4 hours. From 01/01/2020 til 28/08/2020


[macdLine, macdSignalLine, macdHist] = macd(close, 12, 26, 7)

//_rsi_len = input(14, title="RSI length")
_rsi_len = 14

NewValue = 0
PreviousValue = 0
leverage = 1

smaPercentageIncrease = 0.0
SMA_PERCENT_INCREASE = 0.0
float atrValue = 0
bool bPositionOpened = false
float stockPositionSize = 0
float volatilityPercentage = 0.0
bool bDisplayArrow = false
bool bEMAIsRising = false
bool bSMAIsRising = false
bool bSMASlowIsRising = false
bool bMACDIsRising = false
bool bMACDHistIsRising = false
bool bMACDSignalIsRising = false

float stopLoss = input (5, "StopLoss in %", type=input.float) //StopLoss associated with the order
//Best for alt versus BTC float stopLoss = input (3, "StopLoss in %", type=input.float) //StopLoss associated with the order
float positionSize = 1000
float currentPrice = close
float stopLossPrice = 0
float entryPrice = 0


//-----------------------------------------------------------


// === INPUT BACKTEST RANGE ONE YEAR
//FromDay   = input(defval = 01, title = "From Day", minval = 1, maxval = 31)
//FromMonth = input(defval = 01, title = "From Month", minval = 1, maxval = 12)
//FromYear  = input(defval = 2020, title = "From Year", minval = 2017)
FromDay   = 01
FromMonth = 01
FromYear  = 2020

//ToDay     = input(defval = 01, title = "To Day", minval = 1, maxval = 31)
//ToMonth   = input(defval = 01, title = "To Month", minval = 1, maxval = 12)
//ToYear    = input(defval = 2023, title = "To Year", minval = 2017)
ToDay     = 14
ToMonth   = 05
ToYear    = 2029

// === FUNCTION EXAMPLE ===
start     = timestamp(FromYear, FromMonth, FromDay, 00, 00)  // backtest start window
finish    = timestamp(ToYear, ToMonth, ToDay, 23, 59)        // backtest finish window
window()  => true // create function "within window of time"


//FUNCTION DEFINITIONS
//----------------------
IsRising(data, loopBack) =>
    bIsRising = true
    for n = 1 to loopBack
        if data[n] > data[n-1]
            bIsRising := false
        continue
    bIsRising

IsFalling(data, loopBack) =>
    bIsFalling = true
    for n = 1 to loopBack
        if data[n] < data[n-1]
            bIsFalling := false
        continue
    bIsFalling

// END OF FUNCTION DEFINITIONS //


emaLength = 20
smaLength = 100
smaSlowLength = 200

ema = ema(close, emaLength)
sma = sma(close, smaLength)
smaSlow = sma(close, smaSlowLength)

plot(sma, color=color.green)
plot(smaSlow, color=color.orange)
plot(ema, color=color.yellow)

//reload previous values
stopLossPrice := na(stopLossPrice[1]) ? 0.0 : stopLossPrice[1]
entryPrice := na(entryPrice[1]) ? 0.0 : entryPrice[1]
bPositionOpened := na(bPositionOpened[1]) ? false : bPositionOpened[1]
positionSize := na(positionSize[1]) ? 1000 : positionSize[1]
stockPositionSize := na(stockPositionSize[1]) ? 0 : stockPositionSize[1]
//leverage := na(leverage[1]) ? 1 : leverage[1]

bEMAIsRising := IsRising(ema, 2)
bSMAIsRising := IsRising(sma, 3)
bMACDIsRising := IsRising(macdLine, 3)
bMACDHistIsRising := IsRising(macdHist, 1)
bSMASlowIsRising := IsRising(smaSlow, 10)
bMACDSignalIsRising := IsRising(macdSignalLine, 3)


atrValue := atr(14)
volatilityPercentage := (atrValue/currentPrice)*100 //calcute the volatility. Percentage of the actual price


if (window())
    //Check if we can open a LONG
    if (bPositionOpened == false and bSMASlowIsRising == true and bMACDIsRising == true and bEMAIsRising == true and bSMAIsRising == true and ema[0] > sma[0] and sma[0] < currentPrice)
        //Enter in short position
        stockPositionSize := (positionSize*leverage)/currentPrice //Calculate the position size based on the actual price and the position Size (in $) configured.

        //calculate exit values
        stopLossPrice := currentPrice*(1-stopLoss/100)
        strategy.entry("myPosition", strategy.long, qty=stockPositionSize, comment="BUY at " + tostring(currentPrice))
        entryPrice := currentPrice //store the entry price
        bPositionOpened := true
        bDisplayArrow := true

    if (bPositionOpened == true and (currentPrice <= stopLossPrice or crossunder(ema[1], sma[1])))
        strategy.close("myPosition", comment="" + tostring(currentPrice) ) //Stop
        //uncomment the below line to make the bot investing the full portfolio amount to test compounding effect.
        //positionSize := positionSize + ((stockPositionSize * currentPrice) - (positionSize*leverage))
        //reset some flags
        bPositionOpened := false
        bDisplayArrow := true
        entryPrice := 0.0
Published by ChaoZhang on the FMZ strategy square · last modified 2024-01-18. Collected in the Quant Trading Vault. Unvalidated research: re-test with your own data and costs before trusting it.
Build this with AgenKit
A spec is not a trading system. Paste this into your coding agent and AgenKit runs a specialist team — architecture, test-first build, risk gates, review — with paper trading on by default.
/agenkit build a production-grade trading bot with a backtest engine, risk controls and paper trading by default from strategies/Multi-factor-Moving-Average-Trend-Following-Strategy.md- npx agenkit install engineering-kit in your project
- Paste the command into your agent and approve each phase
- Get tests, backtest, risk controls and a paper-trading switch
Understand it first
Before you run this, read the lesson behind the idea and how to backtest it honestly. Specs like this one are the survivors of an unknown number of trials; deflate their results accordingly.
Related specs
- Bollinger Bands and RSI Trend Following StrategyPine Script · Trend following · 1h
- Dual ATR Channel Trend Following StrategyPine Script · Trend following · 15m
- Dynamic Dual EMA Crossover Strategy with Adaptive Profit Loss ControlPine Script · Trend following · 1d
- EMA and RSI Trend Trading StrategyPine Script · Trend following · 1d
- Fixed Range Volume Profile And Anchored VWAP Trend Identification Strategy With Dynamic Stop LossPine Script · Trend following · 1h
- Multi Moving Average Trend Capture and Crossover Confirmation Trading SystemPine Script · Trend following · 1m