Strategy vault / Trend following
Multi Indicator Trend Following Strategy
The strategy named "Jancok Strategycs v3" is a multi-indicator trend following strategy based on Moving Averages (MA), Moving Average Convergence Divergence (MACD), Relative Strength Index (RSI), and Average True…
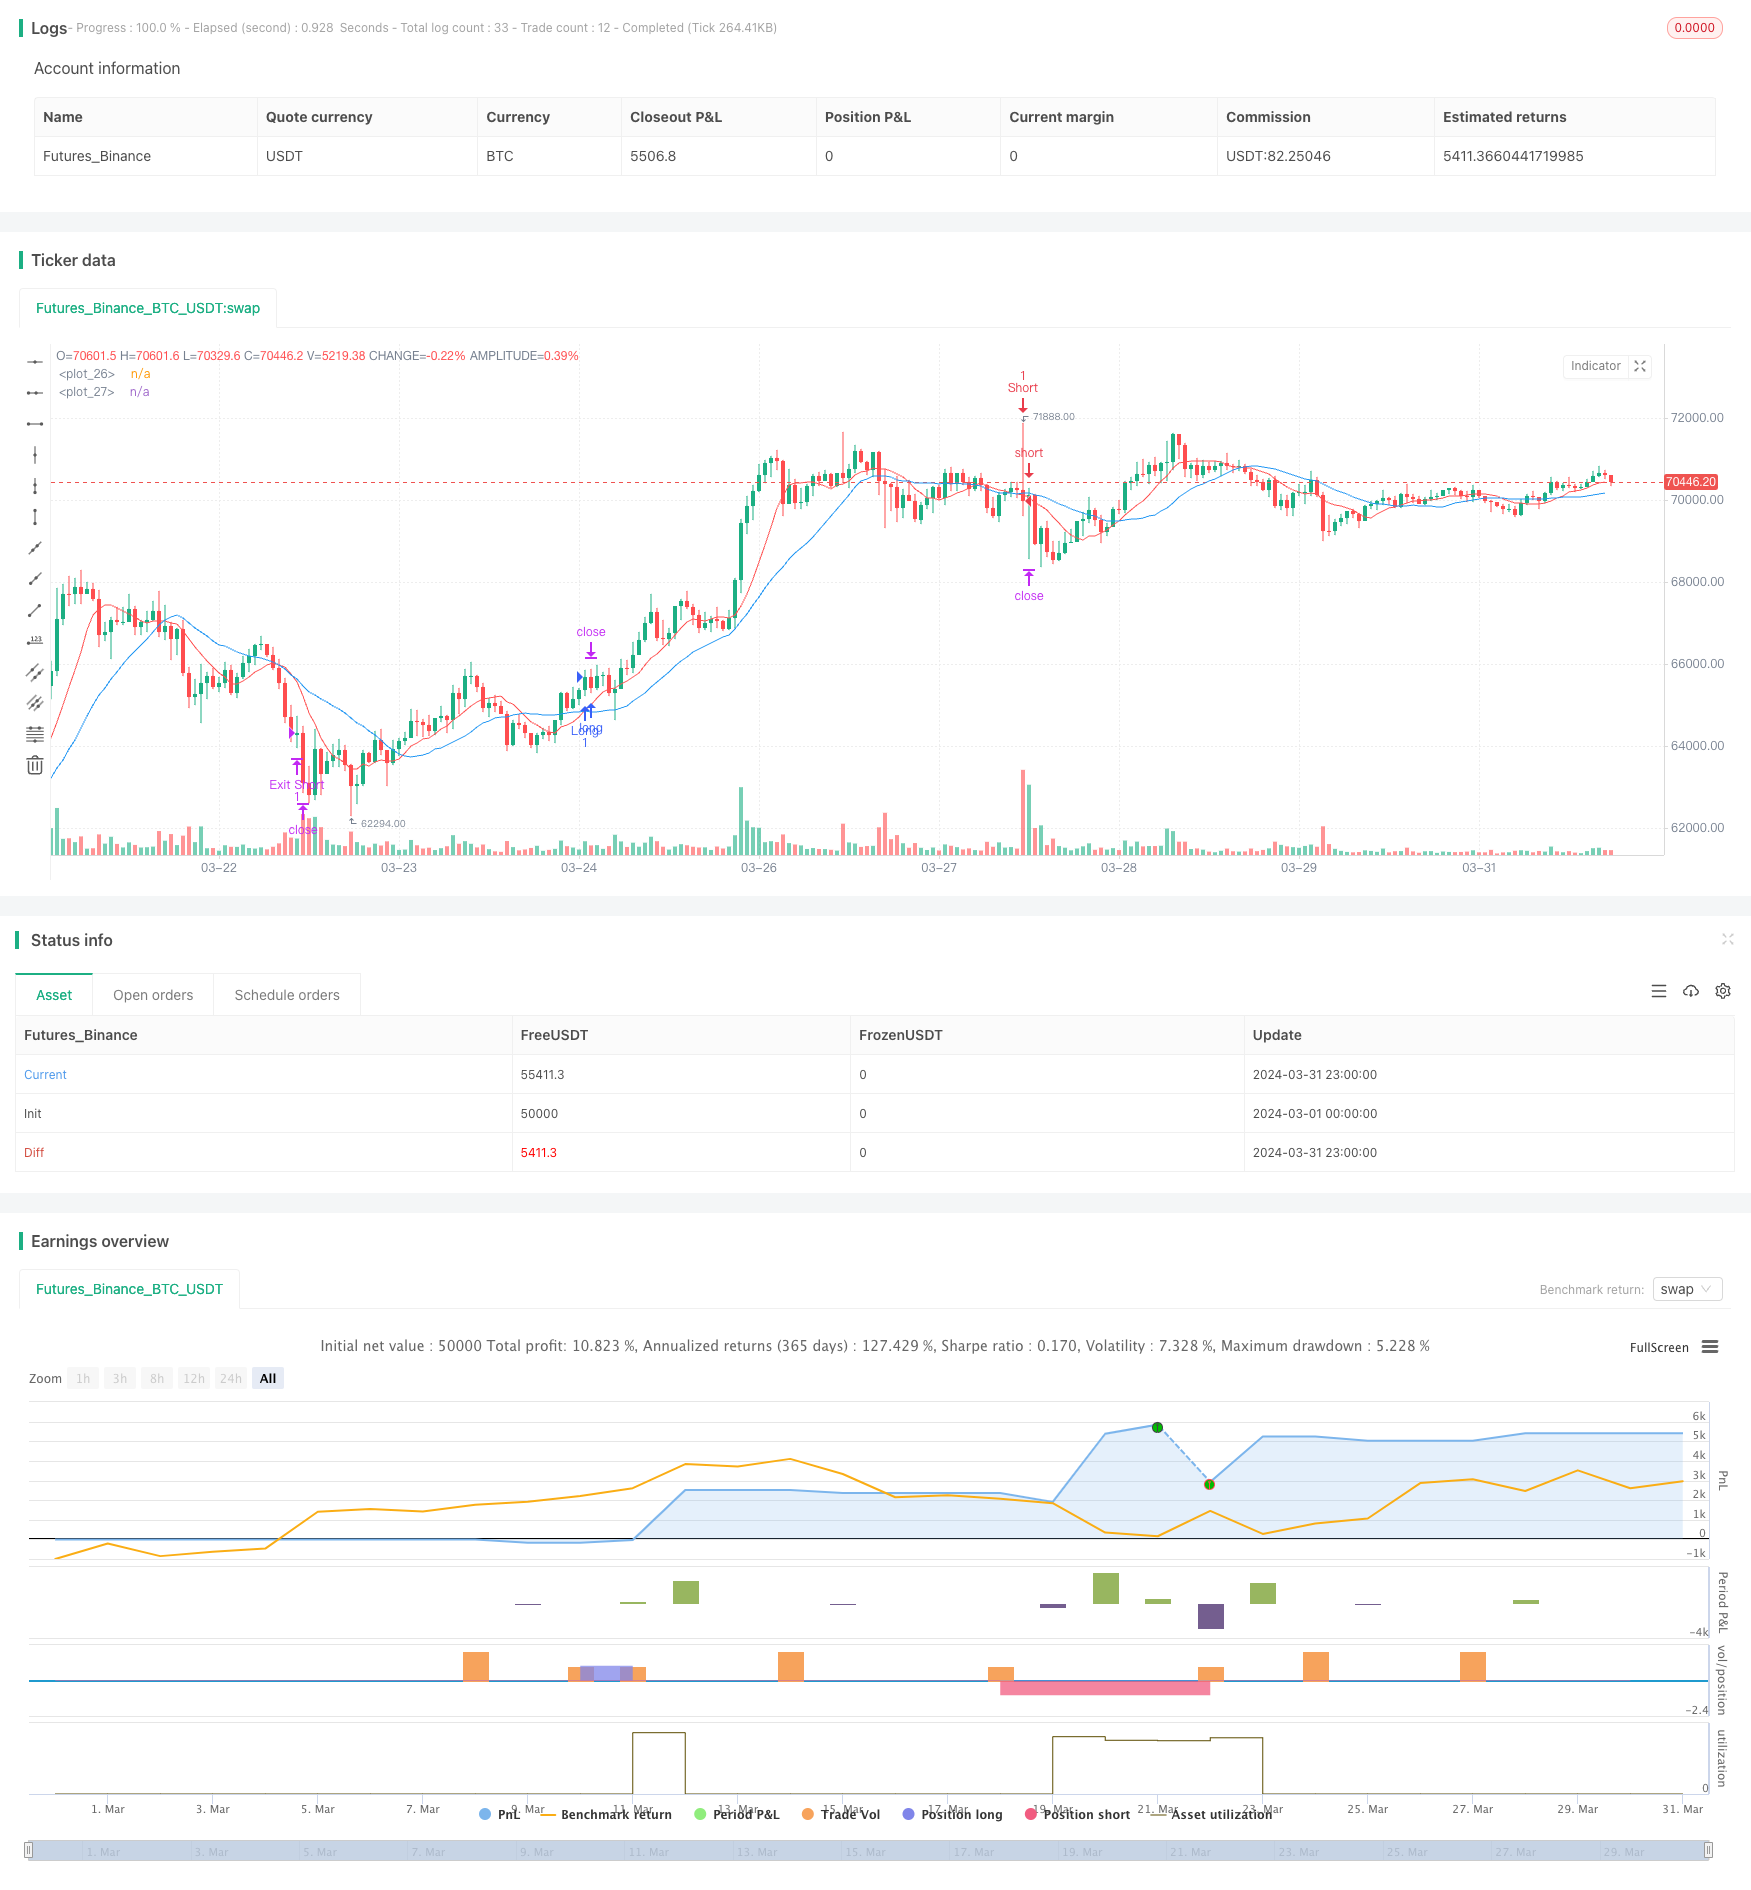
Overview
The strategy named "Jancok Strategycs v3" is a multi-indicator trend following strategy based on Moving Averages (MA), Moving Average Convergence Divergence (MACD), Relative Strength Index (RSI), and Average True Range (ATR). The main idea of this strategy is to use a combination of multiple indicators to determine market trends and trade in the direction of the trend. Additionally, the strategy employs dynamic stop-loss and take-profit methods, as well as ATR-based risk management, to control risk and optimize returns.
Strategy Principle
The strategy uses the following four indicators to determine market trends:
- Moving Averages (MA): Calculate short-term (9-period) and long-term (21-period) moving averages. When the short-term MA crosses above the long-term MA, it indicates an uptrend; when the short-term MA crosses below the long-term MA, it indicates a downtrend.
- Moving Average Convergence Divergence (MACD): Calculate the MACD line and signal line. When the MACD line crosses above the signal line, it indicates an uptrend; when the MACD line crosses below the signal line, it indicates a downtrend.
- Relative Strength Index (RSI): Calculate the 14-period RSI. When RSI is above 70, it suggests that the market may be overbought; when RSI is below 30, it suggests that the market may be oversold.
- Average True Range (ATR): Calculate the 14-period ATR to measure market volatility and set stop-loss and take-profit points.
The trading logic of the strategy is as follows:
- When the short-term MA crosses above the long-term MA, the MACD line crosses above the signal line, the trading volume is greater than its moving average, and the volatility is below the threshold, enter a long position.
- When the short-term MA crosses below the long-term MA, the MACD line crosses below the signal line, the trading volume is greater than its moving average, and the volatility is below the threshold, enter a short position.
- Stop-loss and take-profit points are dynamically set based on ATR, with the stop-loss point being 2 times the ATR and the take-profit point being 4 times the ATR.
- An optional trailing stop based on ATR can be used, with the trailing stop point being 2.5 times the ATR.
Strategy Advantages
- Multi-indicator combination for trend determination, improving the accuracy of trend identification.
- Dynamic stop-loss and take-profit, adaptively adjusting based on market volatility, better controlling risk and optimizing returns.
- Introduction of volume and volatility filters to avoid trading during low liquidity and high volatility periods, reducing false signals.
- Optional trailing stop to retain more profits when trends persist.
Strategy Risks
- False signals may be generated during market consolidation or trend reversals, leading to losses.
- Parameter settings have a significant impact on strategy performance and need to be optimized for different markets and assets.
- Over-optimization of parameters may lead to overfitting and poor performance in actual trading.
- The strategy may incur significant losses during abnormal market fluctuations or black swan events.
Strategy Optimization Directions
- Introduce more indicators, such as Bollinger Bands, Stochastic Oscillator, etc., to further improve trend identification accuracy.
- Optimize parameter selection using methods like genetic algorithms or grid search to find the optimal parameter combination.
- Set different parameters and rules for different markets and assets to improve the adaptability of the strategy.
- Incorporate position sizing, dynamically adjusting position size based on trend strength and account risk.
- Set a maximum drawdown limit, suspending trading or reducing position size when the account reaches the maximum drawdown, to control risk.
Summary
"Jancok Strategycs v3" is a trend following strategy based on a combination of multiple indicators, using Moving Averages, MACD, RSI, and ATR to determine market trends, and employing risk management techniques such as dynamic stop-loss and take-profit, and trailing stop to control risk and optimize returns. The strategy's advantages lie in its high accuracy of trend identification, flexible risk management, and strong adaptability. However, it also carries certain risks, such as false signals, sensitivity to parameter settings, and black swan events. In the future, the strategy's performance and stability can be further enhanced by introducing more indicators, optimizing parameter selection, incorporating position sizing, and setting a maximum drawdown limit.
Parameters
| Name | Default | What it controls |
|---|---|---|
| v_input_int_1 | 9 | Short MA Length |
| v_input_int_2 | 21 | Long MA Length |
| v_input_float_1 | 2 | ATR Multiplier for Stop Loss |
| v_input_float_2 | 4 | ATR Multiplier for Take Profit |
| v_input_int_3 | 20 | Volume MA Length |
| v_input_float_3 | 1.5 | Volatility Threshold |
| v_input_bool_1 | false | Use Trailing Stop |
| v_input_float_4 | 2.5 | Trailing Stop ATR Multiplier |
Source Pine Script
/*backtest
start: 2024-03-01 00:00:00
end: 2024-03-31 23:59:59
period: 1h
basePeriod: 15m
exchanges: [{"eid":"Futures_Binance","currency":"BTC_USDT"}]
*/

// This Pine Script™ code is subject to the terms of the Mozilla Public License 2.0 at https://mozilla.org/MPL/2.0/
// © financialAccou42381

//@version=5
strategy("Jancok Strategycs v3", overlay=true, initial_capital=100, currency="USD")

// Inputs
short_ma_length = input.int(9, title="Short MA Length", minval=1)
long_ma_length = input.int(21, title="Long MA Length", minval=1)
atr_multiplier_for_sl = input.float(2, title="ATR Multiplier for Stop Loss", minval=1.0)
atr_multiplier_for_tp = input.float(4, title="ATR Multiplier for Take Profit", minval=1.0)
volume_ma_length = input.int(20, title="Volume MA Length", minval=1)
volatility_threshold = input.float(1.5, title="Volatility Threshold", minval=0.1, step=0.1)
use_trailing_stop = input.bool(false, title="Use Trailing Stop")
trailing_stop_atr_multiplier = input.float(2.5, title="Trailing Stop ATR Multiplier", minval=1.0)

// Calculating indicators
short_ma = ta.sma(close, short_ma_length)
long_ma = ta.sma(close, long_ma_length)
[macdLine, signalLine, _] = ta.macd(close, 12, 26, 9)
atr = ta.atr(14)
volume_ma = ta.sma(volume, volume_ma_length)
volatility = atr / close

// Plotting indicators
plot(short_ma, color=color.red)
plot(long_ma, color=color.blue)

// Defining entry conditions with added indicators and filters
long_condition = ta.crossover(short_ma, long_ma) and (macdLine > signalLine) and (volume > volume_ma) and (volatility < volatility_threshold)
short_condition = ta.crossunder(short_ma, long_ma) and (macdLine < signalLine) and (volume > volume_ma) and (volatility < volatility_threshold)

// Entering trades with dynamic stop loss and take profit based on ATR
if (long_condition)
    strategy.entry("Long", strategy.long)
    if use_trailing_stop
        strategy.exit("Exit Long", "Long", trail_points=atr * trailing_stop_atr_multiplier, trail_offset=atr * 0.5)
    else
        strategy.exit("Exit Long", "Long", loss=atr * atr_multiplier_for_sl, profit=atr * atr_multiplier_for_tp)

if (short_condition)
    strategy.entry("Short", strategy.short)
    if use_trailing_stop
        strategy.exit("Exit Short", "Short", trail_points=atr * trailing_stop_atr_multiplier, trail_offset=atr * 0.5)
    else
        strategy.exit("Exit Short", "Short", loss=atr * atr_multiplier_for_sl, profit=atr * atr_multiplier_for_tp)
Published by ChaoZhang on the FMZ strategy square · last modified 2024-04-28. Collected in the Quant Trading Vault. Unvalidated research: re-test with your own data and costs before trusting it.
Build this with AgenKit
A spec is not a trading system. Paste this into your coding agent and AgenKit runs a specialist team — architecture, test-first build, risk gates, review — with paper trading on by default.
/agenkit build a production-grade trading bot with a backtest engine, risk controls and paper trading by default from strategies/Multi-Indicator-Trend-Following-Strategy.md- npx agenkit install engineering-kit in your project
- Paste the command into your agent and approve each phase
- Get tests, backtest, risk controls and a paper-trading switch
Understand it first
Before you run this, read the lesson behind the idea and how to backtest it honestly. Specs like this one are the survivors of an unknown number of trials; deflate their results accordingly.
Related specs
- Bollinger Bands and RSI Trend Following StrategyPine Script · Trend following · 1h
- Dual ATR Channel Trend Following StrategyPine Script · Trend following · 15m
- Dynamic Dual EMA Crossover Strategy with Adaptive Profit Loss ControlPine Script · Trend following · 1d
- EMA and RSI Trend Trading StrategyPine Script · Trend following · 1d
- Fixed Range Volume Profile And Anchored VWAP Trend Identification Strategy With Dynamic Stop LossPine Script · Trend following · 1h
- Multi Dimensional Short Term Trend Predictor Technical Analysis and Volatility Adaptive Trading StrategyPine Script · Trend following · 1h