Multi Moving Average Supertrend with Bollinger Breakout Trading Strategy
This strategy is a comprehensive trading system that combines multiple indicators, primarily based on Exponential Moving Averages (EMA), Supertrend indicator, Bollinger Bands (BB), and Relative Strength Index (RSI)…
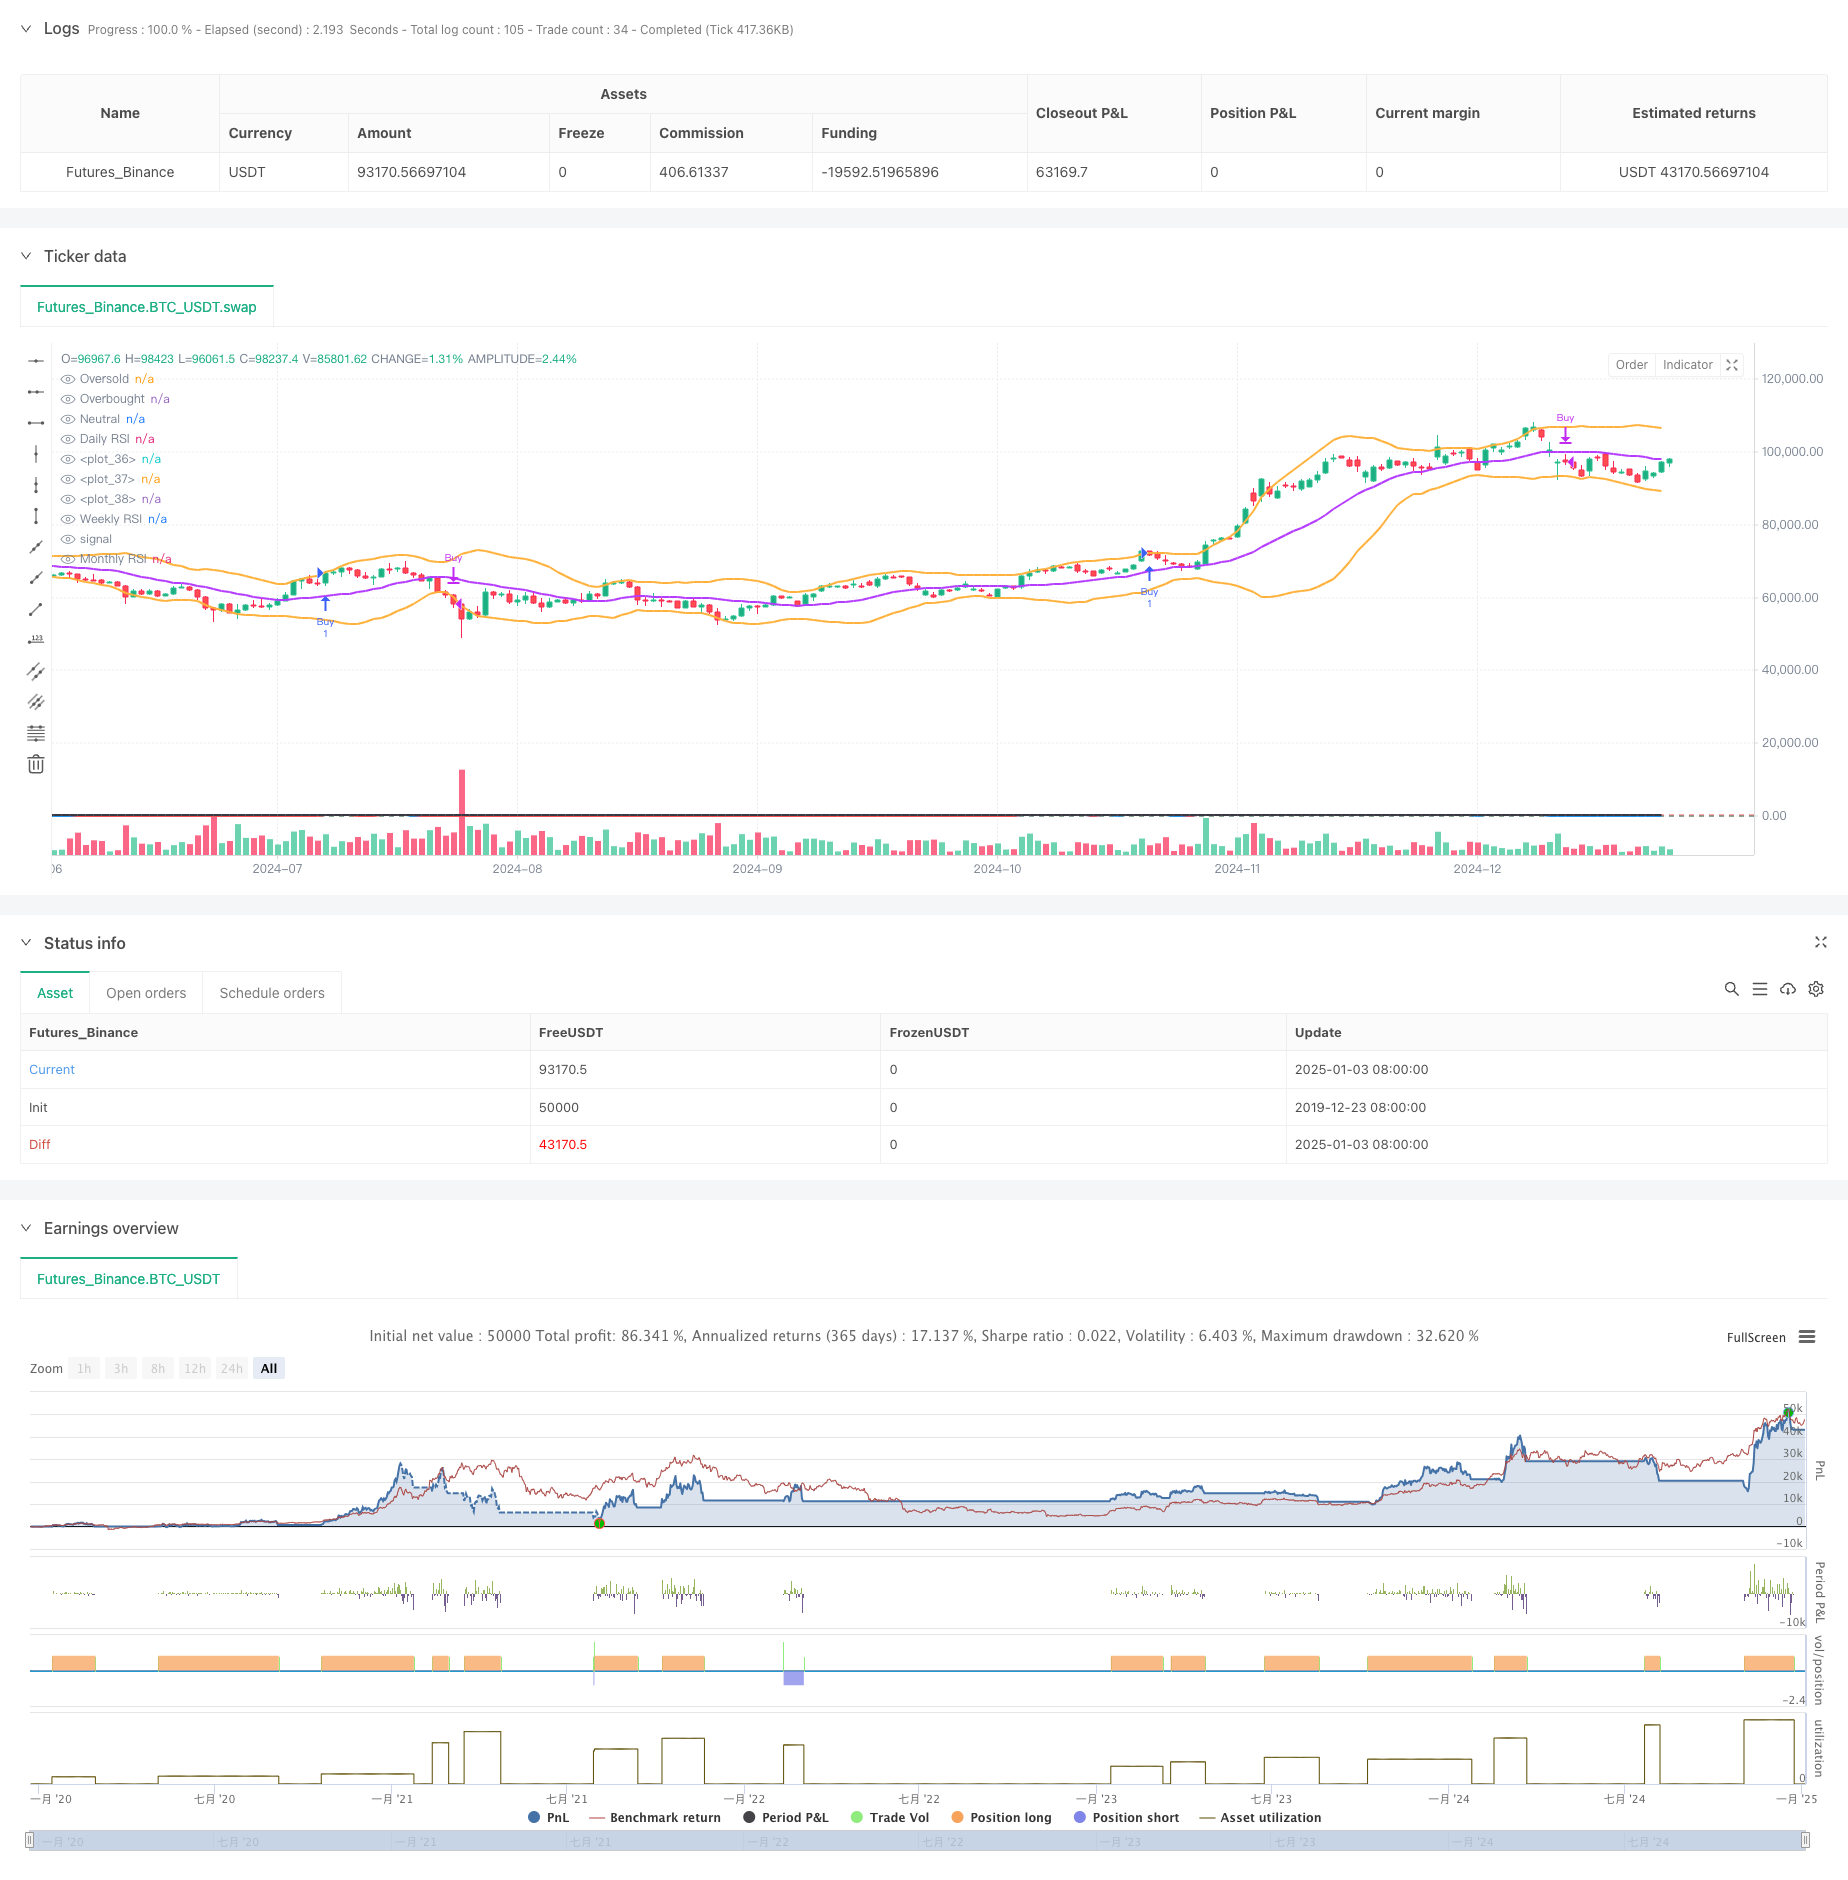
Overview
This strategy is a comprehensive trading system that combines multiple indicators, primarily based on Exponential Moving Averages (EMA), Supertrend indicator, Bollinger Bands (BB), and Relative Strength Index (RSI). The core logic builds trading signals around EMA and Supertrend, while incorporating BB and RSI for supplementary analysis of market volatility and momentum. The system employs multi-timeframe RSI analysis, including daily, weekly, and monthly periods, providing a more comprehensive market perspective for trading decisions.
Strategy Principles
The strategy utilizes a multi-layer technical indicator combination to capture market trends and volatility opportunities:
- Uses triple EMA (13,34,100) to establish a trend-following system, determining trend direction through crossovers and relative positions
- Integrates Supertrend indicator for trend confirmation and stop-loss reference
- Employs ADX indicator to filter strong trends, setting 25 as the trend strength threshold
- Utilizes Bollinger Bands (20,2) to monitor price volatility range
- Implements triple-timeframe RSI (14) to analyze market overbought/oversold conditions
Trading signal triggers:
- Long Entry: Supertrend turns bullish + EMA13 crosses above EMA34 + price above EMA100 + ADX>25
- Short Entry: Supertrend turns bullish + EMA13 crosses below EMA34 + price below EMA100 + ADX>25
- Exit Signals: Price crosses Supertrend for respective position exits
Strategy Advantages
- Integration of multiple technical indicators provides more reliable trading signals, effectively reducing false signals
- Triple EMA system captures trend characteristics across different timeframes
- ADX incorporation ensures trading only in strong trend markets
- Multi-timeframe RSI analysis offers comprehensive market momentum assessment
- Supertrend indicator provides objective stop-loss reference points
- Bollinger Bands integration aids in determining market volatility states and potential breakout opportunities
Strategy Risks
- Multiple indicator system may lead to lagging signals, affecting entry timing
- May generate frequent false breakout signals in ranging markets
- Fixed ADX threshold may perform inconsistently across different market environments
- Rapid market volatility may result in suboptimal stop-loss placement Risk control suggestions:
- Dynamically adjust ADX threshold based on market characteristics
- Introduce volatility-adaptive stop-loss mechanism
- Add volume analysis for signal confirmation
Strategy Optimization Directions
- Indicator Parameter Optimization
- Consider introducing adaptive EMA periods
- Dynamically adjust Supertrend multiplier based on volatility
- Optimize Bollinger Bands parameters for different market phases
- Signal System Enhancement
- Integrate volume factors for trade signal verification
- Add market structure analysis
- Implement volatility filters
- Risk Management Improvement
- Design dynamic stop-loss mechanism
- Establish position sizing system
- Add trading time filters
Summary
This strategy constructs a relatively complete trading system through the organic combination of multiple technical indicators. EMA and Supertrend cooperation provides primary trading signals, ADX filtering ensures trading occurs in strong trend environments, while Bollinger Bands and RSI auxiliary analysis provides additional market perspectives. The strategy's main advantages lie in signal reliability and system completeness, but it also faces challenges in signal lag and parameter optimization. Through the proposed optimization directions, the strategy has the potential to enhance profitability while maintaining stability.
Source Pine Script
/*backtest
start: 2019-12-23 08:00:00
end: 2025-01-04 08:00:00
period: 1d
basePeriod: 1d
exchanges: [{"eid":"Futures_Binance","currency":"BTC_USDT"}]
*/

//made by Chinmay

//@version=6
strategy("CJ - Multi1", overlay=true)

// Input for RSI length
rsi_length = input.int(14, title="RSI Length")

// Calculate Daily RSI
daily_rsi = ta.rsi(close, rsi_length)

// Calculate Weekly RSI (using security function to get weekly data)
weekly_rsi = request.security(syminfo.tickerid, "W", ta.rsi(close, rsi_length))

// Calculate Monthly RSI (using security function to get weekly data)
monthly_rsi = request.security(syminfo.tickerid, "M", ta.rsi(close, rsi_length))

// Plot the RSIs
plot(daily_rsi, color=color.blue, title="Daily RSI", linewidth=2)
plot(weekly_rsi, color=color.red, title="Weekly RSI", linewidth=2)
plot(monthly_rsi, color=color.black, title="Monthly RSI", linewidth=2)

// Create horizontal lines at 30, 50, and 70 for RSI reference
hline(30, "Oversold", color=color.green)
hline(70, "Overbought", color=color.red)
hline(50, "Neutral", color=color.gray)

// Bollinger Bands Calculation
bb_length = 20
bb_mult = 2
bb_stddev = ta.stdev(close, bb_length)
bb_average = ta.sma(close, bb_length)
bb_upper = bb_average + bb_mult * bb_stddev
bb_lower = bb_average - bb_mult * bb_stddev

plot(bb_upper, color=color.new(#ffb13b, 0), linewidth=2)
plot(bb_average, color=color.new(#b43bff, 0), linewidth=2)
plot(bb_lower, color=color.new(#ffb13b, 0), linewidth=2)

// Inputs for EMA
ema_L1 = input.int(defval=13, title="EMA Length 1")
ema_L2 = input.int(defval=34, title="EMA Length 2")
ema_L3 = input.int(defval=100, title="EMA Length 3")
adx_level = input.int(defval=25, title="ADX Level")

// Inputs for Supertrend
atr_l = input.int(defval=10, title="ATR Length")
factor = input.float(defval=3.0, title="Supertrend Multiplier")

// Calculate EMA
ema1 = ta.ema(close, ema_L1)
ema2 = ta.ema(close, ema_L2)
ema3 = ta.ema(close, ema_L3)

// Calculate Supertrend
[supertrend, direction] = ta.supertrend(factor, atr_l)

// Calculate ADX and DI
[diplus, diminus, adx] = ta.dmi(14,14)

// Buy and Sell Conditions
buy = direction == -1 and ema1 > ema2 and close > ta.ema(close, 100) and adx > adx_level
short = direction == -1 and ema1 < ema2 and close < ta.ema(close, 100) and adx > adx_level

sell = ta.crossunder(close, supertrend)
cover = ta.crossover(close, supertrend)

// Strategy Logic
if buy
    strategy.entry("Buy", strategy.long, comment="Long Entry")

if sell
    strategy.close("Buy", comment="Sell Exit")

// Uncomment for Short Strategy
if short
    strategy.entry("Short", strategy.short, comment="Short Entry")

if cover
    strategy.close("Short", comment="Cover Exit")
Published by ChaoZhang on the FMZ strategy square · last modified 2025-01-06. Collected in the Quant Trading Vault. Unvalidated research: re-test with your own data and costs before trusting it.
Build this with AgenKit
A spec is not a trading system. Paste this into your coding agent and AgenKit runs a specialist team — architecture, test-first build, risk gates, review — with paper trading on by default.
/agenkit build a production-grade trading bot with a backtest engine, risk controls and paper trading by default from strategies/Multi-Moving-Average-Supertrend-with-Bollinger-Breakout-Trading-Strategy.md- npx agenkit install engineering-kit in your project
- Paste the command into your agent and approve each phase
- Get tests, backtest, risk controls and a paper-trading switch
Understand it first
Before you run this, read the lesson behind the idea and how to backtest it honestly. Specs like this one are the survivors of an unknown number of trials; deflate their results accordingly.
Related specs
- Momentum Breakout Trading Strategy 440964Pine Script · Breakout · 5m
- Triple Pattern Oscillation Trading StrategyPine Script · Breakout · 1h
- Moving Average Crossover and Upper Rail Breakthrough Impulse StrategyPine Script · Breakout · 1m
- Quantitative Trading Strategy Based on Ichimoku with Multiple SignalsPine Script · Breakout · 1h
- Dual MA Indicator Oscillating Price Tracking StrategyPine Script · Breakout · 2h
- Cross Timeframe SuperTrend Breakout StrategyPine Script · Breakout · 1h