Strategy vault / Trend following
Multi Period RSI Signal Line Crossover Trend Following Strategy
This strategy is a trend-following trading system based on an enhanced Relative Strength Index (RSI). It captures trend reversal opportunities across different market cycles by calculating an improved version of RSI…
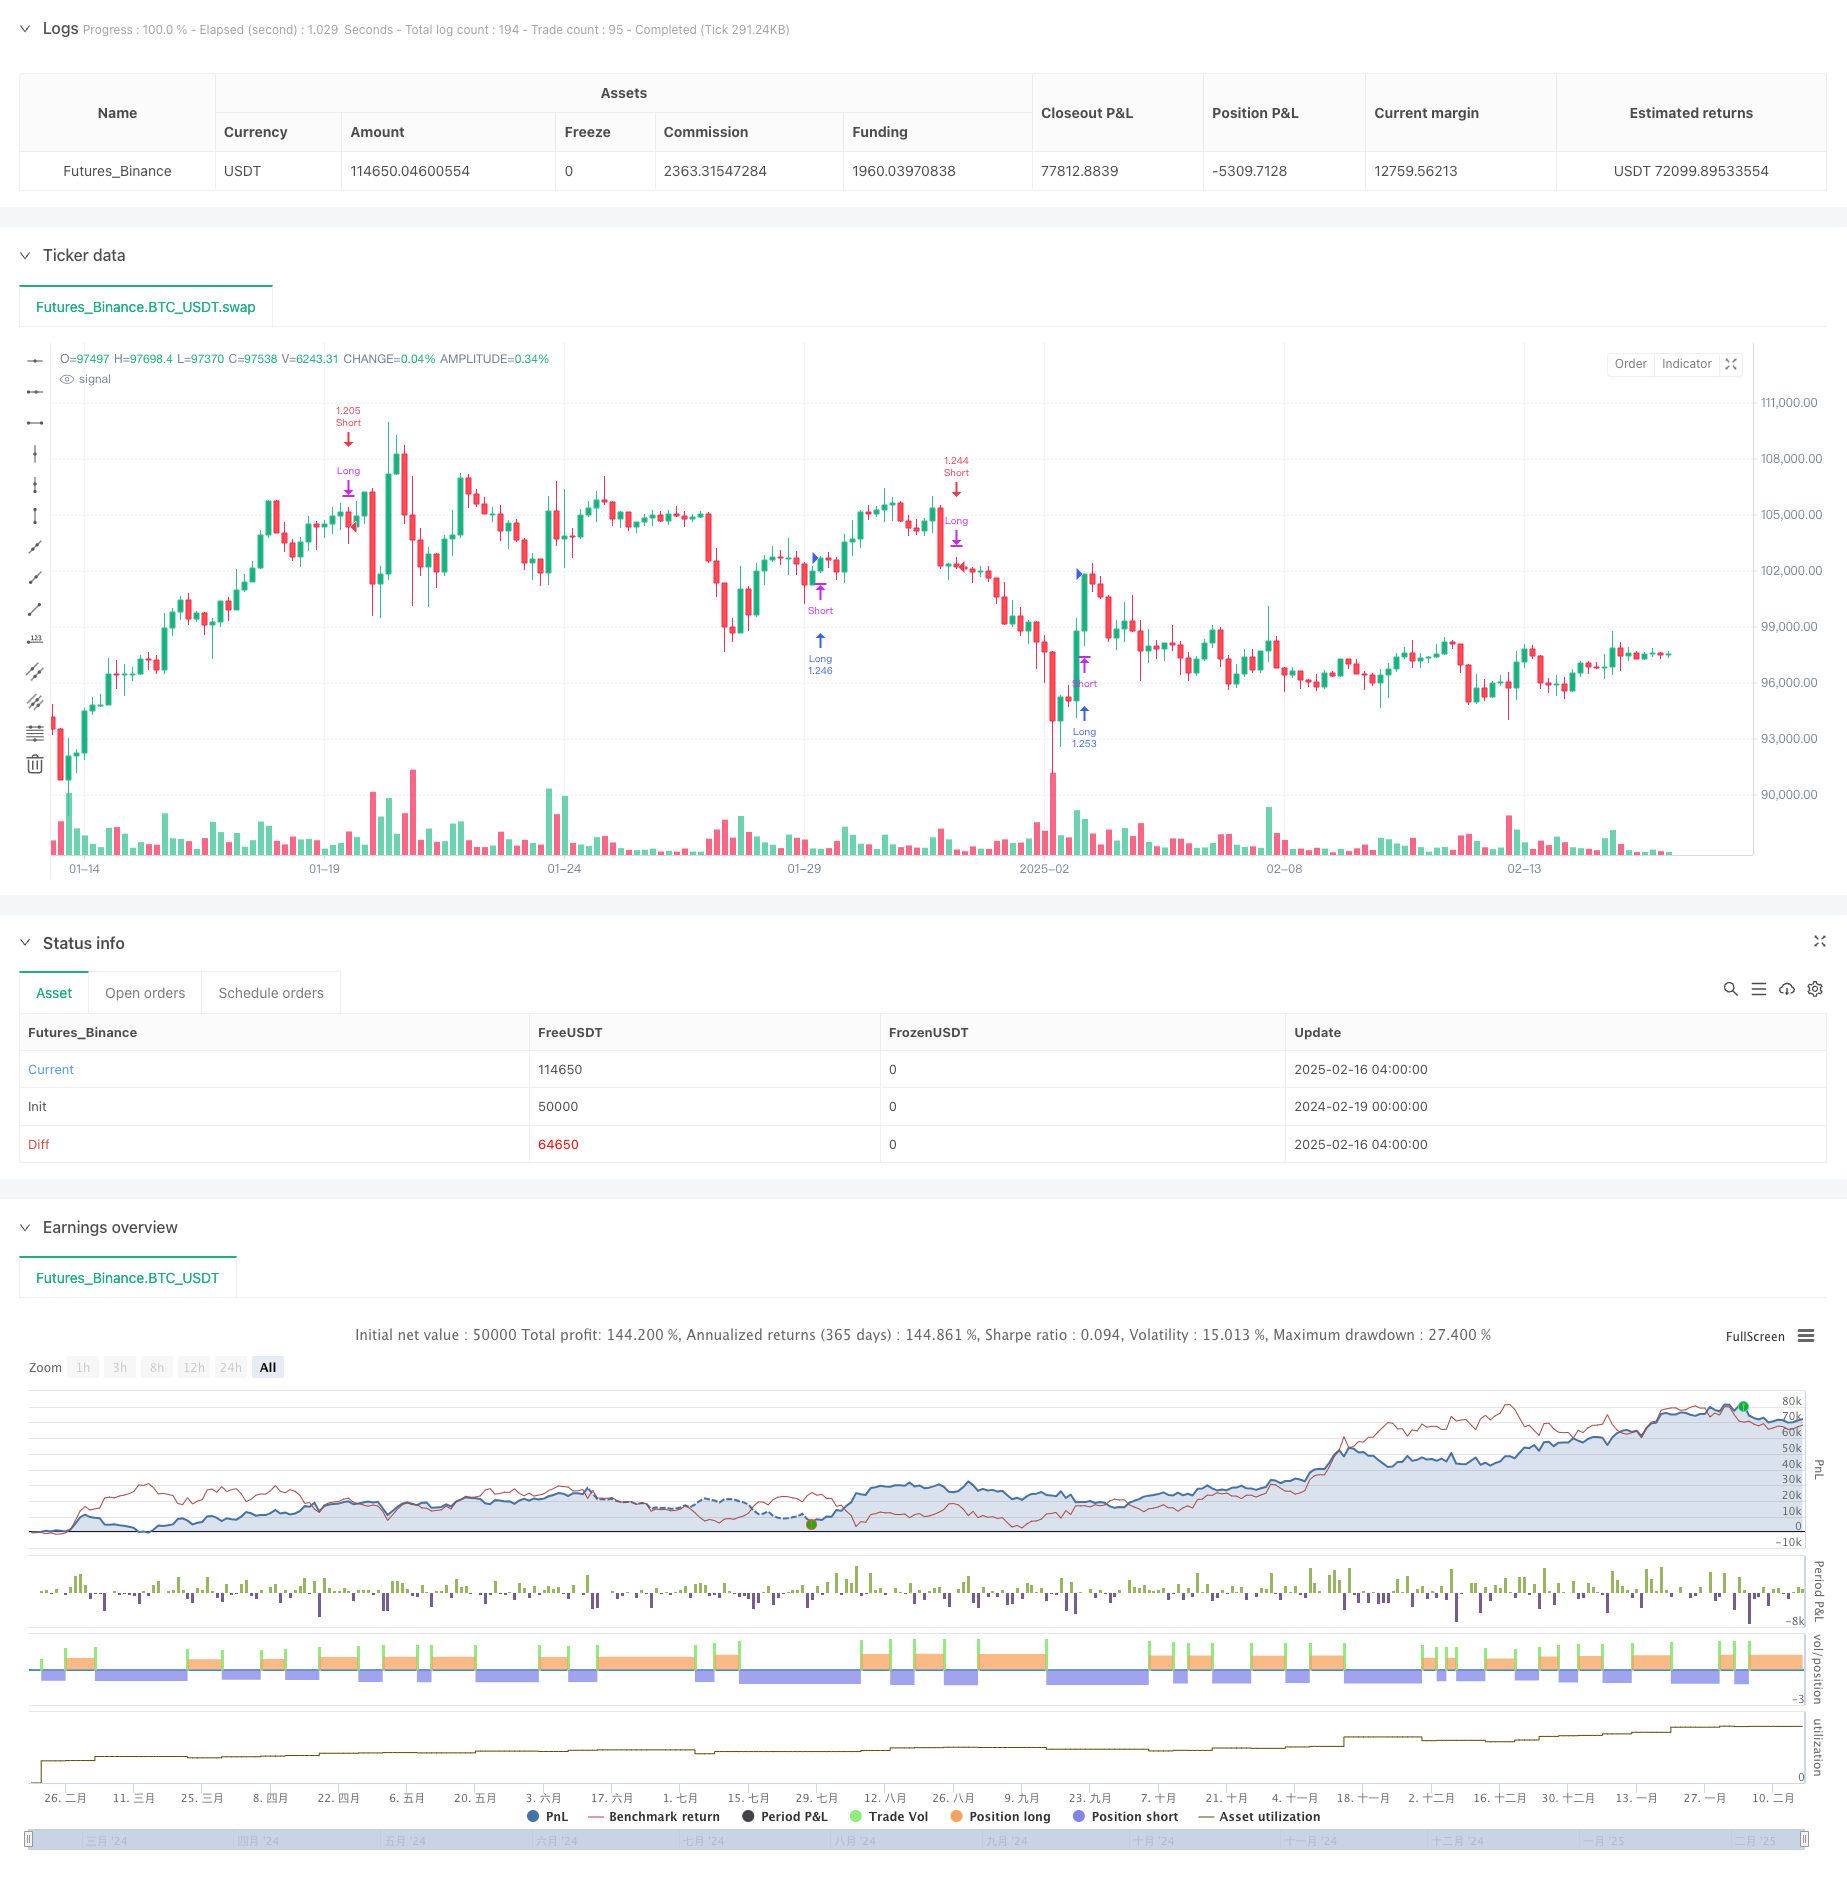
Overview
This strategy is a trend-following trading system based on an enhanced Relative Strength Index (RSI). It captures trend reversal opportunities across different market cycles by calculating an improved version of RSI and combining it with its signal line. The strategy not only computes indicator values but also provides visual representation of overbought and oversold areas to help traders make more intuitive market judgments.
Strategy Principles
The core principle revolves around identifying market trends through an Augmented RSI (ARSI) calculation, including:
- Calculating highest and lowest prices within a specified period to determine price range
- Computing differences based on price changes
- Smoothing the differences using selectable moving average methods (EMA, SMA, RMA, TMA)
- Normalizing results to a 0-100 range
- Generating long signals when ARSI crosses above its signal line below 50
- Generating short signals when ARSI crosses below its signal line above 50
Strategy Advantages
- Robust Signal Confirmation - Ensures reliability through ARSI crossovers and midline filtering
- High Adaptability - Supports multiple moving average methods for different market characteristics
- Reasonable Risk Control - Employs position percentage management for effective risk control
- Outstanding Visualization - Clearly displays overbought/oversold areas through color filling
- Reverse Position Management - Automatically closes existing positions on contrary signals
Strategy Risks
- Oscillation Market Risk - May generate frequent false signals in sideways markets
- Lag Risk - Signals have inherent lag due to moving average calculations
- Parameter Sensitivity - Different parameter settings may lead to significant performance variations
- Market Adaptability Risk - Strategy performance may vary significantly across different market environments
- Money Management Risk - Fixed percentage position sizing may pose risks during high volatility
Optimization Directions
- Volatility Filtering - Add ATR indicator to filter signals in low volatility environments
- Additional Trend Confirmation - Incorporate longer-period trend indicators to improve signal reliability
- Position Management Optimization - Dynamically adjust position sizes based on market volatility
- Stop Loss Implementation - Develop ATR-based dynamic stop-loss for better risk control
- Adaptive Parameters - Research dynamic parameter optimization methods to improve adaptability
Summary
This is a well-structured trend-following strategy with clear logic. Through innovative ARSI calculation methods and the combination of various technical indicators' advantages, it forms a reliable trading system. While inherent risks exist, the strategy shows good practical application potential through reasonable optimization and risk management measures. Traders are advised to thoroughly test parameter settings and adjust strategy configuration according to market conditions when implementing in live trading.
Source Pine Script
/*backtest
start: 2024-02-19 00:00:00
end: 2025-02-16 08:00:00
period: 4h
basePeriod: 4h
exchanges: [{"eid":"Futures_Binance","currency":"BTC_USDT"}]
*/

//@version=6
strategy("Ultimate RSI [LuxAlgo] Strategy", shorttitle="ULT RSI Strat", overlay=false, initial_capital=10000, currency=currency.USD, default_qty_type=strategy.percent_of_equity, default_qty_value=100)

//------------------------------------------------------------------------------
// Settings
//------------------------------------------------------------------------------
length    = input.int(14, minval=2, title="RSI Length")
smoType1  = input.string("RMA", title="Method", options=["EMA", "SMA", "RMA", "TMA"])
src       = input(close, title="Source")

arsiCss   = input.color(color.silver, "RSI Color", inline="rsicss")
autoCss   = input.bool(true, "Auto", inline="rsicss")

// Signal Line settings
smooth    = input.int(14, minval=1, title="Signal Smooth", group="Signal Line")
smoType2  = input.string("EMA", title="Method", options=["EMA", "SMA", "RMA", "TMA"], group="Signal Line")
signalCss = input.color(color.new(#ff5d00, 0), "Signal Color", group="Signal Line")

// Overbought/Oversold style
obValue     = input.float(80, "Overbought", inline="ob", group="OB/OS Style")
obCss       = input.color(color.new(#089981, 0), "", inline="ob", group="OB/OS Style")
obAreaCss   = input.color(color.new(#089981, 80), "", inline="ob", group="OB/OS Style")

osValue     = input.float(20, "Oversold", inline="os", group="OB/OS Style")
osCss       = input.color(color.new(#f23645, 0), "", inline="os", group="OB/OS Style")
osAreaCss   = input.color(color.new(#f23645, 80), "", inline="os", group="OB/OS Style")

//------------------------------------------------------------------------------
// Function: Moving Average (selectable type)
//------------------------------------------------------------------------------
ma(x, len, maType)=>
    switch maType
        "EMA" => ta.ema(x, len)
        "SMA" => ta.sma(x, len)
        "RMA" => ta.rma(x, len)
        "TMA" => ta.sma(ta.sma(x, len), len)

//------------------------------------------------------------------------------
// Augmented RSI Calculation
//------------------------------------------------------------------------------
upper = ta.highest(src, length)
lower = ta.lowest(src, length)
r     = upper - lower

d     = src - src[1]
diff  = upper > upper[1] ? r : lower < lower[1] ? -r : d

num   = ma(diff, length, smoType1)
den   = ma(math.abs(diff), length, smoType1)
arsi  = den != 0 ? num / den * 50 + 50 : 50  // safeguard against division by zero

signal = ma(arsi, smooth, smoType2)

//------------------------------------------------------------------------------
// Strategy Entry Conditions
//------------------------------------------------------------------------------
// Long entry: Ultimate RSI crosses above its signal when it is below 50 (lower half)
// Short entry: Ultimate RSI crosses below its signal when it is above 50 (upper half)
longCondition  = ta.crossover(arsi, signal) and arsi < 50
shortCondition = ta.crossunder(arsi, signal) and arsi > 50

// Close opposite positions when conditions occur
if shortCondition
    strategy.close("Long")
if longCondition
    strategy.close("Short")

// Place new entries based on the conditions
if longCondition
    strategy.entry("Long", strategy.long)
if shortCondition
    strategy.entry("Short", strategy.short)

// //------------------------------------------------------------------------------
// // Plots and Constant Lines
// //------------------------------------------------------------------------------
// // Plot the Ultimate RSI and its Signal
// plot_rsi = plot(arsi, title="Ultimate RSI",
//      color = arsi > obValue ? obCss : arsi < osValue ? osCss : autoCss ? chart.fg_color : arsiCss,
//      linewidth=2)
// plot(signal, title="Signal Line", color=signalCss, linewidth=2)

// // Instead of using hline, create constant plots for OB, Midline, and OS
// plot_ob  = plot(obValue, title="Overbought", color=obCss, style=plot.style_line, linewidth=1)
// plot_mid = plot(50, title="Midline", color=color.gray, style=plot.style_line, linewidth=1)
// plot_os  = plot(osValue, title="Oversold", color=osCss, style=plot.style_line, linewidth=1)

// //------------------------------------------------------------------------------
// // Fill OB/OS Areas for Visual Clarity
// //------------------------------------------------------------------------------
// fill(plot_rsi, plot_ob, color=arsi > obValue ? obAreaCss : na)
// fill(plot_os, plot_rsi, color=arsi < osValue ? osAreaCss : na)
Published by ChaoZhang on the FMZ strategy square · last modified 2025-02-18. Collected in the Quant Trading Vault. Unvalidated research: re-test with your own data and costs before trusting it.
Build this with AgenKit
A spec is not a trading system. Paste this into your coding agent and AgenKit runs a specialist team — architecture, test-first build, risk gates, review — with paper trading on by default.
/agenkit build a production-grade trading bot with a backtest engine, risk controls and paper trading by default from strategies/Multi-Period-RSI-Signal-Line-Crossover-Trend-Following-Strategy.md- npx agenkit install engineering-kit in your project
- Paste the command into your agent and approve each phase
- Get tests, backtest, risk controls and a paper-trading switch
Understand it first
Before you run this, read the lesson behind the idea and how to backtest it honestly. Specs like this one are the survivors of an unknown number of trials; deflate their results accordingly.
Related specs
- Bollinger Bands and RSI Trend Following StrategyPine Script · Trend following · 1h
- Dual ATR Channel Trend Following StrategyPine Script · Trend following · 15m
- Dual Mode Adaptive Trend Trading Strategy EMA Crossover with ATR Volatility Based Risk Management SystemPine Script · Trend following · 1d
- Dynamic Dual EMA Crossover Strategy with Adaptive Profit Loss ControlPine Script · Trend following · 1d
- Dynamic Signal Line Trend Following and Volatility Filtering StrategyPine Script · Trend following · 1h
- EMA Cross Trend Following Strategy with SMA Stop Loss and Re Entry MechanismPine Script · Trend following · 1h