Multi Technical Indicator Dynamic Wave Trading Strategy
This is a dynamic wave trading strategy based on multiple technical indicators, combining trend following and wave operation characteristics. The strategy seeks high-probability trading opportunities through the…
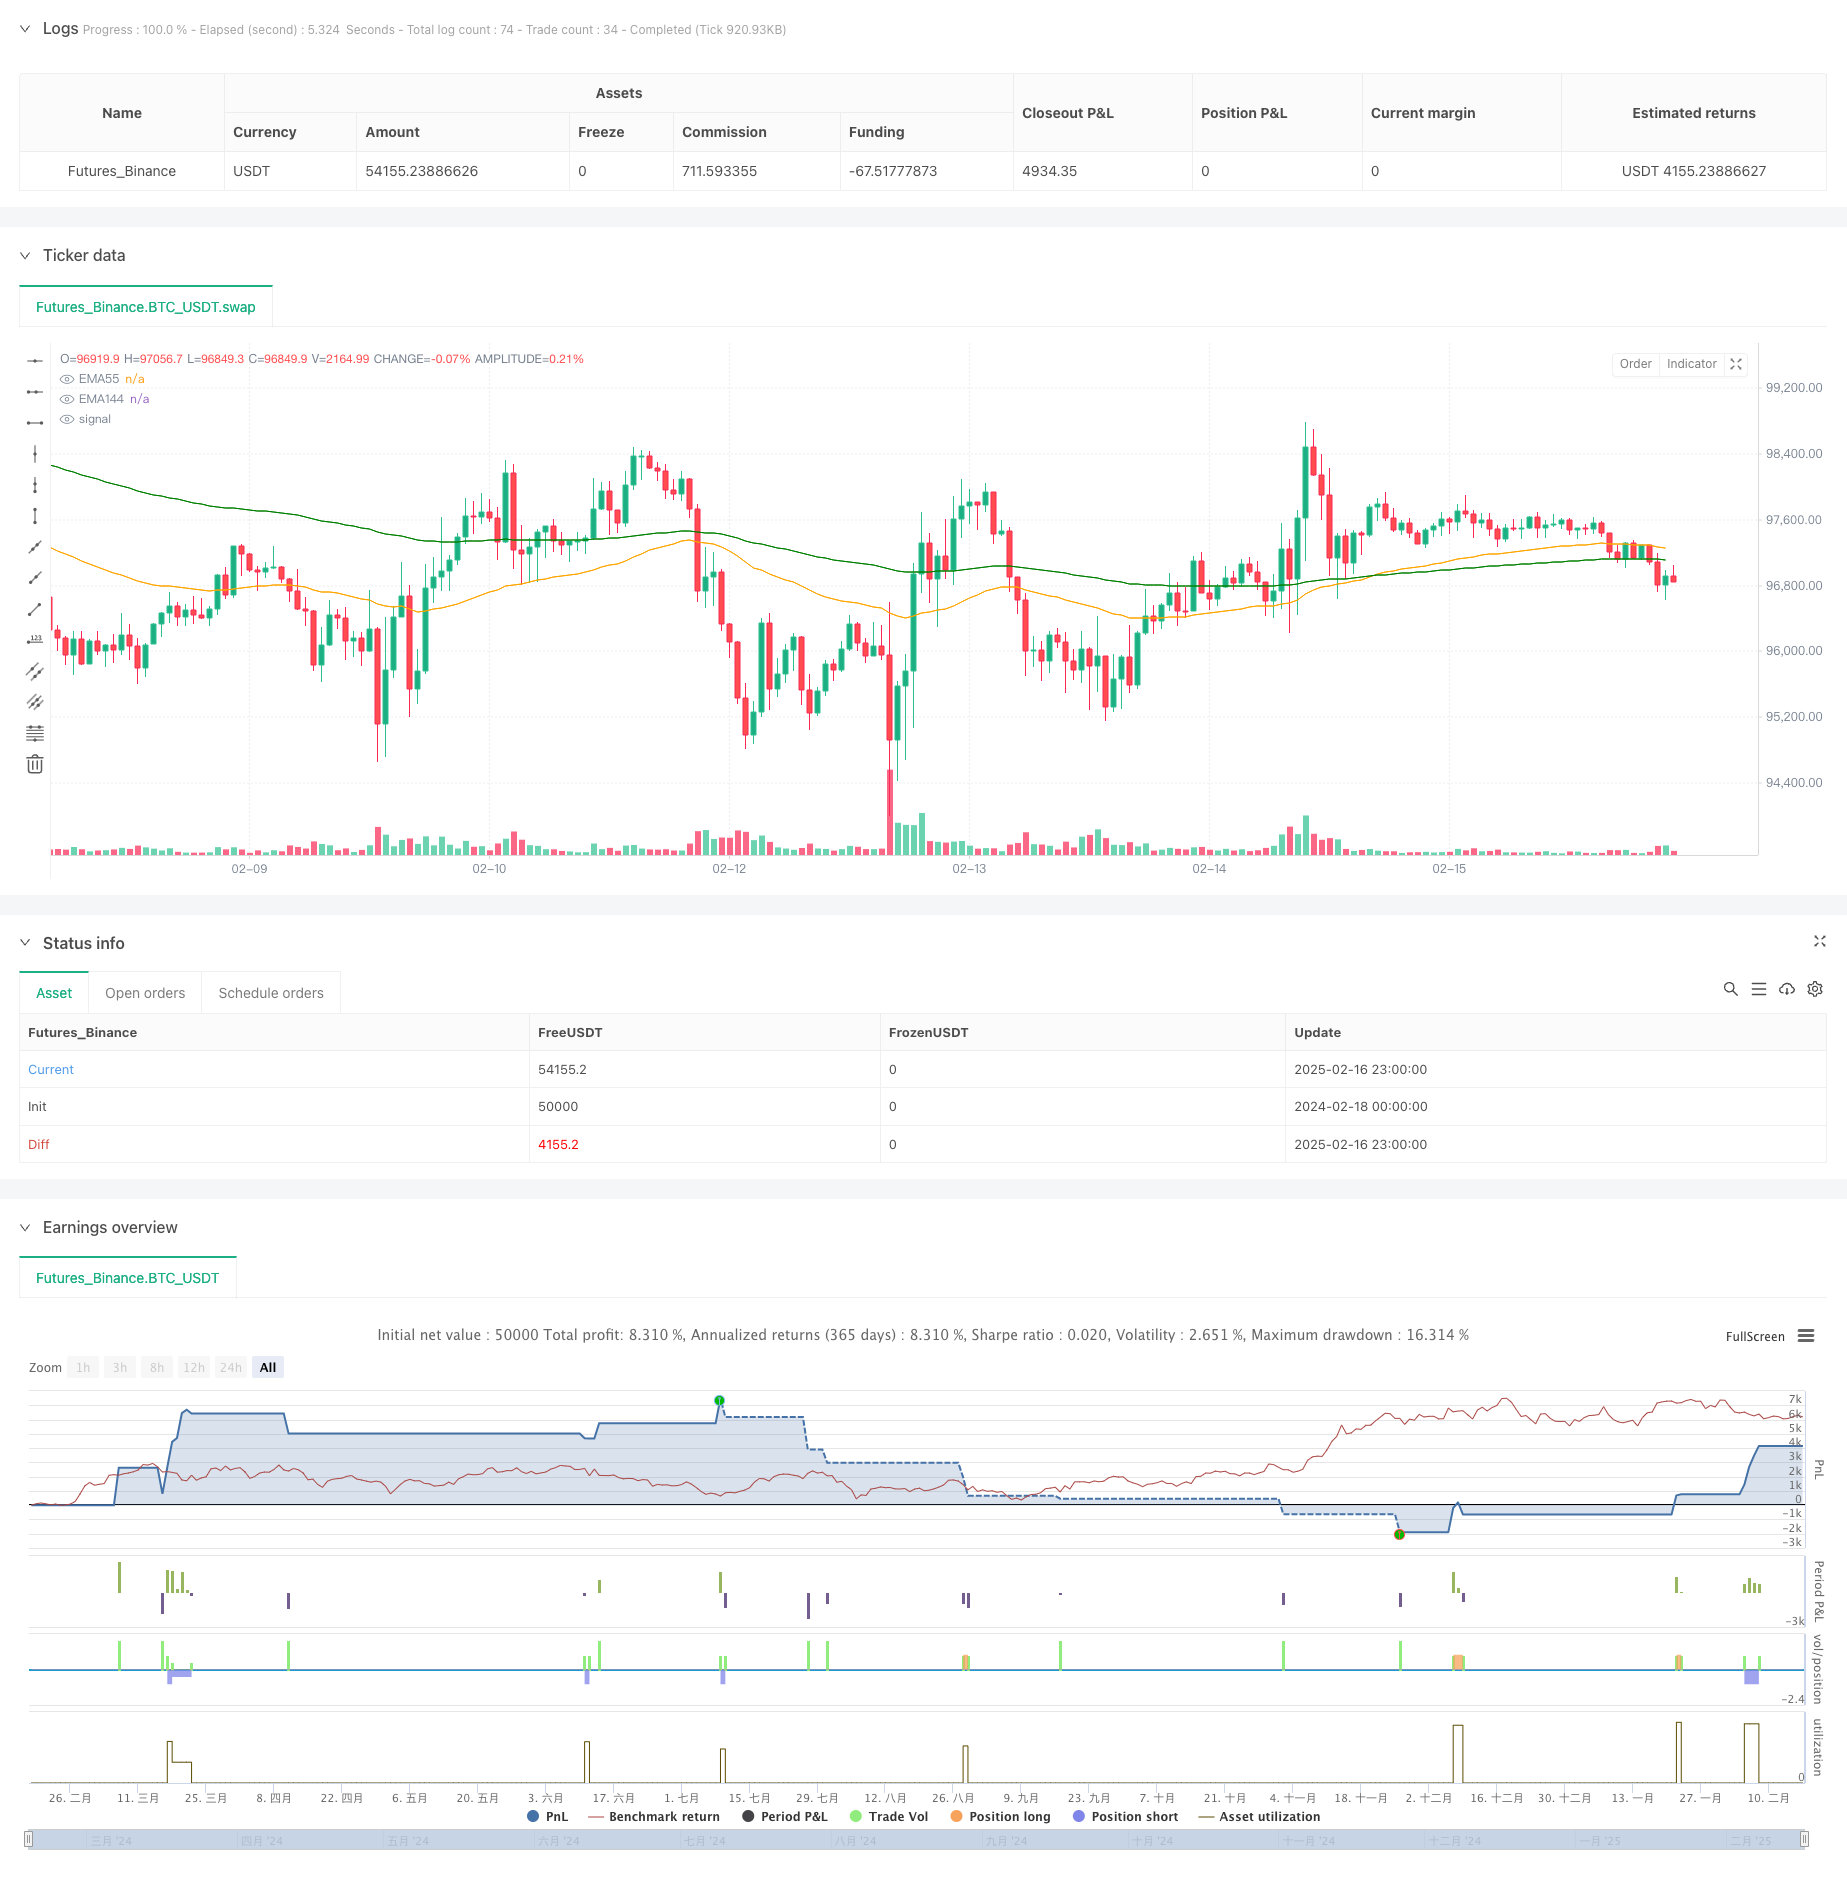
Overview
This is a dynamic wave trading strategy based on multiple technical indicators, combining trend following and wave operation characteristics. The strategy seeks high-probability trading opportunities through the coordination of multiple technical indicators including EMA, ADX, RSI, and MACD. The system manages risk and profit through dynamic stop-loss and batch profit-taking methods.
Strategy Principle
The core logic of the strategy is based on the following key elements:
- Trend Judgment: Uses EMA55 and EMA144 crossover relationships to determine market trend direction, combined with ADX indicator strength (threshold 30) for trend confirmation.
- Entry Timing: Identifies oversold and overbought areas through RSI indicator (oversold 45, overbought 55) to judge pullback buying and rebound shorting opportunities.
- Stop-Loss Mechanism: Adopts ATR-based dynamic stop-loss, with a stop-loss distance of 1.5 times ATR, which can adaptively adjust according to market volatility.
- Profit Strategy: Uses 50-period high/low prices as profit targets, adopting a 50% position batch profit-taking approach.
Strategy Advantages
- Multiple Indicator Verification: Improves trading signal reliability through the combined use of multiple indicators including EMA, ADX, and RSI.
- Dynamic Risk Management: ATR-based dynamic stop-loss can adapt to different market environments, providing better risk control.
- Progressive Profit-Taking: The batch profit-taking approach allows both securing partial profits and maintaining positions in strong trends.
- Trend Confirmation: Inclusion of ADX indicator filtering helps avoid frequent trading in sideways markets.
Strategy Risks
- False Breakout Risk: Misjudgments may occur during increased market volatility, suggesting the addition of volume confirmation.
- Slippage Loss: Dynamic stop-loss may face significant slippage during rapid market movements.
- Sideways Market Losses: Despite ADX filtering, consecutive small losses may still occur in oscillating markets.
- Signal Lag: Multiple indicator combinations may lead to delayed entry signals, missing optimal position-building opportunities.
Strategy Optimization Directions
- Indicator Parameter Optimization: Recommend historical backtesting optimization for parameters like EMA periods and RSI thresholds.
- Stop-Loss Optimization: Consider adding trailing stop-loss for better profit protection.
- Position Management: Suggest introducing a volatility-adaptive position management system.
- Market Adaptability: Can add market environment classification to use different parameter combinations under different market conditions.
Summary
The strategy constructs a complete trading system through the coordination of multiple technical indicators. It emphasizes both trend capture and risk control, balancing risk and return through dynamic stop-loss and batch profit-taking methods. While there is room for optimization, it is overall a logically rigorous and practical trading strategy.
Source Pine Script
/*backtest
start: 2024-02-18 00:00:00
end: 2025-02-17 00:00:00
period: 1h
basePeriod: 1h
exchanges: [{"eid":"Futures_Binance","currency":"BTC_USDT"}]
*/

//@version=6
strategy("Professional level trading system", overlay=true, max_labels_count=500)
// ===== Parameter Settings =====
x1 = input.float(1.5,"atrMultiples",step=0.1)
x2 = input.int(50,"kNumber of lines",step=1)
// EMAParameters
ema55_len = input.int(55, "EMA55Length")
ema144_len = input.int(144, "EMA144Length")
// ADXParameters
adx_len = input.int(14, "ADXLength")
adx_threshold = input.float(30.0, "ADXTrend filtering")
// RSIParameters
rsi_len = input.int(14, "RSILength")
rsi_oversold = input.float(45.0, "RSIOversold Threshold")
rsi_overbuy = input.float(55.0, "RSIOverbought Threshold")
// MACDParameters
macd_fast = input.int(12, "MACDFast line")
macd_slow = input.int(26, "MACDSlow line")
macd_signal = input.int(9, "MACDSignal Line")
// ===== Indicator calculation =====
// EMACalculation
ema55 = ta.ema(close, ema55_len)
ema144 = ta.ema(close, ema144_len)
// ADXCalculation (using standard functions)
[di_plus, di_minus, adx] = ta.dmi(adx_len, adx_len)
// RSICalculation
rsi = ta.rsi(close, rsi_len)
// MACDCalculation (Correcting parameter order).)
[macdLine, signalLine, histLine] = ta.macd(close, macd_fast, macd_slow, macd_signal)
// ===== Signal Logic =====
// Trend Conditions:EMA55 > EMA144 and ADX > 30
trendCondition = ema55 > ema144 and adx > adx_threshold
trendConditions = ema55 < ema144 and adx > adx_threshold
// Pullback Conditions:RSI < 45 and MACDhistogram > -0.002
pullbackCondition = rsi < rsi_oversold
pullbackConditions = rsi > rsi_overbuy
// Comprehensive Signal
entrySignal = trendCondition and pullbackCondition
entrySignals = trendConditions and pullbackConditions

// ===== Visualization =====
// DrawEMA
plot(ema55, "EMA55", color=color.new(#FFA500, 0))
plot(ema144, "EMA144", color=color.new(#008000, 0))
//plotshape(series=entrySignal,title="Buy Signal",location=location.belowbar,color=color.new(color.green, 0),style=shape.labelup,text="BUY",textcolor=color.new(color.white, 0))
s = strategy.position_avg_price ,s1 = strategy.position_size
le = false
le := low < ema144 and low[1] > ema144 and ema55 > ema144 ? true : s1 > 0 ? false : le[1]
se = false
se := high > ema144 and high[1] < ema144 and ema55 < ema144 ? true : s1 < 0 ? false : se[1]
if entrySignal and low < ema144 and close > ema144
    strategy.entry("l",strategy.long)
strategy.exit("Take Half Profit","l",limit= ta.highest(x2),qty_percent = 50)
if s1 > 0 and low < (close - x1*ta.atr(12))[1]
    strategy.close_all("Dynamic Stop Loss")

if entrySignals and high > ema144 and close < ema144
    strategy.entry("s",strategy.short)
strategy.exit("Take Half Profit","s",limit = ta.lowest(x2),qty_percent = 50)
if s1 < 0 and high > (close + x1*ta.atr(12))[1]
    strategy.close_all("Dynamic Stop Loss")

//plotshape(series=entrySignal,title="Buy Signal",location=location.belowbar,color=color.new(color.green, 0),style=shape.labelup,text="BUY",textcolor=color.new(color.white, 0))
//plot(close+x1*ta.atr(12))
//plot(close-x1*ta.atr(12))
//bgcolor(le ? color.red:na)Published by ChaoZhang on the FMZ strategy square · last modified 2025-02-18. Collected in the Quant Trading Vault. Unvalidated research: re-test with your own data and costs before trusting it.
Build this with AgenKit
A spec is not a trading system. Paste this into your coding agent and AgenKit runs a specialist team — architecture, test-first build, risk gates, review — with paper trading on by default.
/agenkit build a production-grade trading bot with a backtest engine, risk controls and paper trading by default from strategies/Multi-Technical-Indicator-Dynamic-Wave-Trading-Strategy.md- npx agenkit install engineering-kit in your project
- Paste the command into your agent and approve each phase
- Get tests, backtest, risk controls and a paper-trading switch
Understand it first
Before you run this, read the lesson behind the idea and how to backtest it honestly. Specs like this one are the survivors of an unknown number of trials; deflate their results accordingly.
Related specs
- Multi Timeframe Trend Confirmed Quantitative Breakout Trading StrategyPine Script · Breakout · 1d
- Momentum Breakout Trading Strategy 440964Pine Script · Breakout · 5m
- Moving Average Crossover and Upper Rail Breakthrough Impulse StrategyPine Script · Breakout · 1m
- Multi Filter Trend Breakthrough Smart Moving Average Trading StrategyPine Script · Breakout · 1h
- Quantitative Trading Strategy Based on Ichimoku with Multiple SignalsPine Script · Breakout · 1h
- Multi Strategy Adaptive Trend Following and Breakout Trading SystemPine Script · Breakout · 1d