Strategy vault / Trend following
Multi Timeframe Moving Average Crossover Strategy
The Multi Timeframe Moving Average Crossover Strategy is an algorithmic trading strategy that utilizes moving average crossover signals between different timeframe periods to determine the trend direction. This…
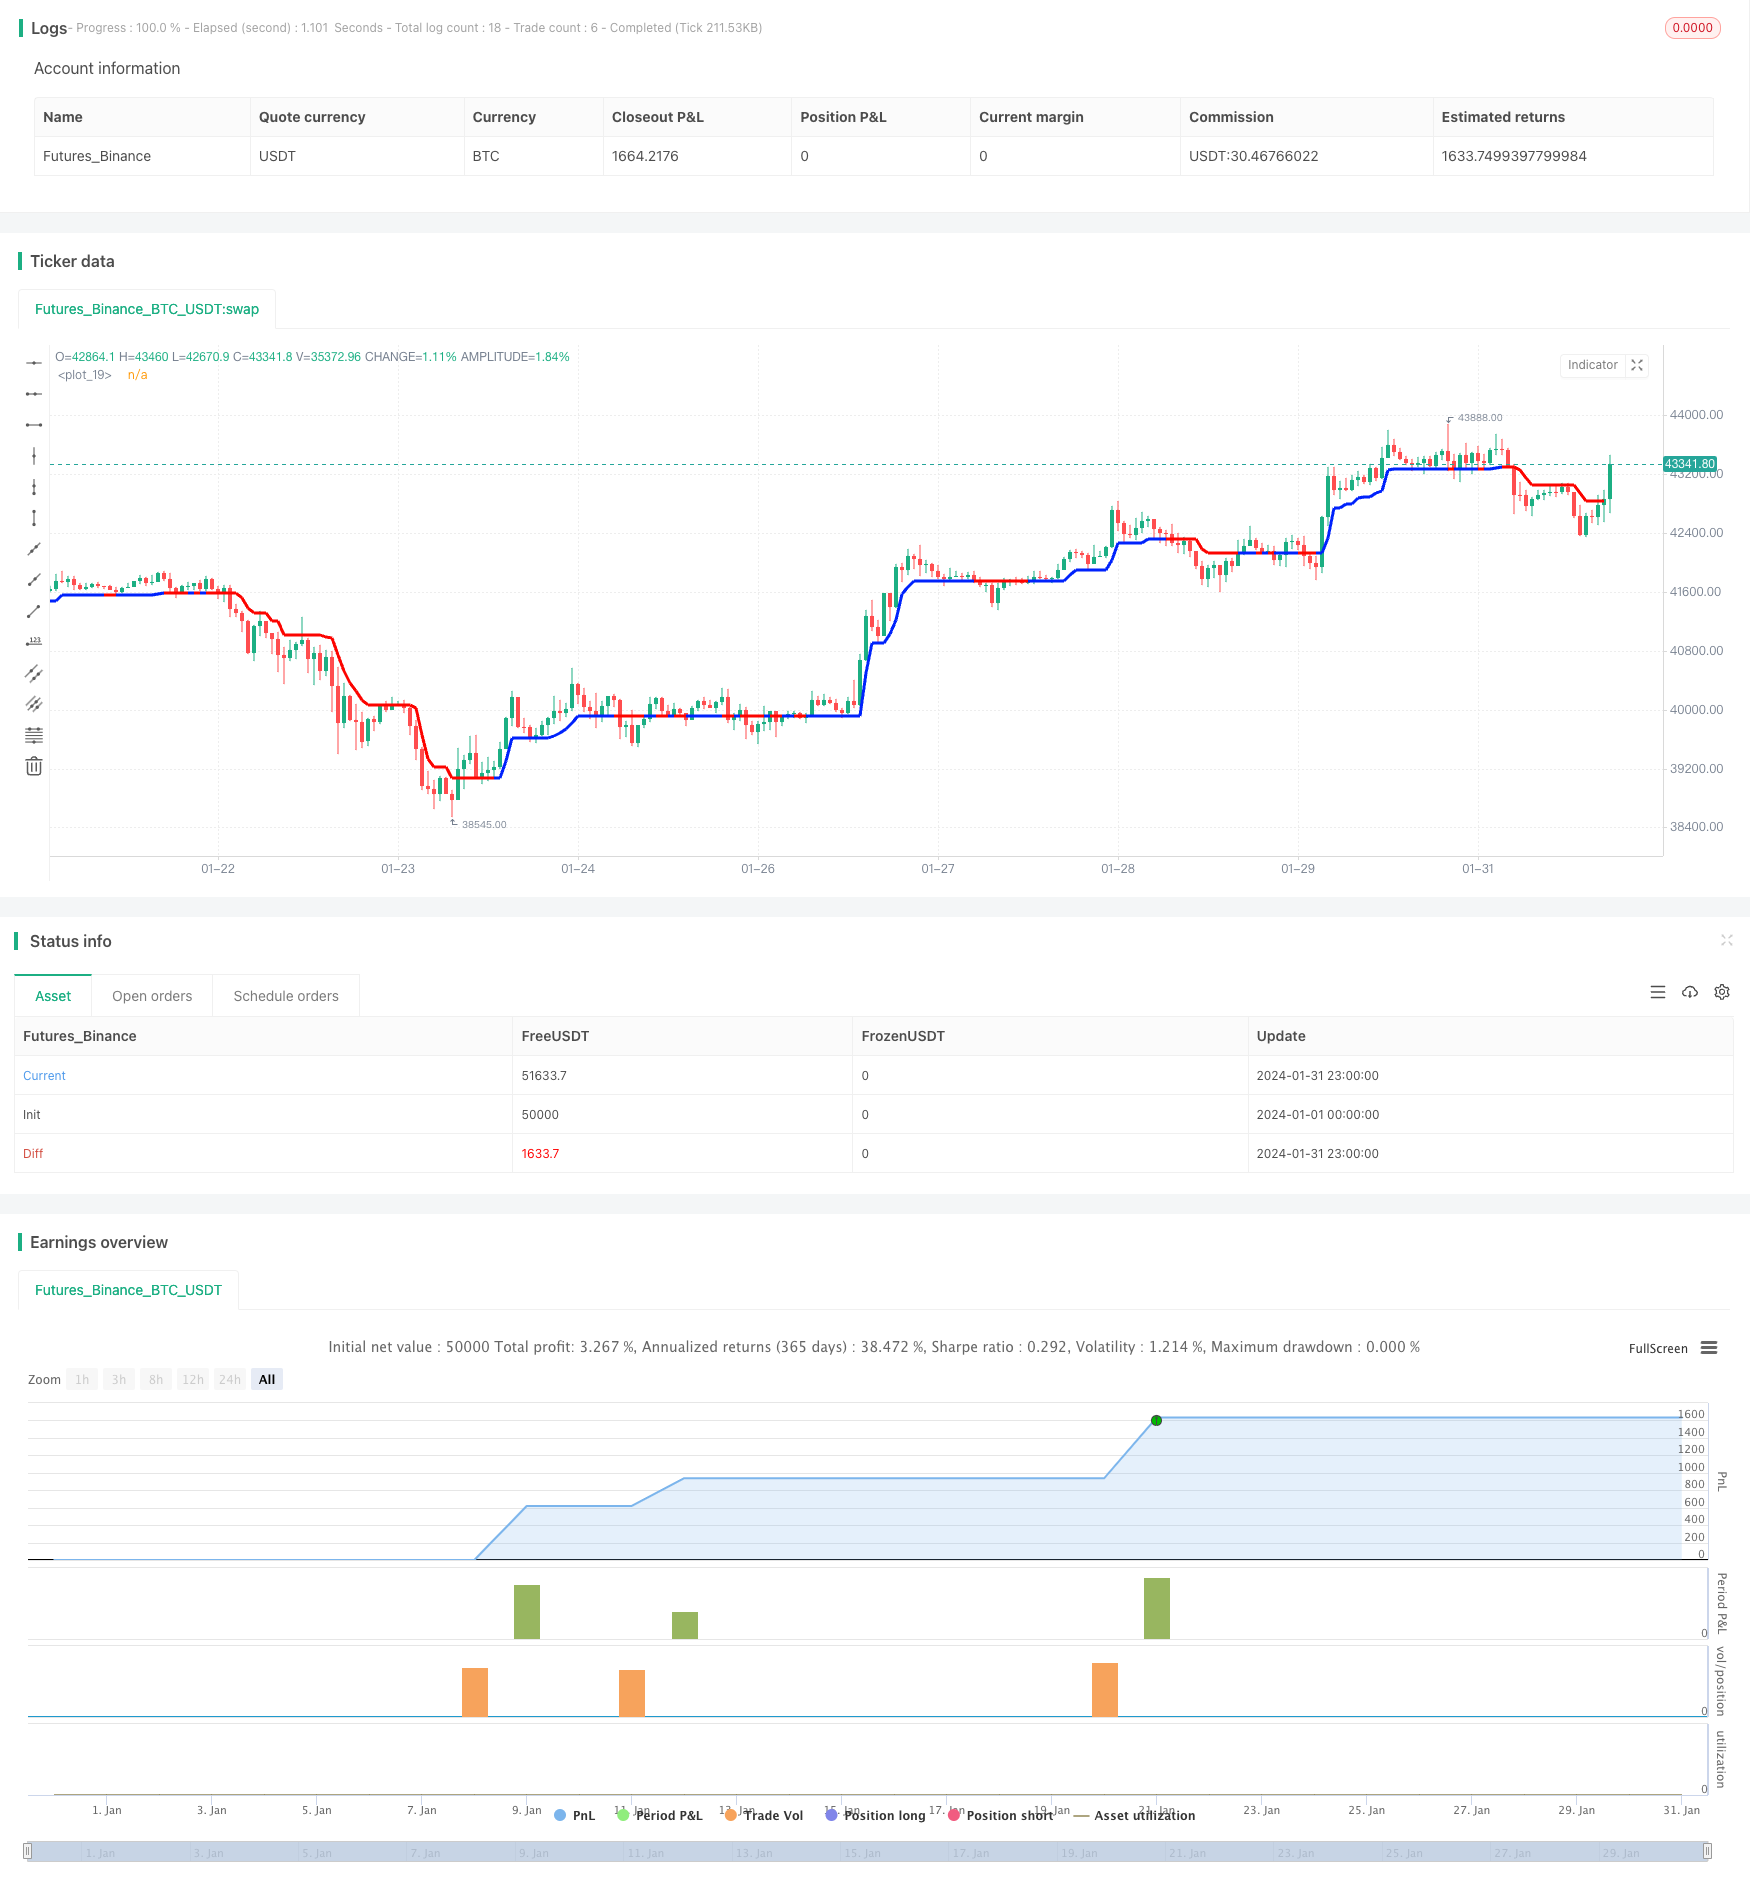
Overview
The Multi Timeframe Moving Average Crossover Strategy is an algorithmic trading strategy that utilizes moving average crossover signals between different timeframe periods to determine the trend direction. This strategy combines trend, momentum and volatility indicators to generate more reliable trading signals.
Strategy Logic
This strategy calculates the CCI indicator over different periods to determine the market trend direction, combined with MACD signals to locate golden crosses and death crosses, and finally uses the ATR indicator to set stop loss/take profit levels, in order to buy low and sell high.
Specifically, it first computes the 20-period CCI to judge bullish or bearish trends. Then it checks if MACD lines are crossing to identify trading signals. Next, ATR is used to generate trailing stops for locking in profits. Finally, all signals are consolidated to generate the entry and exit signals.
Advantages
Multiple indicators combo improves signal accuracy
The combination of CCI, MACD and ATR enhances the reliability of trading signals by collectively judging trend, momentum and volatility.
Multi-timeframe analysis captures market rhythm
Longer period CCI grasps overall trend, while higher frequency MACD locates local turning points, allowing the strategy to capitalize on big market swings.
ATR trailing stop controls risk effectively
The stop loss based on ATR can adapt to market volatility, while its trailing feature further locks in profits as the market moves favorably.
Risks
Limited optimization space
Most parameters have narrow fine-tuning space, reaching a performance bottleneck easily.
Increased computing load
Multiple indicators running together can increase the computing load, causing lags in high frequency trading.
Frequent signals, limited risk control
Signals can be frequent, while the risk control relies mainly on ATR trailing stop, which has limitations against extreme moves.
Enhancements
Apply machine learning for more efficient parameter tuning
Bayesian optimization, genetic algorithms etc can enable more intelligent and efficient parameter tuning.
Add functional indicators to improve adaptability
Incorporating other indicators like volatility, volume, sentiment can make the strategy more robust and flexible.
Strengthen risk management for better stability
More scientific stop loss rules can be designed, and further modules like position sizing can help safeguard against extreme events.
Conclusion
The Multi Timeframe Moving Average Crossover Strategy utilizes the powers of CCI, MACD and ATR to achieve reliable trend capturing and efficient risk control. It accounts for trend, momentum and volatility to generate accurate signals, grasp market rhythms and manage risk. Although some aspects like parameter tuning, computing load and risk control can be improved further, it is a solid algorithmic trading system nonetheless. With some enhancements using machine learning, more indicators and better risk management, its performance can reach new levels.
Parameters
| Name | Default | What it controls |
|---|---|---|
| v_input_string_1 | 0 | (?Strategy Entry Direction)Entry Direction: Long | Short | Both |
| v_input_float_1 | 0.5 | (?Strategy TP & SL)Take Profit (%) |
| v_input_float_2 | 0.5 | Stop Loss (%) |
| v_input_1 | 20 | (?TREND MAGIC)CCI period |
| v_input_2 | true | ATR Multiplier |
| v_input_3 | 5 | ATR Period |
| v_input_timeframe_1 | (?MACD)Indicator TimeFrame | |
| v_input_int_1 | 12 | Fast Length |
| v_input_int_2 | 26 | Slow Length |
| v_input_source_1_close | 0 | Source: close | high | low | open | hl2 | hlc3 | hlcc4 | ohlc4 |
| v_input_int_3 | 9 | Signal Smoothing |
| v_input_string_2 | 0 | Oscillator MA Type: EMA | SMA |
| v_input_string_3 | 0 | Signal Line MA Type: EMA | SMA |
| v_input_bool_1 | false | (?UT BOT)Show UT Bot Labels |
| v_input_float_3 | 2 | Key Vaule. 'This changes the sensitivity' |
| v_input_4 | 7 | ATR Period |
Source Pine Script
/*backtest
start: 2024-01-01 00:00:00
end: 2024-01-31 23:59:59
period: 1h
basePeriod: 15m
exchanges: [{"eid":"Futures_Binance","currency":"BTC_USDT"}]
*/

//@version=5
strategy('smplondonclinic Strategy', shorttitle='SMPLC Strategy', overlay=true, pyramiding = 0, process_orders_on_close = true, default_qty_type = strategy.percent_of_equity, default_qty_value = 100)

direction   = input.string(title='Entry Direction', defval='Long', options=['Long', 'Short', 'Both'],group = "Strategy Entry Direction")

TPPerc = input.float(title='Take Profit (%)', minval=0.0, step=0.1, defval=0.5, group='Strategy TP & SL')
SLPerc = input.float(title='Stop Loss (%)', minval=0.0, step=0.1, defval=0.5, group='Strategy TP & SL')

period = input(20, 'CCI period',group = "TREND MAGIC")
coeff = input(1, 'ATR Multiplier',group = "TREND MAGIC")
AP = input(5, 'ATR Period',group = "TREND MAGIC")
ATR = ta.sma(ta.tr, AP)
srctm = close
upT = low - ATR * coeff
downT = high + ATR * coeff
MagicTrend = 0.0
MagicTrend := ta.cci(srctm, period) >= 0 ? upT < nz(MagicTrend[1]) ? nz(MagicTrend[1]) : upT : downT > nz(MagicTrend[1]) ? nz(MagicTrend[1]) : downT
color1 = ta.cci(srctm, period) >= 0 ? #0022FC : #FC0400
plot(MagicTrend, color=color1, linewidth=3)
tmb = ta.cci(srctm, period) >= 0 and close>MagicTrend
tms = ta.cci(srctm, period) <= 0 and close<MagicTrend

//MACD

res           = input.timeframe("",  "Indicator TimeFrame", group = "MACD")
fast_length   = input.int(title="Fast Length", defval=12, group = "MACD")
slow_length   = input.int(title="Slow Length", defval=26, group = "MACD")
src           = input.source(title="Source", defval=close, group = "MACD")
signal_length = input.int(title="Signal Smoothing", minval = 1, maxval = 999, defval = 9, group = "MACD")
sma_source    = input.string(title="Oscillator MA Type", defval="EMA", options=["SMA", "EMA"], group = "MACD")
sma_signal    = input.string(title="Signal Line MA Type", defval="EMA", options=["SMA", "EMA"], group = "MACD")

fast_ma = request.security(syminfo.tickerid, res, sma_source == "SMA" ? ta.sma(src, fast_length) : ta.ema(src, fast_length))
slow_ma = request.security(syminfo.tickerid, res, sma_source == "SMA" ? ta.sma(src, slow_length) : ta.ema(src, slow_length))
macd = fast_ma - slow_ma
signal = request.security(syminfo.tickerid, res, sma_signal == "SMA" ? ta.sma(macd, signal_length) : ta.ema(macd, signal_length))
hist = macd - signal

trend_up   = macd > signal
trend_dn   = macd < signal
cross_UP   = signal[1] >= macd[1] and signal < macd
cross_DN   = signal[1] <= macd[1] and signal > macd
cross_UP_A = (signal[1] >= macd[1] and signal < macd) and macd > 0
cross_DN_B = (signal[1] <= macd[1] and signal > macd) and macd < 0


//UT Bot

srcut = close
showut = input.bool(false, 'Show UT Bot Labels', group = "UT BOT")
keyvalue = input.float(2, title='Key Vaule. \'This changes the sensitivity\'', step=.5, group = "UT BOT")
atrperiod = input(7, title='ATR Period', group = "UT BOT")
xATR = ta.atr(atrperiod)
nLoss = keyvalue * xATR

xATRTrailingStop = 0.0
iff_1 = srcut > nz(xATRTrailingStop[1], 0) ? srcut - nLoss : srcut + nLoss
iff_2 = srcut < nz(xATRTrailingStop[1], 0) and srcut[1] < nz(xATRTrailingStop[1], 0) ? math.min(nz(xATRTrailingStop[1]), srcut + nLoss) : iff_1
xATRTrailingStop := srcut > nz(xATRTrailingStop[1], 0) and srcut[1] > nz(xATRTrailingStop[1], 0) ? math.max(nz(xATRTrailingStop[1]), srcut - nLoss) : iff_2

pos = 0
iff_3 = srcut[1] > nz(xATRTrailingStop[1], 0) and srcut < nz(xATRTrailingStop[1], 0) ? -1 : nz(pos[1], 0)
pos := srcut[1] < nz(xATRTrailingStop[1], 0) and srcut > nz(xATRTrailingStop[1], 0) ? 1 : iff_3

xcolor = pos == -1 ? color.red : pos == 1 ? color.green : color.blue

//plot(xATR, color=xcolor, title='Trailing Stop')
buy = ta.crossover(srcut, xATRTrailingStop)
sell = ta.crossunder(srcut, xATRTrailingStop)
barcolor = srcut > xATRTrailingStop

plotshape(showut ? buy:na, title='Buy', text='Buy', style=shape.labelup, location=location.belowbar, color=color.new(color.green, 0), textcolor=color.new(color.white, 0), size=size.tiny)
plotshape(showut ? sell:na, title='Sell', text='Sell', style=shape.labeldown, color=color.new(color.red, 0), textcolor=color.new(color.white, 0), size=size.tiny)

//barcolor(barcolor ? color.green : color.red)

goLong = buy and tmb and cross_UP
goShort = sell and tms and cross_DN

plotshape(goLong, location=location.bottom, style=shape.triangleup, color=color.lime, size=size.small)
plotshape(goShort, location=location.top, style=shape.triangledown, color=color.red, size=size.small)

percentAsPoints(pcnt) =>
    strategy.position_size != 0 ? math.round(pcnt / 100.0 * strategy.position_avg_price / syminfo.mintick) : float(na)

percentAsPrice(pcnt) =>
    strategy.position_size != 0 ? (pcnt / 100.0 + 1.0) * strategy.position_avg_price : float(na)

current_position_size = math.abs(strategy.position_size)
initial_position_size = math.abs(ta.valuewhen(strategy.position_size[1] == 0.0, strategy.position_size, 0))

TP = strategy.position_avg_price + percentAsPoints(TPPerc) * syminfo.mintick * strategy.position_size / math.abs(strategy.position_size)
SL = strategy.position_avg_price - percentAsPoints(SLPerc) * syminfo.mintick * strategy.position_size / math.abs(strategy.position_size)

var long = false
var short = false

if direction == 'Long'
    long := goLong
    short := false

if direction == 'Short'
    short := goShort
    long := false

if direction == 'Both'
    long := goLong
    short := goShort

if long and strategy.opentrades == 0
    strategy.entry(id='Long', direction=strategy.long)

if short and strategy.opentrades == 0
    strategy.entry(id='Short', direction=strategy.short)

if strategy.position_size > 0

    strategy.exit('TPSL', from_entry='Long', qty=initial_position_size, limit=TP, stop=SL)

if strategy.position_size < 0

    strategy.exit('TPSL2', from_entry='Short', qty=initial_position_size, limit=TP, stop=SL)
Published by ChaoZhang on the FMZ strategy square · last modified 2024-02-19. Collected in the Quant Trading Vault. Unvalidated research: re-test with your own data and costs before trusting it.
Build this with AgenKit
A spec is not a trading system. Paste this into your coding agent and AgenKit runs a specialist team — architecture, test-first build, risk gates, review — with paper trading on by default.
/agenkit build a production-grade trading bot with a backtest engine, risk controls and paper trading by default from strategies/Multi-Timeframe-Moving-Average-Crossover-Strategy.md- npx agenkit install engineering-kit in your project
- Paste the command into your agent and approve each phase
- Get tests, backtest, risk controls and a paper-trading switch
Understand it first
Before you run this, read the lesson behind the idea and how to backtest it honestly. Specs like this one are the survivors of an unknown number of trials; deflate their results accordingly.
Related specs
- Supertrend Advance StrategyPine Script · Trend following · 5m
- Price Divergence Based Trend Trading StrategyPine Script · Trend following · 2h
- SuperTrend Trading Strategy with Multiple FiltersPine Script · Trend following · 1h
- Bollinger Bands and RSI Trend Following StrategyPine Script · Trend following · 1h
- Dual ATR Channel Trend Following StrategyPine Script · Trend following · 15m
- Dual MA Crossover Trend Tracking StrategyPine Script · Trend following · 1h