Strategy vault / Trend following
Multi Timeframe Trend Tracking Strategy
This strategy combines moving averages, MACD and RSI across multiple timeframes to identify trend directions and trade S&P500 index trends.
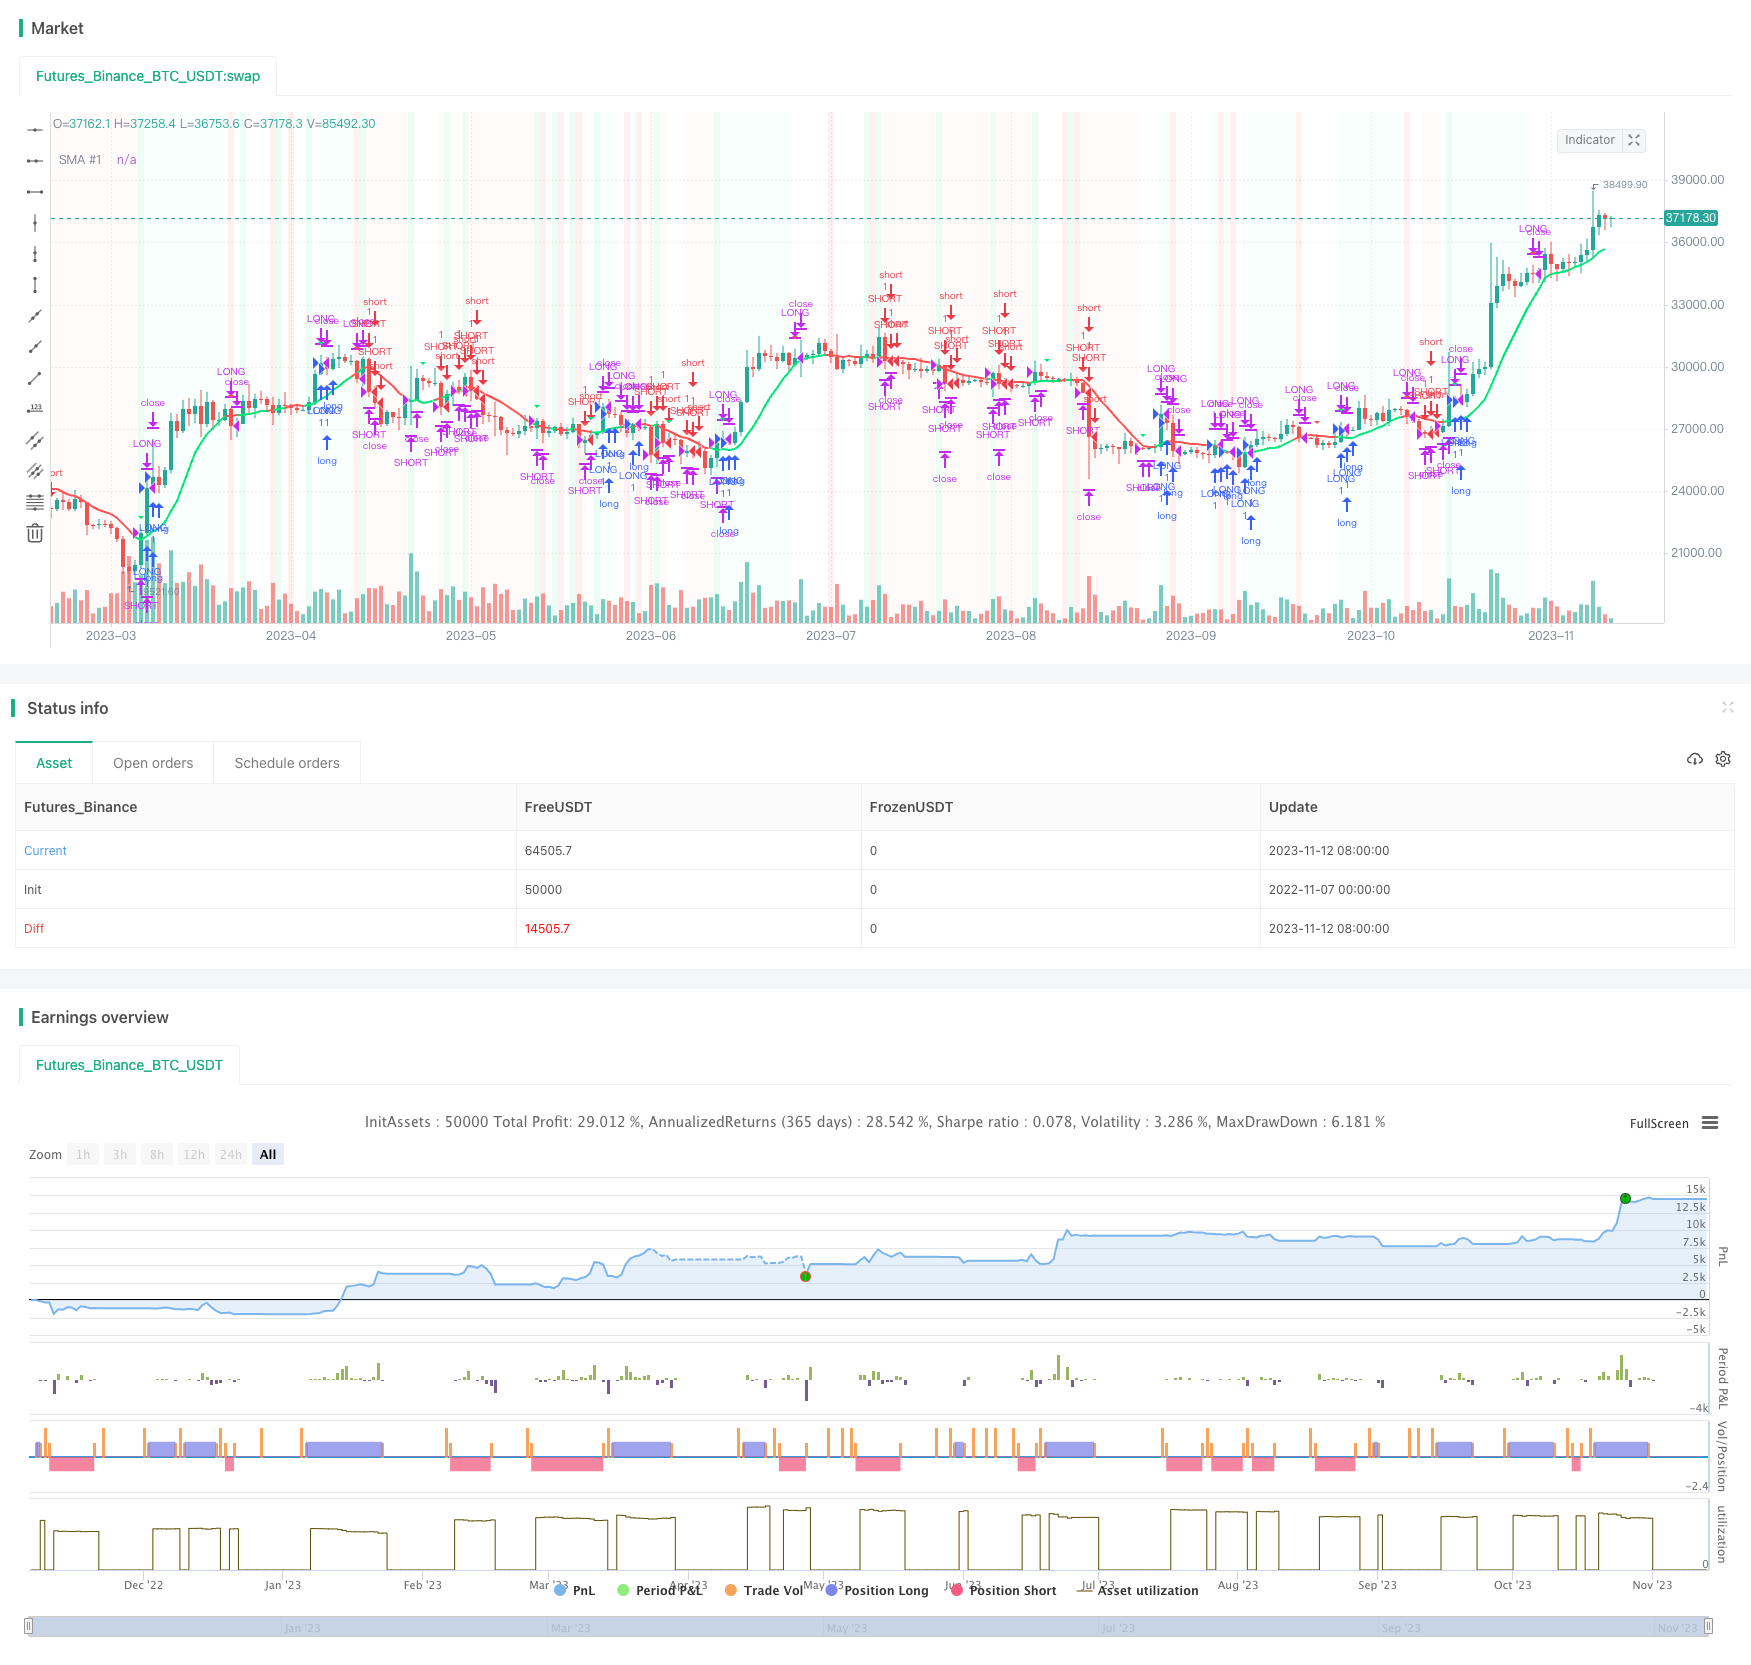
Overview
This strategy combines moving averages, MACD and RSI across multiple timeframes to identify trend directions and trade S&P500 index trends.
Strategy Logic
10-day simple moving average judges price trend. Price crossing above 10-day MA indicates upside, and crossing below indicates downside.
MACD judges momentum strength. It calculates difference between 12 and 21-day exponential moving averages, and crossover between the MACD line and signal line generates trading signals. MACD line crossing above signal line indicates upside, and crossing below indicates downside.
14-day RSI and its 50-day MA are calculated. RSI crossing above its MA is bullish signal, and crossing below is bearish signal.
1-min, 3-min and 5-min timeframes confirm trend consistency.
When price crosses above 10-day MA, RSI crosses above its MA, and MACD line crosses above signal line, buy signal is generated. When price crosses below 10-day MA, RSI crosses below its MA, and MACD line crosses below signal line, sell signal is generated.
Advantages
Combining indicators improves signal accuracy. 10-day MA judges main trend, MACD determines momentum strength, and RSI confirms overbought/oversold levels. Indicator combo verifies each other and reduces incorrect trades.
Multiple timeframe confirmation avoids market noise. Dual confirmation across 1-min, 3-min and 5-min timeframes ensures concurrent signal appearance and filters out false signals.
Chart pattern assist visual judgment for reliability. Graphical pattern analysis avoids extreme overbought/oversold levels and reduces loss risks.
Medium trading frequency suits index trading. 10-day MA as primary indicator prevents excessive trading, avoiding extra transaction costs from overtrading.
Risks
Failure to detect abrupt reversal in irrational events. Such market turmoil disrupts model and should reduce position sizing for risk control.
Fixed parameter settings without accounting for changing market conditions. Parameters should be dynamically adjusted for different market regimes in live trading.
Overly idealized entry points with execution difficulty in practice. Entry signals should be fine-tuned with slippage to improve executable liquidity.
Multiple timeframes increase signal delay. Proper risk control is required to minimize losses from delay during sudden events.
Enhancement
Incorporate stop loss mechanisms like trailing stop loss and percentage stop loss to control single trade loss.
Optimize dynamic parameter settings to adapt to evolving markets and improve strategy robustness.
Consider market regime changes from significant events to avoid model shocks.
Account for trading costs like slippage and adjust entry/exit points for better execution.
Test different price inputs like candlestick as signal confirmation to diversify multi timeframe validation.
Utilize machine learning algorithms on big data to automate strategy optimization.
Conclusion
This strategy trades S&P500 trends effectively through trend identification with multiple indicators and signal confirmation across timeframes. Its strengths lie in high signal accuracy and noise resilience, but risk control and dynamic parameter tuning are required. As an optimization over simple moving average strategies, it provides valuable inspirations and references for quantitative trading strategy enhancement.
Parameters
| Name | Default | What it controls |
|---|---|---|
| v_input_1_close | 0 | SMA Source #1: close | high | low | open | hl2 | hlc3 | hlcc4 | ohlc4 |
| v_input_2 | true | RSI |
Source Pine Script
/*backtest
start: 2022-11-07 00:00:00
end: 2023-11-13 00:00:00
period: 1d
basePeriod: 1h
exchanges: [{"eid":"Futures_Binance","currency":"BTC_USDT"}]
*/

// This source code is subject to the terms of the Mozilla Public License 2.0 at https://mozilla.org/MPL/2.0/
// USE HEIEN ASHI, 1 min, SPX 500 USD OANDA
// © connor2279
//@version=5
strategy(title="SPX Strategy", shorttitle="SPXS", overlay=true)

//SMA
len1 = 10
src1 = input(close, title="SMA Source #1")
out1 = ta.sma(src1, len1)
plot(out1, title="SMA #1", color=close >= out1 ? color.lime : color.red, linewidth=2)

data_over = ta.crossover(close, out1)
dataO = close >= out1
data_under = ta.crossunder(close, out1)
dataU = close < out1

bgcolor(color=ta.crossover(close, out1) ? color.new(color.lime, 90) : na)
bgcolor(color=ta.crossunder(close, out1) ? color.new(color.red, 90) : na)

//Norm MacD
sma = 12
lma = 21
tsp = 10
np = 50

sh = ta.ema(close,sma)

lon= ta.ema(close,lma)

ratio = math.min(sh,lon)/math.max(sh,lon)

Mac = ratio - 1
if(sh>lon)
    Mac := 2-ratio - 1
else
    Mac := ratio - 1

MacNorm = ((Mac-ta.lowest(Mac, np)) /(ta.highest(Mac, np)-ta.lowest(Mac, np)+.000001)*2)- 1

MacNorm2 = MacNorm

if(np<2)
    MacNorm2 := Mac
else
    MacNorm2 := MacNorm

Trigger = ta.wma(MacNorm2, tsp)

trigger_above = Trigger >= MacNorm
trigger_under = Trigger < MacNorm
plotshape(ta.crossover(Trigger, MacNorm2), style=shape.triangledown, color=color.red)
plotshape(ta.crossunder(Trigger, MacNorm2), style=shape.triangledown, color=color.lime)

//RSI / SMA RSI
swr=input(true,title="RSI")
src = close
len = 14
srs = 50
up = ta.rma(math.max(ta.change(src), 0), len)
down = ta.rma(-math.min(ta.change(src), 0), len)
rsi = down == 0 ? 100 : up == 0 ? 0 : 100 - (100 / (1 + up / down))
mr = ta.sma(rsi,srs)
rsi_above = rsi >= mr
rsi_under = rsi < mr

//All
buySignal = rsi_above and trigger_under and dataO
shortSignal = rsi_under and trigger_above and dataU
bgcolor(color=buySignal ? color.new(color.lime,97) : na)
bgcolor(color=shortSignal ? color.new(color.red, 97) : na)

sellSignal = ta.cross(close, out1) or ta.cross(Trigger, MacNorm2) or ta.cross(rsi, mr)
if (buySignal)
    strategy.entry("LONG", strategy.long, 1)

if (shortSignal)
    strategy.entry("SHORT", strategy.short, 1)

// Submit exit orders
strategy.close("LONG", when=sellSignal)
strategy.close("SHORT", when=sellSignal)Published by ChaoZhang on the FMZ strategy square · last modified 2023-11-14. Collected in the Quant Trading Vault. Unvalidated research: re-test with your own data and costs before trusting it.
Build this with AgenKit
A spec is not a trading system. Paste this into your coding agent and AgenKit runs a specialist team — architecture, test-first build, risk gates, review — with paper trading on by default.
/agenkit build a production-grade trading bot with a backtest engine, risk controls and paper trading by default from strategies/Multi-Timeframe-Trend-Tracking-Strategy.md- npx agenkit install engineering-kit in your project
- Paste the command into your agent and approve each phase
- Get tests, backtest, risk controls and a paper-trading switch
Understand it first
Before you run this, read the lesson behind the idea and how to backtest it honestly. Specs like this one are the survivors of an unknown number of trials; deflate their results accordingly.
Related specs
- Bollinger Bands and RSI Trend Following StrategyPine Script · Trend following · 1h
- Dual ATR Channel Trend Following StrategyPine Script · Trend following · 15m
- Dynamic Dual EMA Crossover Strategy with Adaptive Profit Loss ControlPine Script · Trend following · 1d
- EMA SMA Multi Indicator Comprehensive Trend Following StrategyPine Script · Trend following · 1h
- EMA and RSI Trend Trading StrategyPine Script · Trend following · 1d
- Fixed Range Volume Profile And Anchored VWAP Trend Identification Strategy With Dynamic Stop LossPine Script · Trend following · 1h