multiple technical indicators Momentum Breakout Strategy
This strategy considers multiple technical indicators comprehensively and takes long position when the market is judged to have strong bullish momentum. Specifically, this strategy takes into account MACD, RSI, ADX…
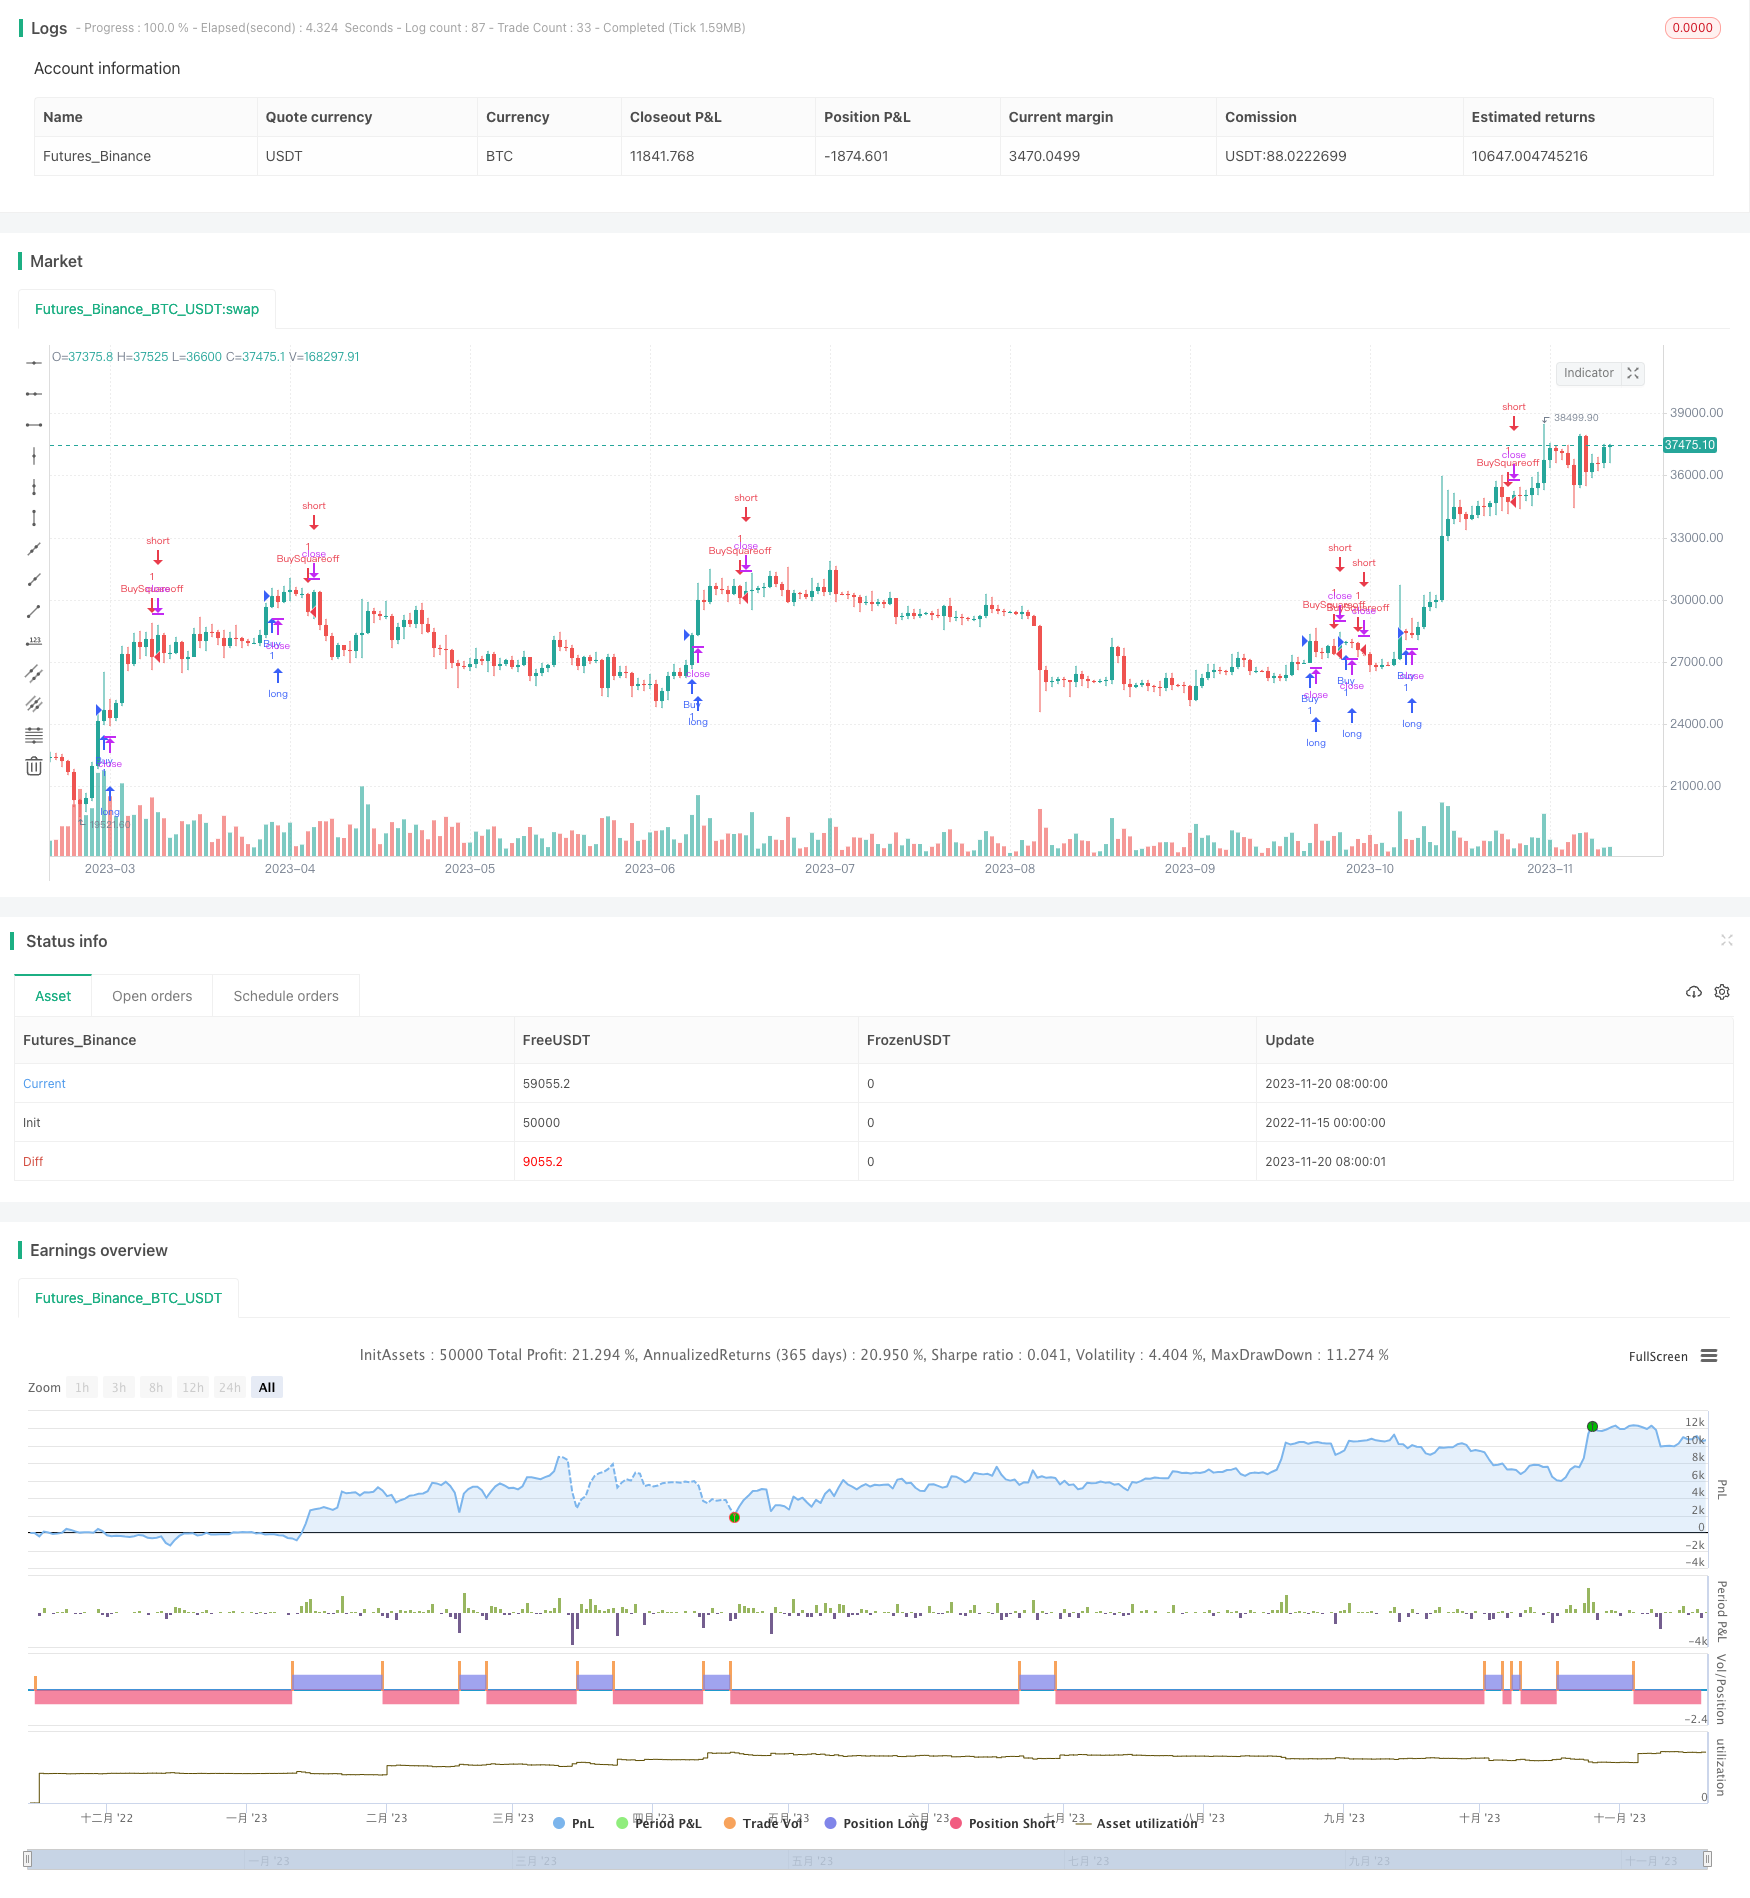
Overview
This strategy considers multiple technical indicators comprehensively and takes long position when the market is judged to have strong bullish momentum. Specifically, this strategy takes into account MACD, RSI, ADX, Stochastic and Bollinger Band these 5 indicators. It generates buy signals when all these indicators meet bullish criteria simultaneously.
Strategy Logic
The core logic of this strategy is to buy when the market is determined to have strong bullish momentum. The specific judging rules are as follows:
- The current MACD bars of 5-minute, 15-minute and 60-minute charts are rising.
- RSI is greater than 60
- ADX is greater than 12
- Stochastic %K crosses over %D
- Bollinger Band upper band rises
When all the 5 conditions above are met, the market is considered to have strong bullish momentum. At this time, a long position will be taken.
The exit rule is to close current position when 5-minute closing price breaks below 5-minute EMA.
Advantage Analysis
The advantages of this strategy include:
- Combining multiple indicators prevents being misguided by a single one
- Using indicators across timeframes judges sustainability of bullish momentum
- Strict exit mechanism prevents enlarged losses
- Appropriate trading frequency without over-trading
In general, this strategy has accurate judgement, proper risk control and is suitable to capture short-term bullish trends.
Risk Analysis
This strategy also has some risks:
- Combining multiple indicators increases probability of wrong entry
- Exit mechanism may be too strict, causing premature exit from right trades
- High trading frequency increases burden of commission fees
In summary, the main risks of this strategy lies in wrong entry and premature exit. These need to be alleviated through parameter tuning and rule adjustment.
Optimization Directions
This strategy can be optimized in the following aspects:
- Optimize MACD parameters to find combinations better fitting the market
- Adjust RSI parameters to locate better overbought/oversold zones
- Optimize Stochastic parameters for better crossovers
- Tune Bollinger Band parameters for better reflection of market volatility
- Optimize or replace exit rules to reduce premature exits
Through parameter and rule optimization, this strategy's profitability and risk control ability can be further improved.
Conclusion
This strategy judges bullish trend by combining multiple indicators with relatively strict exits. It has accurate judgement, able to capture short-term trends and proper risk control. Continuous optimization over parameters and trading rules can further enhance the strategy. In summary, this is a practical strategy with strong usability.
Parameters
| Name | Default | What it controls |
|---|---|---|
| v_input_1 | 14 | Stochastic Length |
| v_input_2 | 3 | %K Smoothing |
| v_input_3 | 3 | %D Smoothing |
Source Pine Script
/*backtest
start: 2022-11-15 00:00:00
end: 2023-11-21 00:00:00
period: 1d
basePeriod: 1h
exchanges: [{"eid":"Futures_Binance","currency":"BTC_USDT"}]
*/

// This source code is subject to the terms of the Mozilla Public License 2.0 at https://mozilla.org/MPL/2.0/
// © makarandpatil

// This strategy is for Bank Nifty instrument and for intraday purpose only
// It checks for various indicators and gives a buy signal when all conditions are met
// Bank Nifty when in momentum gives 100-200 points in spot in 5-15 min which is how long the trade duration should be
// Issues - The custom script as per TradingView Pinescripting has an issue of repaint
// More information on repainting issue in this link - https://www.tradingview.com/pine-script-docs/en/v5/concepts/Repainting.html
// Use the script alert only to get notified, however check all the parameters individually before taking the trade
// Also, please perform a backtesting and deep backtesting of this strategy to see if the strategy gave correct buy signals in the past
// The script is made for testing purposes only and is in beta mode. Please use at own risk.

//@version=5
strategy("BankNifty_Bullish_Intraday", overlay=true, margin_long = 100, margin_short = 100)

// Variables
StochLength = input(14, title="Stochastic Length")
smoothK = input(3, title="%K Smoothing")
smoothD = input(3, title="%D Smoothing")


//INDICATOR CALCULATIONS

// 1. MACD
[macdLine, signalLine, histLine] = ta.macd(close[0],12,26,9)

macd5 = request.security(syminfo.tickerid, "5", macdLine)
macd15 = request.security(syminfo.tickerid,"15",macdLine)
macd60 = request.security(syminfo.tickerid,"60",macdLine)

// 2. RSI Calculation
xRSI = ta.rsi(close, 14)

// 3. ADX calculation
[diplus, diminus, adx] = ta.dmi(14,14)
// plot(adx,color = color.black)

// 4. Stochastic Calculation
k = ta.sma(ta.stoch(close, high, low, StochLength), smoothK)
d = ta.sma(k, smoothD)

// 5. Bollinger Band calculation
[middle, upper, lower] = ta.bb(close, 20, 2)


//CONDITIONS

// 1. Conditions for MACD
macd5Uptick = macd5[0] > macd5[1]
macd15Uptick = macd15[0] > macd15[1]
macd60Uptick = macd60[0] >= macd60[1]

// 2. Condition for xRSI
RSIStrong = xRSI > 60

// 3. Condition for ADX
ADXUngali = adx >= 12

// 4. Condition for Stochastic
StochPCO = k > d

// 5. Condition for Bollinger Band
BBCU = upper > upper [1]

//Evaluate the long condition
// longCondition = macd5Uptick and macd15Uptick and RSIStrong and ADXUngali and StochPCO and BBCU
longCondition = macd5Uptick and macd15Uptick and macd60Uptick and RSIStrong and ADXUngali and StochPCO and BBCU
// longCondition = macd5Uptick and macd15Uptick and RSIStrong and ADXUngali and StochPCO and BBCU

if (longCondition)
    strategy.entry("Buy", strategy.long,alert_message = "BankNifty_Buy_Momentum")

shortCondition = close < ta.ema(close,5)
if (shortCondition)
    strategy.entry("BuySquareoff", strategy.short, alert_message = "BankNifty_Closed_Below_5EMA")
Published by ChaoZhang on the FMZ strategy square · last modified 2023-11-22. Collected in the Quant Trading Vault. Unvalidated research: re-test with your own data and costs before trusting it.
Build this with AgenKit
A spec is not a trading system. Paste this into your coding agent and AgenKit runs a specialist team — architecture, test-first build, risk gates, review — with paper trading on by default.
/agenkit build a production-grade trading bot with a backtest engine, risk controls and paper trading by default from strategies/multiple-technical-indicators-Momentum-Breakout-Strategy.md- npx agenkit install engineering-kit in your project
- Paste the command into your agent and approve each phase
- Get tests, backtest, risk controls and a paper-trading switch
Understand it first
Before you run this, read the lesson behind the idea and how to backtest it honestly. Specs like this one are the survivors of an unknown number of trials; deflate their results accordingly.
Related specs
- MACD Bollinger Turtle Trading StrategyPine Script · Breakout · 1d
- Momentum Breakout Trading Strategy 440964Pine Script · Breakout · 5m
- Moving Average Crossover and Upper Rail Breakthrough Impulse StrategyPine Script · Breakout · 1m
- Momentum Breakout Intraday Trading StrategyPine Script · Breakout · 5m
- Bull Market Tracking SystemPine Script · Breakout · 1h
- Momentum Breakout Moving Average StrategyPine Script · Breakout · 1d