Strategy vault / Machine learning
Multiplicative Moving Average Dual direction Trading Strategy
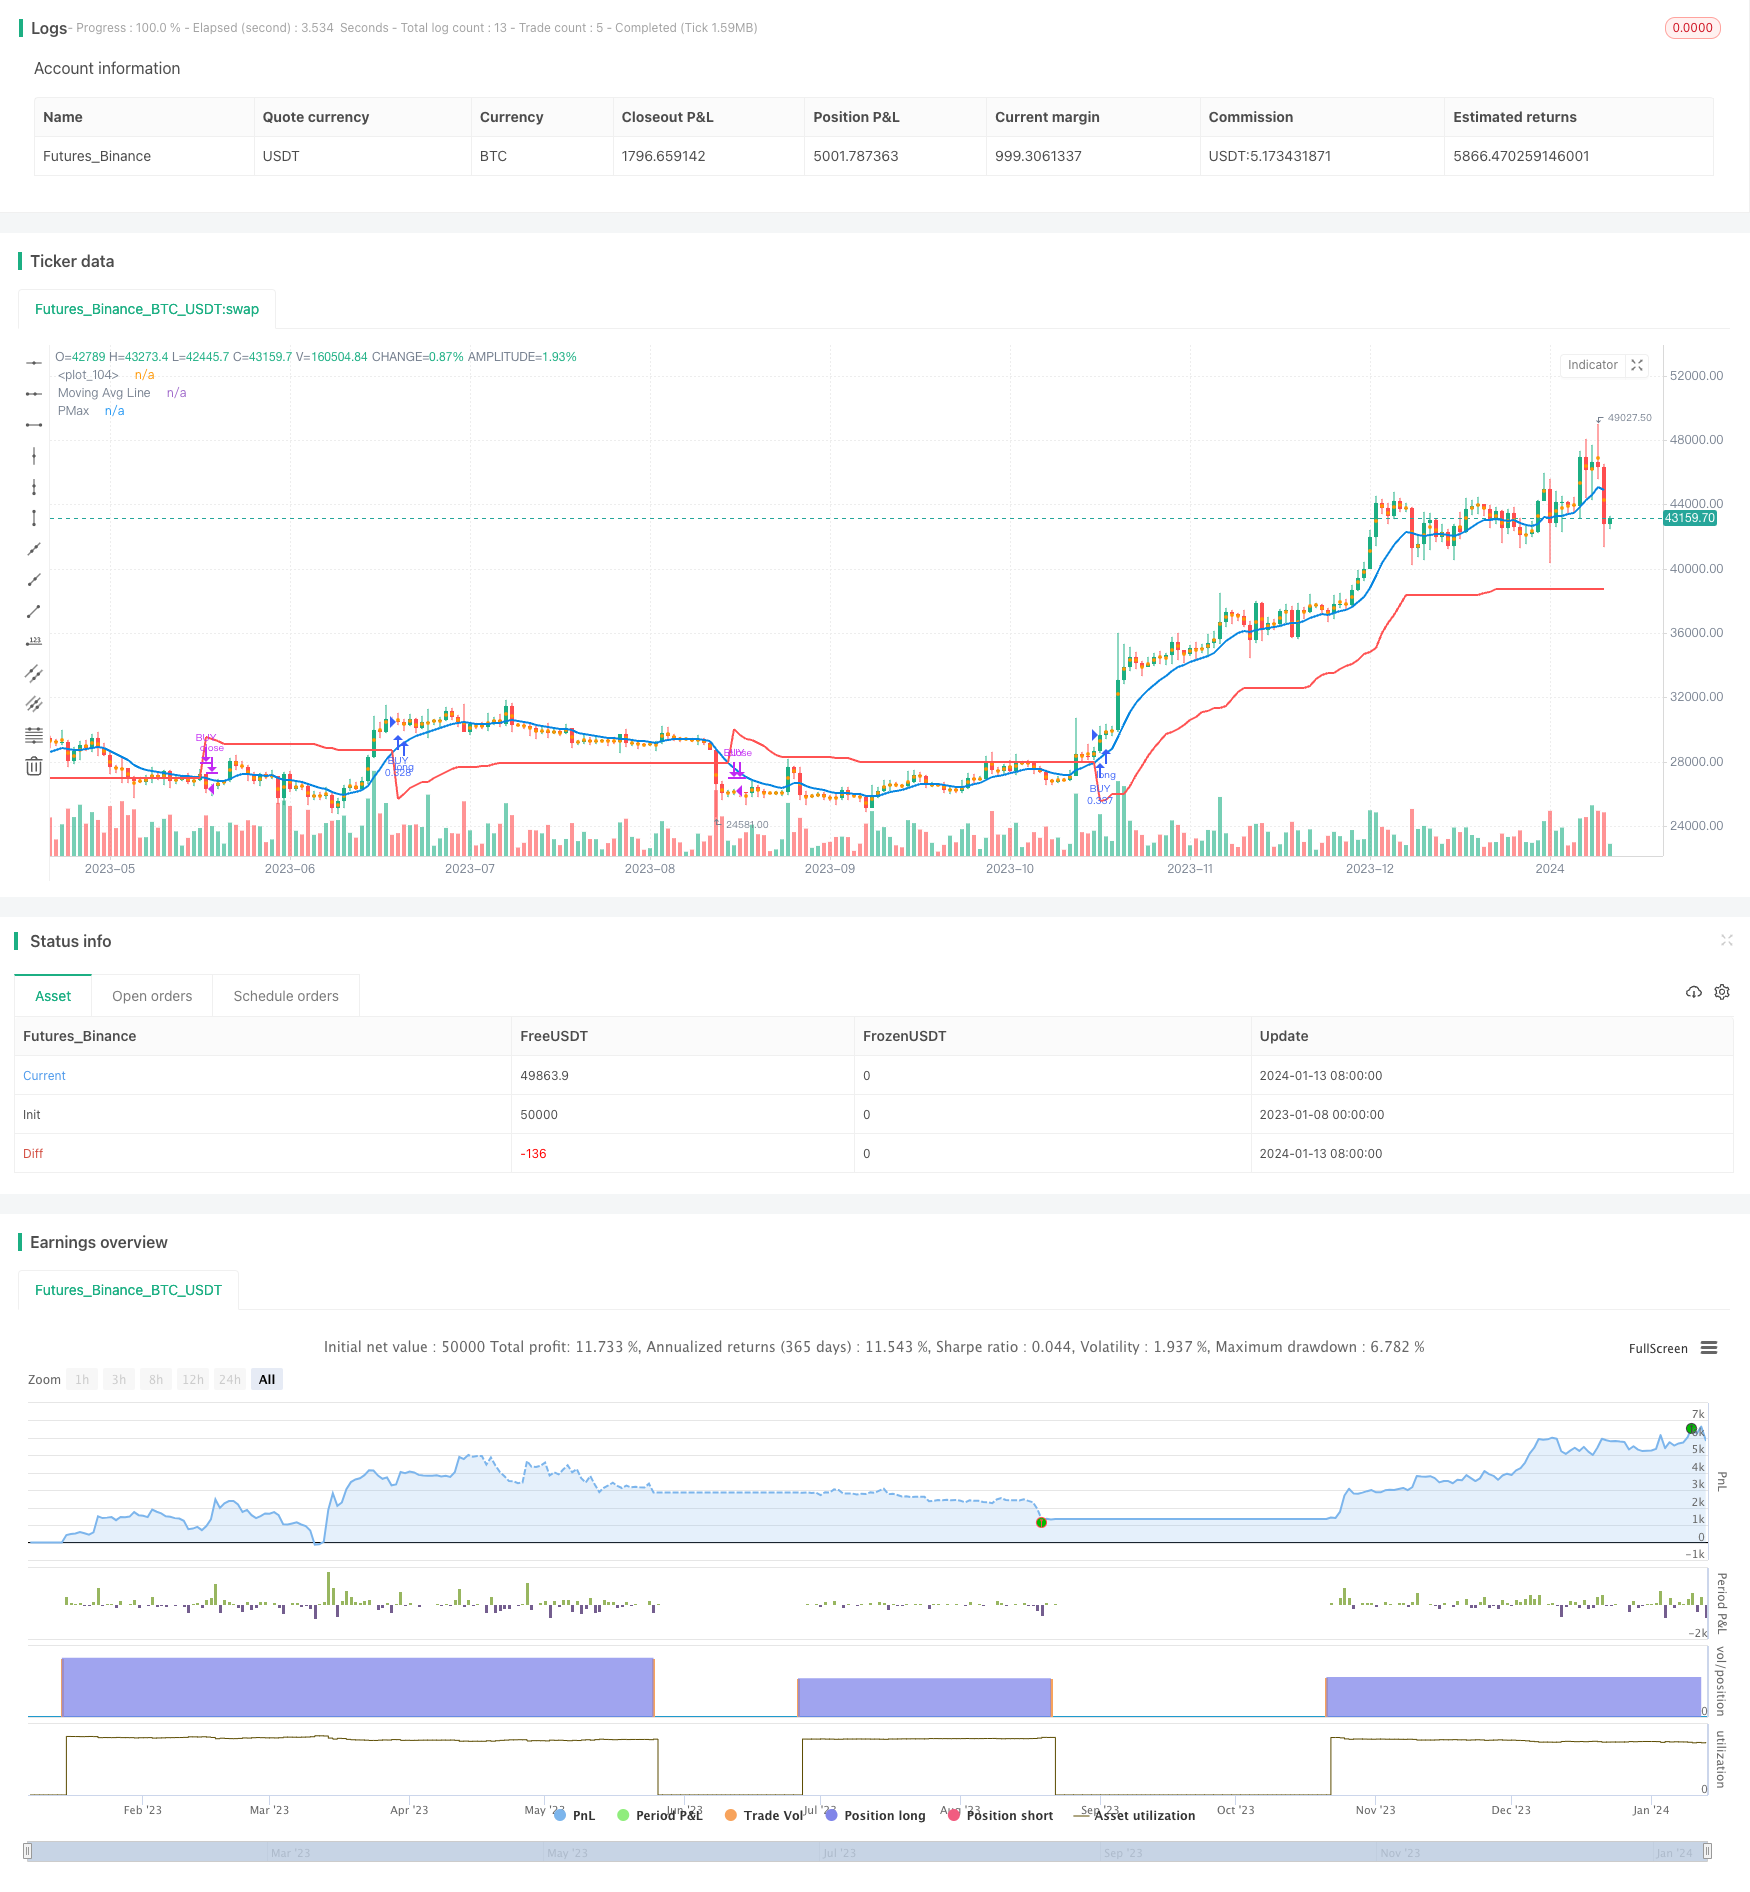
This strategy calculates the multiplicative moving average line and combines the crossings of price and PMax indicator to determine the trend direction. It adopts dual-direction trading to long when trend goes up and…
Overview
This strategy calculates the multiplicative moving average line and combines the crossings of price and PMax indicator to determine the trend direction. It adopts dual-direction trading to long when trend goes up and short when trend goes down, evaluating position risk in real time to exit with profit.
Strategy Principle
The core indicator of this strategy is the multiplicative moving average line. Indicator parameters include: ATR period, ATR multiplier, moving average type and length. The ATR value represents volatility over the period. The multiplicative moving average line equals average price plus/minus the product of ATR multiplier and ATR over the period. When price is above the line there is a long signal. When price is below the line there is a short signal.
The PMax indicator represents stop loss or take profit price. It is calculated from ATR value and trend direction. In uptrend, PMax equals moving average minus ATR multiplier times ATR, acting as a stop loss line. In downtrend, PMax equals moving average plus ATR multiplier times ATR, acting as a take profit line.
When price crosses PMax indicator upwards there is a long signal. When price crosses PMax indicator downwards there is a short signal. The strategy enters and exits based on the signals, going long in uptrend and short in downtrend, with dynamic trailing stop loss and take profit.
Advantage Analysis
The advantages of this strategy:
Adopting dual-direction trading makes it highly inclusive of all market conditions.
Applying multiplicative moving average produces stable and reliable trading signals.
With PMax for stop loss/take profit, it effectively controls risk.
The adjustable cycle and multiplier parameters make it highly adaptable.
Risk Analysis
There are also some risks:
Improper parameter settings may lead to whipsaw losses.
Pay attention to leverage limits when shorting.
Black swan events are hard to avoid.
Solutions:
Optimize parameters to reduce whipsaws.
Control leverage prudently and diversify.
Increase ATR multiplier to widen stop range.
Optimization Directions
The strategy can be upgraded in ways like:
Test stability across different markets and cycles.
Apply machine learning to auto optimize parameters.
Judge market regimes with deep learning techniques.
Integrate more data sources to empower decisions.
Summary
The overall performance of this strategy is stable with strong inclusiveness. By adopting dual-direction trade and dynamic stop loss/take profit, it effectively controls risks. Through parameter tuning and model iteration, strategy fitness and efficacy can be further improved. In general this is a strategy worth long-term attention and application.
Parameters
| Name | Default | What it controls |
|---|---|---|
| v_input_1_hl2 | 0 | Source: hl2 | high | low | open | close | hlc3 | hlcc4 | ohlc4 |
| v_input_2 | 10 | ATR Length |
| v_input_3 | 3 | ATR Multiplier |
| v_input_4 | 0 | Moving Average Type: EMA | SMA | WMA | TMA | VAR | WWMA | ZLEMA | TSF |
| v_input_5 | 10 | Moving Average Length |
| v_input_6 | 0 | Signal Type: Only Crossing Signals | Only Price/Pmax Crossing Signals |
| v_input_7 | true | Change ATR Calculation Method ? |
| v_input_8 | true | Show Moving Average? |
| v_input_9 | true | Highlighter On/Off ? |
| v_input_10 | false | Long-Short |
Source Pine Script
/*backtest
start: 2023-01-08 00:00:00
end: 2024-01-14 00:00:00
period: 1d
basePeriod: 1h
exchanges: [{"eid":"Futures_Binance","currency":"BTC_USDT"}]
*/

// This source code is subject to the terms of the Mozilla Public License 2.0 at https://mozilla.org/MPL/2.0/
// © melihtuna
//developer: @KivancOzbilgic
//author: @KivancOzbilgic
//stretegy converter: @crypto_melih
//@version=4

strategy("Profit Maximizer Strategy Long-Short", shorttitle="PMax-Strategy", overlay=true, default_qty_type=strategy.cash, default_qty_value=10000, initial_capital=10000, currency=currency.USD, commission_value=0, commission_type=strategy.commission.percent)

src = input(hl2, title="Source")
Periods = input(title="ATR Length", type=input.integer, defval=10)
Multiplier = input(title="ATR Multiplier", type=input.float, step=0.1, defval=3.0)
mav = input(title="Moving Average Type", defval="EMA", options=["SMA", "EMA", "WMA", "TMA", "VAR", "WWMA", "ZLEMA", "TSF"])
length =input(10, "Moving Average Length", minval=1)
condition = input(title="Signal Type", defval="Only Crossing Signals", options=["Only Crossing Signals", "Only Price/Pmax Crossing Signals"])
changeATR= input(title="Change ATR Calculation Method ?", type=input.bool, defval=true)
showsupport = input(title="Show Moving Average?", type=input.bool, defval=true)
//showsignalsk = input(title="Show Crossing Signals?", type=input.bool, defval=true)
//showsignalsc = input(title="Show Price/Pmax Crossing Signals?", type=input.bool, defval=false)
highlighting = input(title="Highlighter On/Off ?", type=input.bool, defval=true)
long_short = input(defval = false, title = "Long-Short", type=input.bool)
atr2 = sma(tr, Periods)
atr= changeATR ? atr(Periods) : atr2
valpha=2/(length+1)
vud1=src>src[1] ? src-src[1] : 0
vdd1=src<src[1] ? src[1]-src : 0
vUD=sum(vud1,9)
vDD=sum(vdd1,9)
vCMO=nz((vUD-vDD)/(vUD+vDD))
VAR=0.0
VAR:=nz(valpha*abs(vCMO)*src)+(1-valpha*abs(vCMO))*nz(VAR[1])
wwalpha = 1/ length
WWMA = 0.0
WWMA := wwalpha*src + (1-wwalpha)*nz(WWMA[1])
zxLag = length/2==round(length/2) ? length/2 : (length - 1) / 2
zxEMAData = (src + (src - src[zxLag]))
ZLEMA = ema(zxEMAData, length)
lrc = linreg(src, length, 0)
lrc1 = linreg(src,length,1)
lrs = (lrc-lrc1)
TSF = linreg(src, length, 0)+lrs
getMA(src, length) =>
    ma = 0.0
    if mav == "SMA"
        ma := sma(src, length)
        ma

    if mav == "EMA"
        ma := ema(src, length)
        ma

    if mav == "WMA"
        ma := wma(src, length)
        ma

    if mav == "TMA"
        ma := sma(sma(src, ceil(length / 2)), floor(length / 2) + 1)
        ma

    if mav == "VAR"
        ma := VAR
        ma

    if mav == "WWMA"
        ma := WWMA
        ma

    if mav == "ZLEMA"
        ma := ZLEMA
        ma

    if mav == "TSF"
        ma := TSF
        ma
    ma

MAvg=getMA(src, length)
longStop = MAvg - Multiplier*atr
longStopPrev = nz(longStop[1], longStop)
longStop := MAvg > longStopPrev ? max(longStop, longStopPrev) : longStop
shortStop = MAvg + Multiplier*atr
shortStopPrev = nz(shortStop[1], shortStop)
shortStop := MAvg < shortStopPrev ? min(shortStop, shortStopPrev) : shortStop
dir = 1
dir := nz(dir[1], dir)
dir := dir == -1 and MAvg > shortStopPrev ? 1 : dir == 1 and MAvg < longStopPrev ? -1 : dir
PMax = dir==1 ? longStop: shortStop
plot(showsupport ? MAvg : na, color=#0585E1, linewidth=2, title="Moving Avg Line")
pALL=plot(PMax, color=color.red, linewidth=2, title="PMax", transp=0)
alertcondition(cross(MAvg, PMax), title="Cross Alert", message="PMax - Moving Avg Crossing!")
alertcondition(crossover(MAvg, PMax), title="Crossover Alarm", message="Moving Avg BUY SIGNAL!")
alertcondition(crossunder(MAvg, PMax), title="Crossunder Alarm", message="Moving Avg SELL SIGNAL!")
alertcondition(cross(src, PMax), title="Price Cross Alert", message="PMax - Price Crossing!")
alertcondition(crossover(src, PMax), title="Price Crossover Alarm", message="PRICE OVER PMax - BUY SIGNAL!")
alertcondition(crossunder(src, PMax), title="Price Crossunder Alarm", message="PRICE UNDER PMax - SELL SIGNAL!")
buySignalk = crossover(MAvg, PMax)
//plotshape(buySignalk and showsignalsk ? PMax*0.995 : na, title="Buy", text="Buy", location=location.absolute, style=shape.labelup, size=size.tiny, color=color.green, textcolor=color.white, transp=0)
sellSignallk = crossunder(MAvg, PMax)
//plotshape(sellSignallk and showsignalsk ? PMax*1.005 : na, title="Sell", text="Sell", location=location.absolute, style=shape.labeldown, size=size.tiny, color=color.red, textcolor=color.white, transp=0)
buySignalc = crossover(src, PMax)
//plotshape(buySignalc and showsignalsc ? PMax*0.995 : na, title="Buy", text="Buy", location=location.absolute, style=shape.labelup, size=size.tiny, color=#0F18BF, textcolor=color.white, transp=0)
sellSignallc = crossunder(src, PMax)
//plotshape(sellSignallc and showsignalsc ? PMax*1.005 : na, title="Sell", text="Sell", location=location.absolute, style=shape.labeldown, size=size.tiny, color=#0F18BF, textcolor=color.white, transp=0)
mPlot = plot(ohlc4, title="", style=plot.style_circles, linewidth=0,display=display.none)
longFillColor = highlighting ? (MAvg>PMax ? color.green : na) : na
shortFillColor = highlighting ? (MAvg<PMax ? color.red : na) : na
fill(mPlot, pALL, title="UpTrend Highligter", color=longFillColor)
fill(mPlot, pALL, title="DownTrend Highligter", color=shortFillColor)

if(condition=="Only Crossing Signals")
    strategy.entry("BUY", strategy.long, when = buySignalk)
else
    strategy.entry("BUY", strategy.long, when = buySignalc)

if(long_short)
    if(condition=="Only Crossing Signals")
        strategy.entry("SELL", strategy.short, when = sellSignallk)
    else
        strategy.entry("SELL", strategy.short, when = sellSignallc)
else
    if(condition=="Only Crossing Signals")
        strategy.close("BUY", when = sellSignallk)
    else
        strategy.close("BUY", when = sellSignallc)
Published by ChaoZhang on the FMZ strategy square · last modified 2024-01-15. Collected in the Quant Trading Vault. Unvalidated research: re-test with your own data and costs before trusting it.
Build this with AgenKit
A spec is not a trading system. Paste this into your coding agent and AgenKit runs a specialist team — architecture, test-first build, risk gates, review — with paper trading on by default.
/agenkit build a production-grade trading bot with a backtest engine, risk controls and paper trading by default from strategies/Multiplicative-Moving-Average-Dual-direction-Trading-Strategy.md- npx agenkit install engineering-kit in your project
- Paste the command into your agent and approve each phase
- Get tests, backtest, risk controls and a paper-trading switch
Understand it first
Before you run this, read the lesson behind the idea and how to backtest it honestly. Specs like this one are the survivors of an unknown number of trials; deflate their results accordingly.
Related specs
- AI Driven Dynamic Volatility Adaptive Trend Breakout Trading StrategyPine Script · Machine learning · 2d
- Dual Moving Average Matching Strategy Based on Bollinger BandsPine Script · Machine learning · 1h
- Multi Indicator Dynamic Adaptive Quantitative Trading StrategyPine Script · Machine learning · 1h
- kNN based Trend Following StrategyPine Script · Machine learning · 1h
- Dual Indicator Stochastic RSI and EMA Trading StrategyPine Script · Machine learning · 1d
- High Low Cryptocurrency Strategy Based on Multiple IndicatorsPine Script · Machine learning · 45m