Strategy vault / Trend following
MyQuant Trend Identifier Strategy
MyQuant Trend Identifier Strategy is a strategy for daily Bitcoin trading. It identifies market trends by calculating the moving average and its first and second order derivatives of the price, and makes buy and sell…
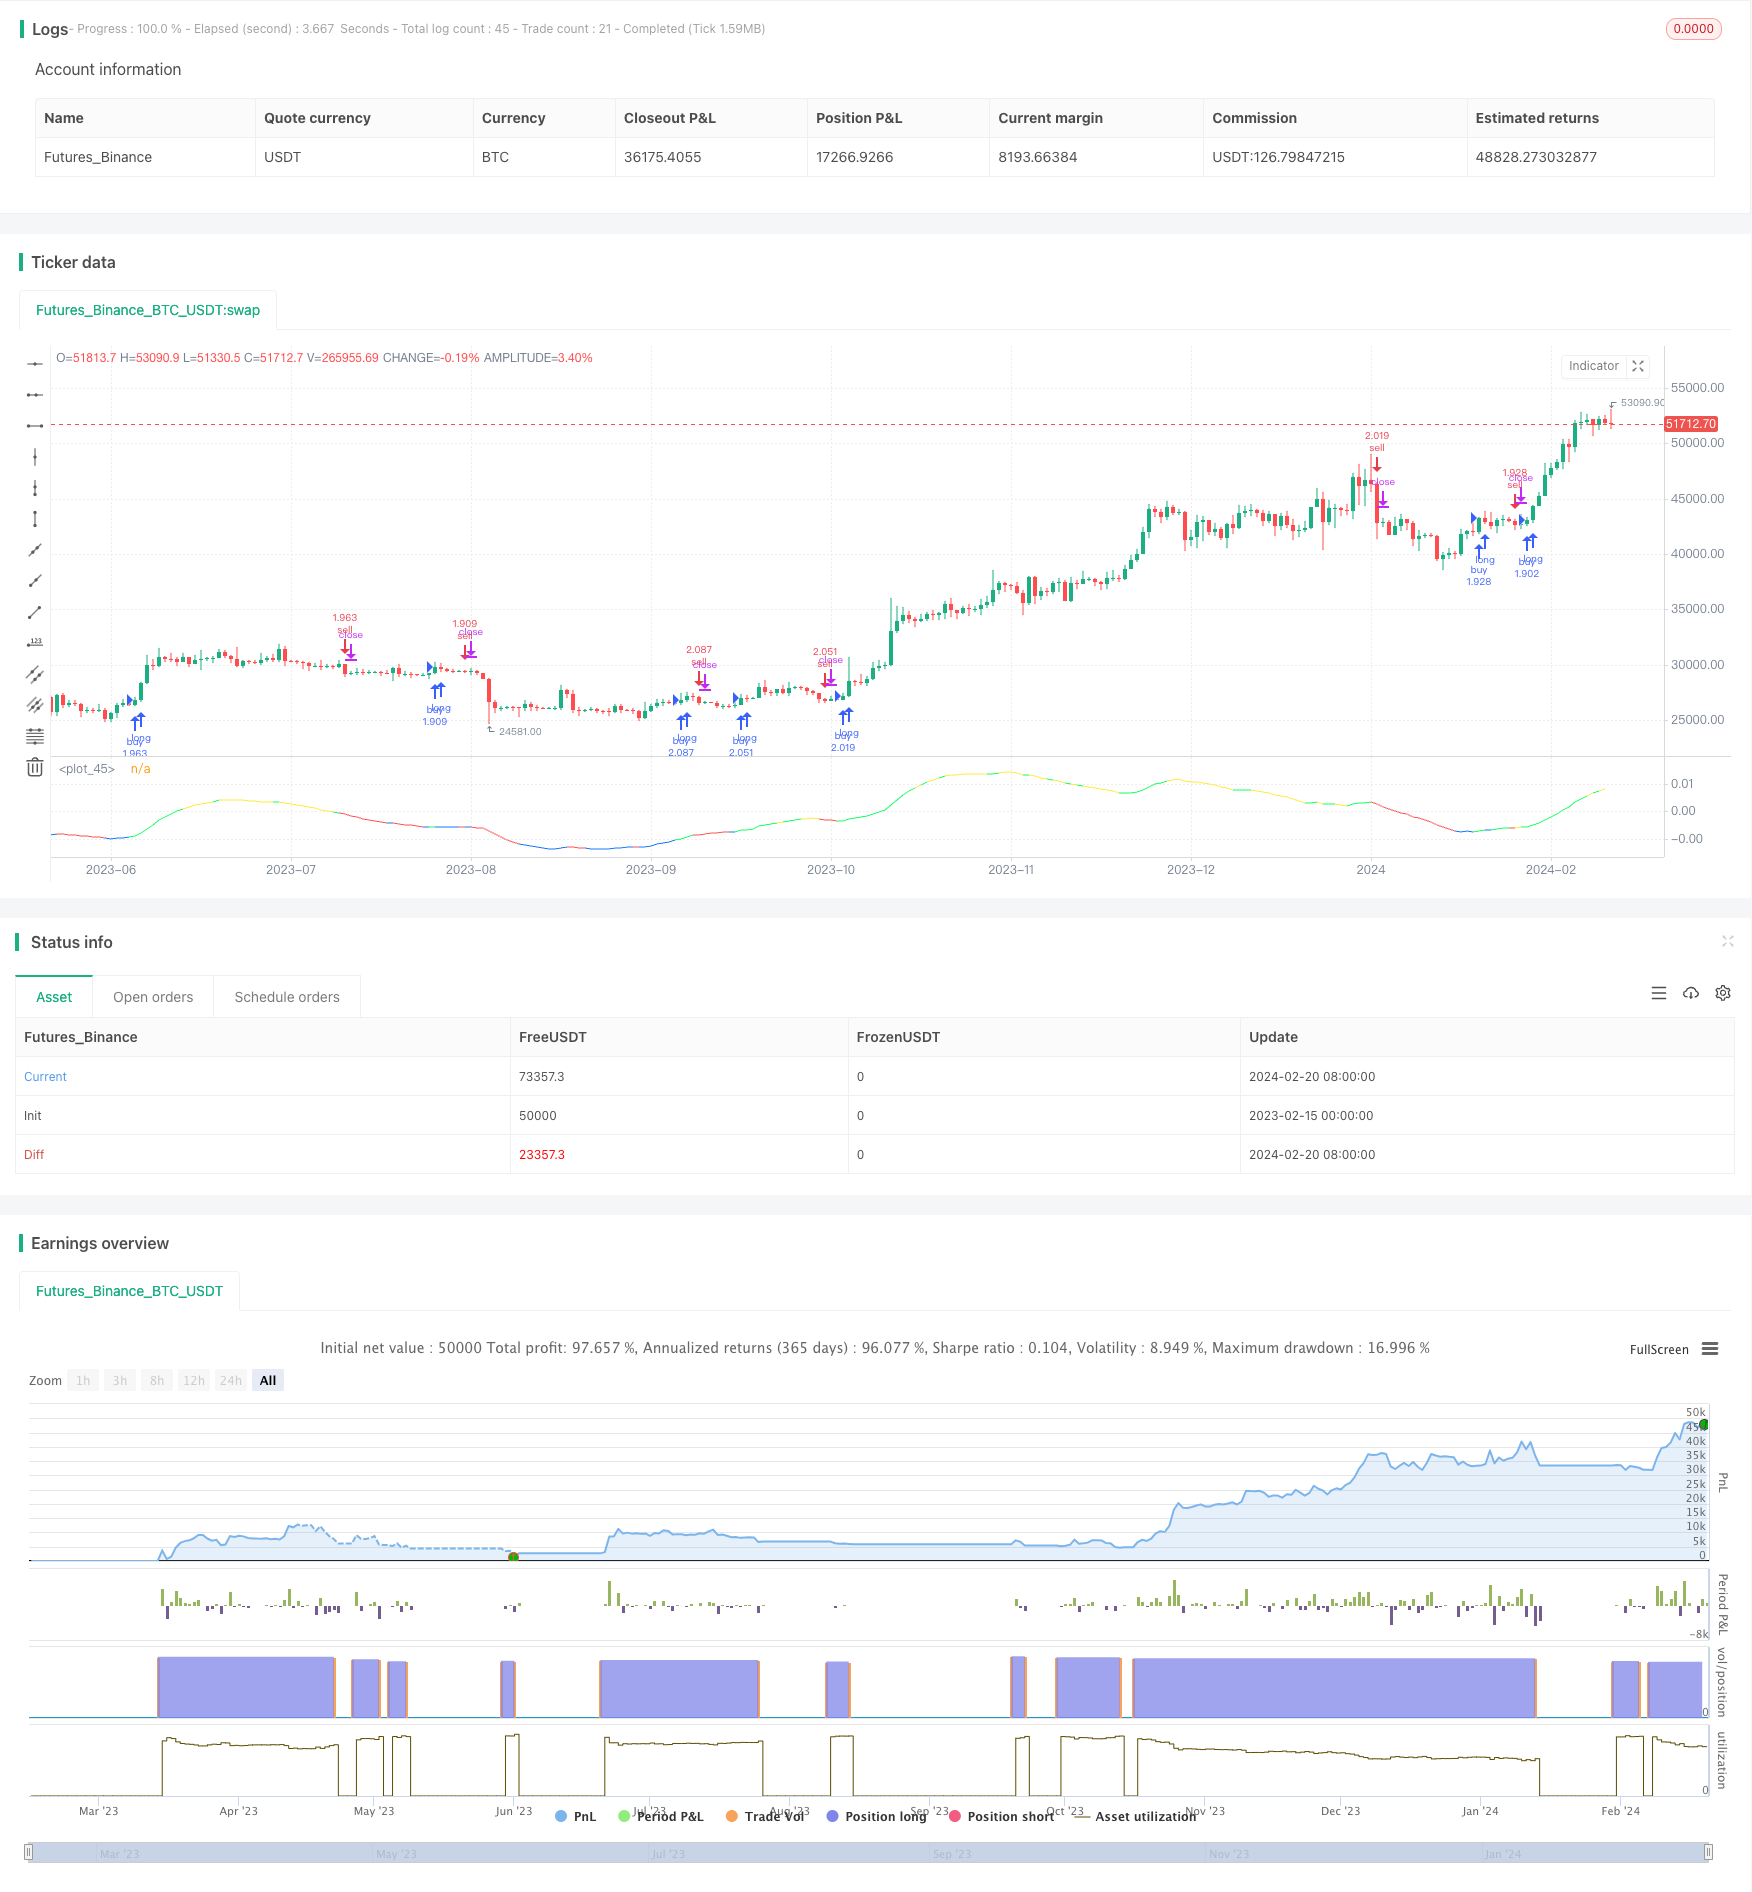
Overview
MyQuant Trend Identifier Strategy is a strategy for daily Bitcoin trading. It identifies market trends by calculating the moving average and its first and second order derivatives of the price, and makes buy and sell decisions accordingly.
Strategy Principle
The strategy first calculates the Adaptive Moving Average (ALMA) of the price and its first order and second order derivatives. The first order derivative reflects the rate of change of the price, and the second order derivative reflects the curvature of the price. It then judges the current trend to be upward, downward or fluctuating based on the values of the first and second order derivatives. Combined with stock indicators, it determines whether the buy or sell conditions are met.
Specifically, the strategy calculates the following indicators:
- ALMA: Adaptive Moving Average of the price, length 140, fast factor 1.1, sigma 6
- dema: First order derivative of ALMA
- d2ema: First order derivative of dema, reflecting second order derivative of the price
- index: Oscillation index of the dema indicator
- ind: Deviation index of the price from its moving average
When the buy condition is met, it calculates the number of shares to buy based on the signals from CAUSED Accumulation/Distribution Bands and Caused Exposure Top and Bottom Finder. When the sell condition is met, it sells all current positions.
Advantages of the Strategy
By combining trend and indicator judgments, this strategy can effectively identify turning points in market trends. Using the first and second order derivatives of prices to determine trends avoids the impact of price fluctuations and makes signals clearer. Compared to common moving average strategies, it has advantages such as higher accuracy.
Risk Analysis
This strategy is very sensitive to the selection of the trading time period and parameter adjustments. If the time period is selected improperly and important price turning points are not covered, the strategy will not be very effective. If the indicator parameters are set improperly, the buy and sell signals will be more affected by noise, thus impacting strategy returns. In addition, the stop loss conditions preset in the strategy also affect final returns.
Directions for Optimization
The strategy can be further optimized in the following aspects:
- Optimize logic for selecting time periods, through smarter selection of backtest and live trading time periods.
- Optimize indicator parameters, such as adjusting length of ALMA and dema etc.
- Add stop loss condition judgments to control maximum losses.
- Evaluate the effects across different cryptocurrencies and pick the ones that perform the best.
Conclusion
By calculating the first and second order derivatives of the adaptive moving average of prices, the MyQuant Trend Identifier Strategy effectively identifies the market trends for Bitcoin and makes corresponding buy and sell decisions. By combining multiple indicators for judgment, it avoids excessive noise interference with the signals. With further optimization of time and parameters, the performance of this strategy can be further improved.
Parameters
| Name | Default | What it controls |
|---|---|---|
| v_input_int_1 | 2020 | start year |
| v_input_int_2 | true | start month |
| v_input_int_3 | true | start day |
| v_input_int_4 | 2025 | end year |
| v_input_int_5 | true | end month |
| v_input_int_6 | true | end day |
| v_input_1 | false | Choose Time Interval |
Source Pine Script
/*backtest
start: 2023-02-15 00:00:00
end: 2024-02-21 00:00:00
period: 1d
basePeriod: 1h
exchanges: [{"eid":"Futures_Binance","currency":"BTC_USDT"}]
*/

// This source code is subject to the terms of the Mozilla Public License 2.0 at https://mozilla.org/MPL/2.0/
// © spacekadet17
//
//@version=5

strategy(title="Trend Identifier Strategy", shorttitle="Trend Identifier Strategy", format=format.price, precision=4, overlay = false, initial_capital = 1000, pyramiding = 10, default_qty_type = strategy.percent_of_equity, default_qty_value = 100, commission_type = strategy.commission.percent, commission_value = 0.03)

//start-end time
startyear = input.int(2020,"start year")
startmonth = input.int(1,"start month")
startday = input.int(1,"start day")
endyear = input.int(2025,"end year")
endmonth = input.int(1,"end month")
endday = input.int(1,"end day")

timeEnd = time <= timestamp(syminfo.timezone,endyear,endmonth,endday,0,0)
timeStart = time >= timestamp(syminfo.timezone,startyear,startmonth,startday,0,0)
choosetime = input(false,"Choose Time Interval")
condTime = (choosetime ? (timeStart and timeEnd) : true)

// time frame?
tfc = 1
if timeframe.isdaily
    tfc := 24

// indicators: price normalized alma, and its 1st and 2nd derivatives
ema = ta.alma(close,140,1.1,6)
dema = (ema-ema[1])/ema
stodema = ta.ema(ta.ema(ta.stoch(dema,dema,dema,100),3),3)

d2ema = ta.ema(dema-dema[1],5)
stod2ema = ta.ema(ta.ema(ta.stoch(d2ema,d2ema,d2ema,100),3),3)

ind = (close-ta.ema(close,120*24/tfc))/close
heat = ta.ema(ta.stoch(ind,ind,ind,120*24/tfc),3)
index = ta.ema(heat,7*24/tfc)

//plot graph
green = color.rgb(20,255,100)
yellow = color.yellow
red = color.red
blue = color.rgb(20,120,255)
tcolor = (dema>0) and (d2ema>0)? green : (dema>0) and (d2ema<0) ? yellow : (dema < 0) and (d2ema<0) ? red : (dema < 0) and (d2ema>0) ? blue : color.black
demaema = ta.ema(dema,21)
plot(demaema, color = tcolor)

//strategy buy-sell conditions
cond1a = strategy.position_size <= 0
cond1b = strategy.position_size > 0

if (condTime and cond1a and ( ( ((tcolor[1] == red and demaema<0.02) or (tcolor[1] == blue and demaema < 0.02) or (tcolor[1] == yellow and demaema>-0.02) ) and tcolor == green) or (tcolor[1] == red and tcolor == blue and demaema < -0.01) ) and index<85 and ind<0.4)
    strategy.entry("buy",strategy.long, (strategy.equity-strategy.position_size*close)/1/close)

if (condTime and cond1b and ( (((tcolor[1] == yellow and demaema > -0.02) or (tcolor[1] == blue and demaema < 0.02) or (tcolor[1] == green and demaema < 0.02)) and tcolor == red) or (tcolor[1] == green and tcolor == yellow and demaema > 0.015) ) and index>15 and ind>-0.1)
    strategy.order("sell",strategy.short, strategy.position_size)
Published by ChaoZhang on the FMZ strategy square · last modified 2024-02-22. Collected in the Quant Trading Vault. Unvalidated research: re-test with your own data and costs before trusting it.
Build this with AgenKit
A spec is not a trading system. Paste this into your coding agent and AgenKit runs a specialist team — architecture, test-first build, risk gates, review — with paper trading on by default.
/agenkit build a production-grade trading bot with a backtest engine, risk controls and paper trading by default from strategies/MyQuant-Trend-Identifier-Strategy.md- npx agenkit install engineering-kit in your project
- Paste the command into your agent and approve each phase
- Get tests, backtest, risk controls and a paper-trading switch
Understand it first
Before you run this, read the lesson behind the idea and how to backtest it honestly. Specs like this one are the survivors of an unknown number of trials; deflate their results accordingly.
Related specs
- EMA AROON ASHPine Script · Trend following · 3m
- EMA SMA Multi Indicator Comprehensive Trend Following StrategyPine Script · Trend following · 1h
- EMA200 and Stochastic RSI StrategyPine Script · Trend following · 1h
- Intraday Stochastic Oscillator with Double Moving Average Crossover StrategyPine Script · Trend following · 1d
- Multi Indicator Trend Divergence Quantitative Trading StrategyPine Script · Trend following · 1d
- Multifactor Driven Trend Trading StrategyPine Script · Trend following · 1m