Nadaraya Watson Envelope Multi Confirmation Dynamic Stop Loss Strategy
This strategy utilizes the Nadaraya-Watson envelope to smooth the price data and calculate upper and lower bands based on the smoothed price. It then uses the ADX and DI indicators to determine trend strength and…
Overview
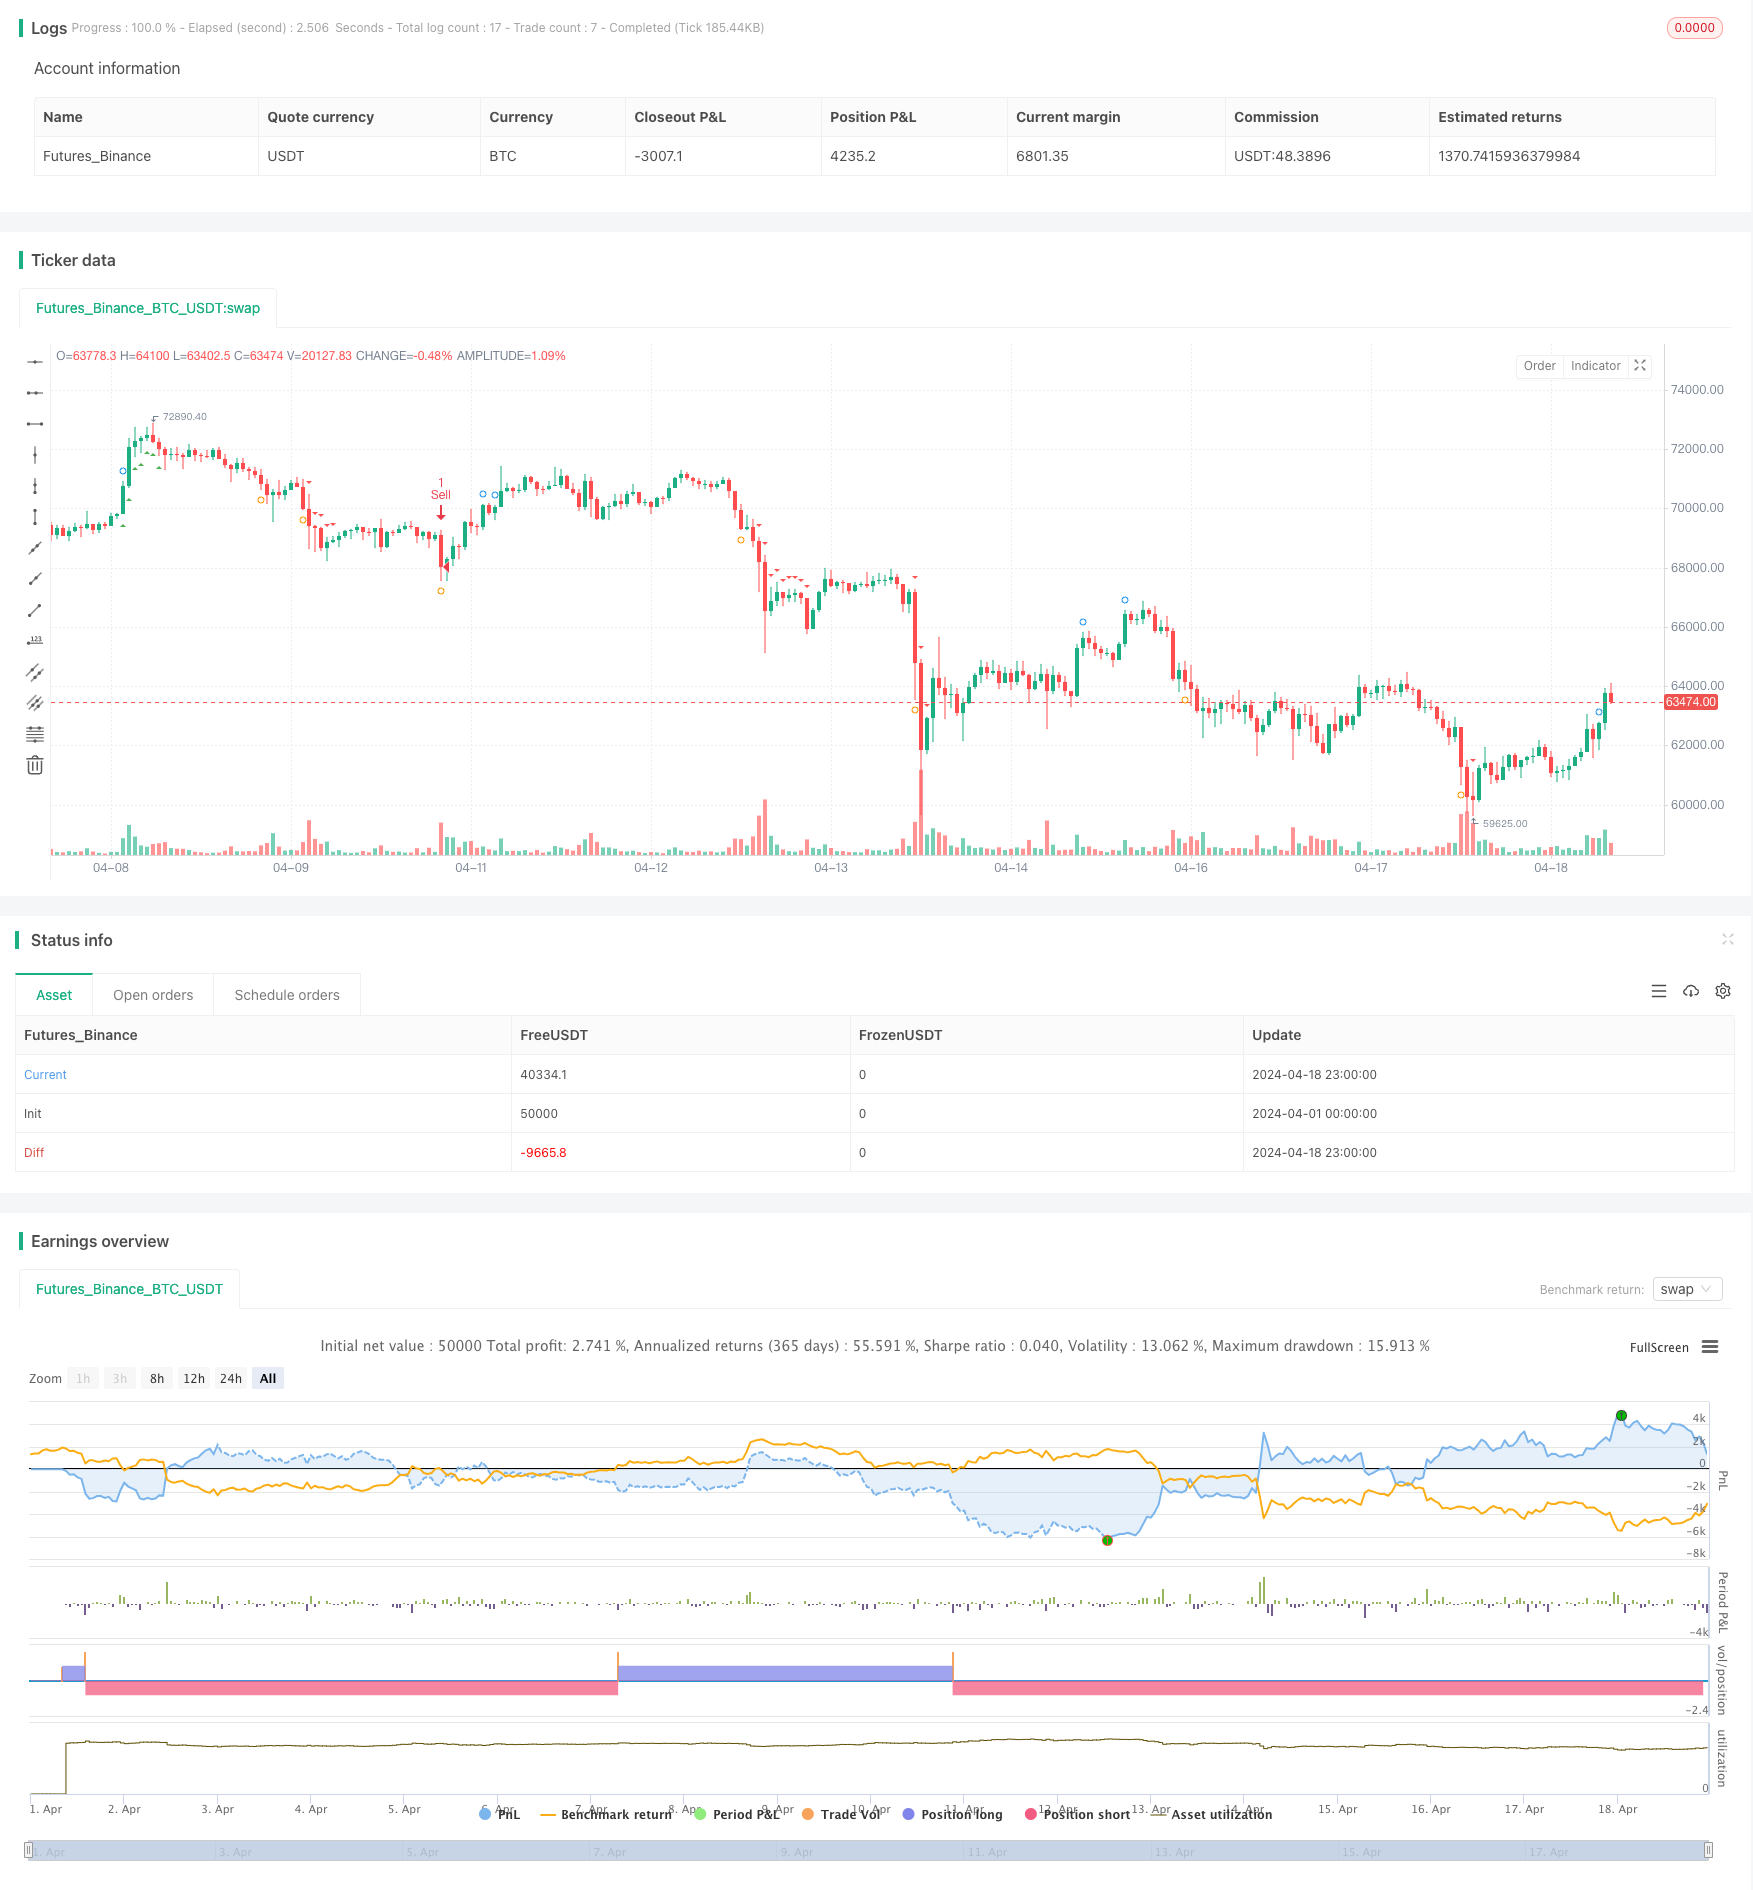
This strategy utilizes the Nadaraya-Watson envelope to smooth the price data and calculate upper and lower bands based on the smoothed price. It then uses the ADX and DI indicators to determine trend strength and direction, and the RSI indicator to confirm trend momentum. Potential breakouts are identified when the price crosses above or below the envelope bands. Finally, it executes trades based on the combined signals of trend, breakout, and momentum, while employing dynamic stop-loss to manage risk.
Strategy Principles
- Apply the Nadaraya-Watson envelope to smooth the price data and calculate upper and lower bands.
- Use the ADX and DI indicators to determine trend strength and direction. An uptrend is indicated when ADX is above a threshold and +DI is greater than -DI, and vice versa for a downtrend.
- Identify potential breakouts when the price crosses above the upper band or below the lower band.
- Confirm trend momentum using the RSI indicator. An RSI above 70 indicates bullish momentum, while an RSI below 30 indicates bearish momentum.
- Execute trades based on the combined signals of trend, breakout, and momentum:
- Enter a long position when there is a strong uptrend, an upward breakout, and bullish momentum.
- Enter a short position when there is a strong downtrend, a downward breakout, and bearish momentum.
- Implement dynamic stop-loss to manage risk. The stop-loss price is calculated based on the highest/lowest price and the closing price.
- Visually display the strategy signals by plotting trend lines, breakout points, and momentum signals on the chart.
Strategy Advantages
- The Nadaraya-Watson envelope effectively smooths price data, reducing noise interference.
- The multi-confirmation mechanism improves signal reliability. Trend, breakout, and momentum signals complement each other to validate trading opportunities.
- Dynamic stop-loss management adapts better to market fluctuations and reduces risk. The stop-loss price is calculated based on the highest/lowest price and the closing price, allowing it to adjust with the market.
- Visually plotting trend lines, breakout points, and momentum signals on the chart facilitates user observation and interpretation of the strategy signals.
Strategy Risks
- In choppy markets or during trend reversals, frequent breakout signals may lead to overtrading and losses.
- Dynamic stop-loss may fail to exit positions promptly during trend reversals, resulting in increased drawdowns.
- Strategy parameters, such as the bandwidth of the Nadaraya-Watson envelope and the ADX threshold, need to be optimized for different markets and instruments. Improper parameter settings may affect the strategy's performance.
Strategy Optimization Directions
- Incorporate additional effective trend determination indicators, such as MACD, moving average systems, etc., to improve the accuracy and stability of trend identification.
- Optimize the dynamic stop-loss calculation method by considering volatility-related indicators like ATR and SAR to make stop-losses more flexible and effective.
- Develop different parameter combinations for various market characteristics, such as trending or range-bound markets, to enhance the strategy's adaptability.
- Introduce a position sizing module to dynamically adjust position sizes based on factors like market trend and volatility, thereby controlling risk.
Summary
This strategy combines the Nadaraya-Watson envelope for price smoothing with trend indicators like ADX and DI, the RSI momentum indicator, and price breakout points to create a comprehensive trading system. Dynamic stop-loss management helps adapt to market changes and control risk to a certain extent. However, in practical application, attention should be paid to optimizing trend identification, dynamic stop-loss, and parameter settings to improve the strategy's robustness and profitability.
Source Pine Script
/*backtest
start: 2024-04-01 00:00:00
end: 2024-04-18 23:59:59
period: 1h
basePeriod: 15m
exchanges: [{"eid":"Futures_Binance","currency":"BTC_USDT"}]
*/

//@version=5
strategy("Nadaraya-Watson Envelope with Multi-Confirmation and Dynamic Stop-Loss", overlay=true)

// Input parameters
h = input.float(7.2, "Bandwidth", minval=0)
mult = input.float(2.1, minval=0)
src = input(close, "Source")

// ADX and DI Input Parameters
adxLength = input.int(14, "ADX Length")
adxThreshold = input.float(25, "ADX Threshold")
adxSmoothing = input.int(14, "ADX Smoothing")

// Calculate ADX and DI
[dmiPlus, dmiMinus, adx] = ta.dmi(adxLength, adxSmoothing)
strongTrendUp = dmiPlus > dmiMinus and adx > adxThreshold
strongTrendDown = dmiMinus > dmiPlus and adx > adxThreshold

// Nadaraya-Watson Envelope Calculation
gauss(x, h) =>
    math.exp(-(math.pow(x, 2) / (h * h * 2)))

coefs = array.new_float(0)
den = 0.0

for i = 0 to 100
    w = gauss(i, h)
    array.push(coefs, w)

den := array.sum(coefs)

out = 0.0
for i = 0 to 100
    out += src[i] * array.get(coefs, i)
out /= den
mae = ta.sma(math.abs(src - out), 100) * mult

upper = ta.sma(out + mae, 10)
lower = ta.sma(out - mae, 10)

// Confirmations
breakoutUp = ta.crossover(src, upper)
breakoutDown = ta.crossunder(src, lower)

// Original RSI period and thresholds
rsiPeriod = input.int(14, "RSI Period")
rsi = ta.rsi(src, rsiPeriod)
momentumUp = rsi > 70 and adx > adxThreshold
momentumDown = rsi < 30 and adx > adxThreshold

// // Plot ADX-based Trend Confirmation Lines
// if (strongTrendUp)
//     line.new(bar_index, low, bar_index + 1, low, color=color.new(color.blue, 50), width=2, style=line.style_dashed)

// if (strongTrendDown)
//     line.new(bar_index, high, bar_index + 1, high, color=color.new(color.red, 50), width=2, style=line.style_dashed)

// Plot Breakout Confirmation Dots
plotshape(series=breakoutUp, style=shape.circle, location=location.abovebar, color=color.blue, size=size.tiny, title="Breakout Up")
plotshape(series=breakoutDown, style=shape.circle, location=location.belowbar, color=color.orange, size=size.tiny, title="Breakout Down")

// Plot Momentum Confirmation Arrows
plotshape(series=momentumUp, style=shape.triangleup, location=location.belowbar, color=color.green, size=size.tiny, title="Momentum Up")
plotshape(series=momentumDown, style=shape.triangledown, location=location.abovebar, color=color.red, size=size.tiny, title="Momentum Down")

// Strategy Entry and Exit
var float stopLossLevel = na
var float highestPrice = na

potentialBuy = strongTrendUp and breakoutUp
potentialSell = strongTrendDown and breakoutDown
momentumConfirmUp = potentialBuy and momentumUp
momentumConfirmDown = potentialSell and momentumDown

if (momentumConfirmUp)
    strategy.entry("Buy", strategy.long)
    stopLossLevel := close * 0.90
    highestPrice := close

if (momentumConfirmDown)
    strategy.entry("Sell", strategy.short)
    stopLossLevel := close * 1.10
    highestPrice := close

if (strategy.position_size > 0)
    highestPrice := math.max(highestPrice, close)
    stopLossLevel := math.max(highestPrice * 0.85, close * 0.90)

if (strategy.position_size < 0)
    highestPrice := math.min(highestPrice, close)
    stopLossLevel := math.min(highestPrice * 1.15, close * 1.10)

// Close position if stop loss is hit
if (strategy.position_size > 0 and close < stopLossLevel)
    strategy.close("Buy")

if (strategy.position_size < 0 and close > stopLossLevel)
    strategy.close("Sell")
Published by ChaoZhang on the FMZ strategy square · last modified 2024-05-24. Collected in the Quant Trading Vault. Unvalidated research: re-test with your own data and costs before trusting it.
Build this with AgenKit
A spec is not a trading system. Paste this into your coding agent and AgenKit runs a specialist team — architecture, test-first build, risk gates, review — with paper trading on by default.
/agenkit build a production-grade trading bot with a backtest engine, risk controls and paper trading by default from strategies/Nadaraya-Watson-Envelope-Multi-Confirmation-Dynamic-Stop-Loss-Strategy.md- npx agenkit install engineering-kit in your project
- Paste the command into your agent and approve each phase
- Get tests, backtest, risk controls and a paper-trading switch
Understand it first
Before you run this, read the lesson behind the idea and how to backtest it honestly. Specs like this one are the survivors of an unknown number of trials; deflate their results accordingly.
Related specs
- Momentum Breakout Trading Strategy 440964Pine Script · Breakout · 5m
- Moving Average Crossover and Upper Rail Breakthrough Impulse StrategyPine Script · Breakout · 1m
- Multi Filter Trend Breakthrough Smart Moving Average Trading StrategyPine Script · Breakout · 1h
- Multi factor Intelligent Trading StrategyPine Script · Breakout · 1d
- Quantitative Trading Strategy Based on Ichimoku with Multiple SignalsPine Script · Breakout · 1h
- Momentum Breakout Strategy 435272Pine Script · Breakout · 1m