PMax Breakout Strategy Based on RSI and T3 Indicators
This is a quantitative trading strategy that utilizes RSI and T3 indicators to determine trends and sets stop-loss lines based on ATR indicators to implement adaptive PMax breakouts. Its main idea is to optimize…
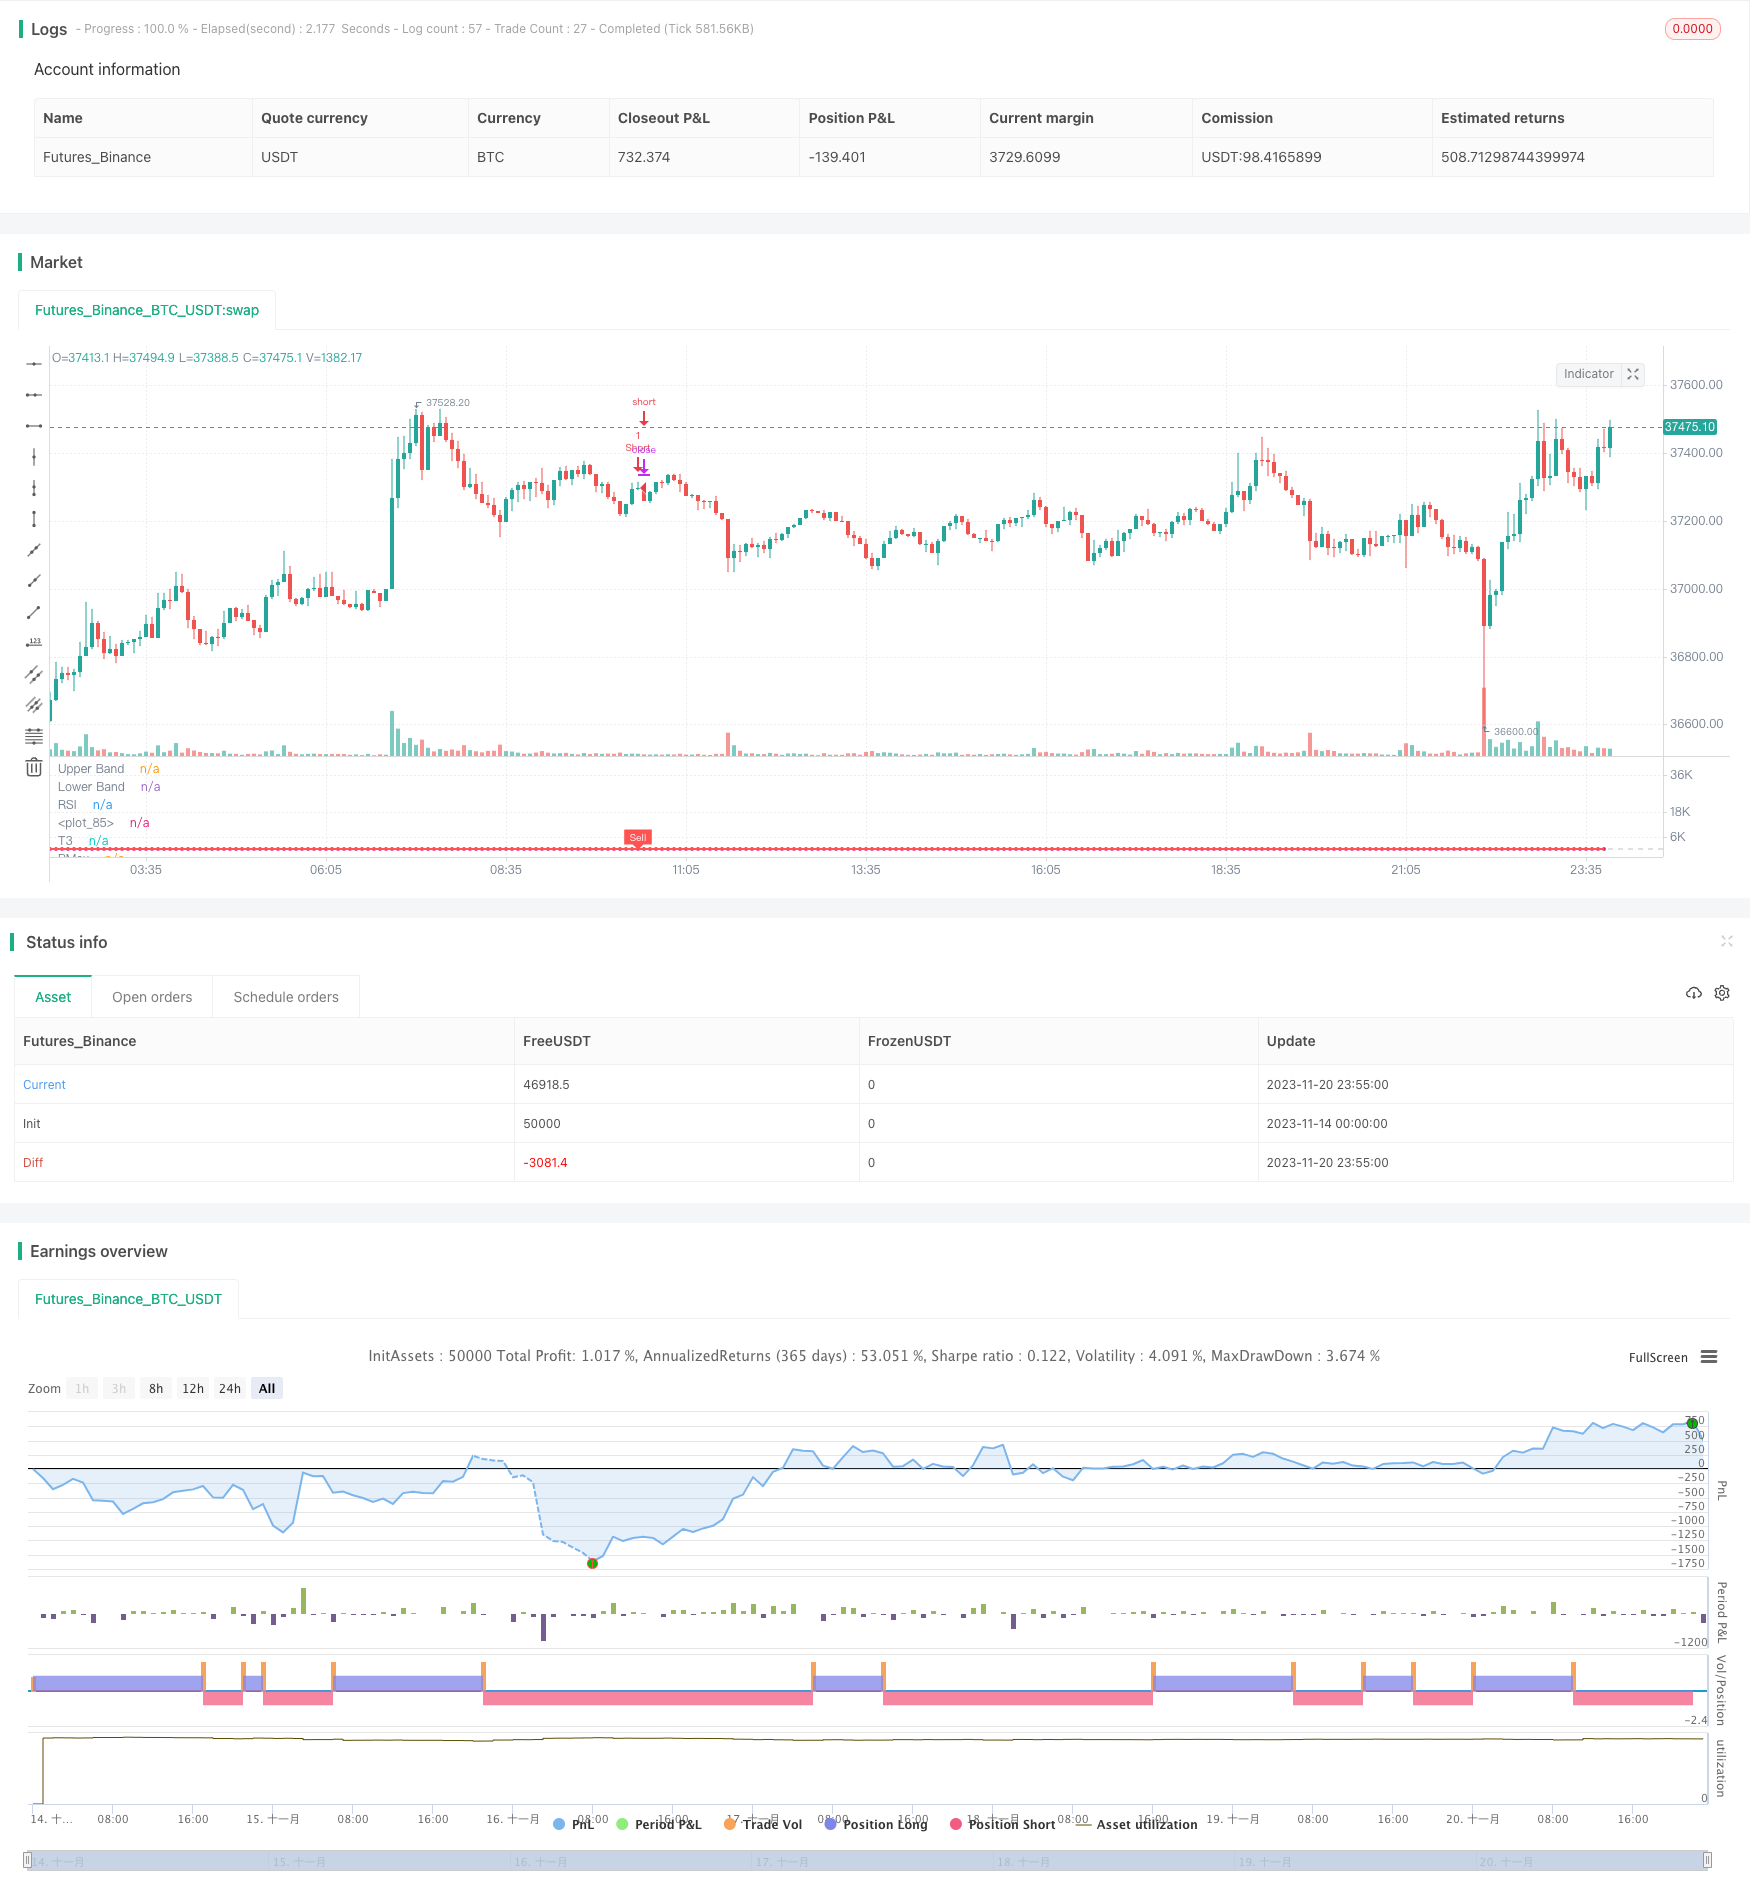
Overview
This is a quantitative trading strategy that utilizes RSI and T3 indicators to determine trends and sets stop-loss lines based on ATR indicators to implement adaptive PMax breakouts. Its main idea is to optimize trend determination and stop-loss settings to control risks while improving profitability.
Strategy Logic
Determine trends using RSI and T3 indicators
- Use RSI indicator to judge overbought/oversold of stocks
- Calculate T3 indicator based on RSI to determine trends
Set adaptive PMax stop-loss lines based on ATR indicator
- Use ATR as a representative of volatility
- Set stop-loss lines above and below T3 indicator, with width of a multiple of ATR
- Realize adaptive adjustment of stop-loss lines
Buy on crossover and exit on stop-loss
- Consider price crossover above T3 as buy signal
- Exit position when price crosses below stop-loss line
Advantages
The main advantages of this strategy:
- RSI + T3 combination improves trend determination
- PMax adaptive stop-loss controls risks
- ATR as volatility index rationalizes stop-loss width
- Balance between drawdown and profitability
Risks
The main risks:
Reversal risk
Short-term reversals may trigger stop-loss and cause loss. Can loosen stop-loss to reduce impact.
Trend determination failure risk
RSI+T3's trend determination not 100% reliable. Wrong judgement may cause loss. Can optimize parameters or add other indicators.
Improvements
Some directions for further optimization:
- Add other indicators like moving average for trend assistance
- Optimize length parameters for RSI and T3
- Test different ATR multipliers for stop-loss width
- Adjust stop-loss looseness based on different markets
Conclusion
This strategy integrates the strengths of RSI, T3 and ATR indicators, achieving a combination of trend determination and risk control. Compared to single indicators, it has higher accuracy and drawdown control, making it a reliable trend tracking strategy. Still room for optimizing parameters and risk control. Overall a recommended quantitative trading strategy worth promoting.
Parameters
| Name | Default | What it controls |
|---|---|---|
| v_input_1_hl2 | 0 | Source: hl2 | high | low | open | close | hlc3 | hlcc4 | ohlc4 |
| v_input_2 | 3 | ATR Multiplier |
| v_input_3 | 8 | Tillson T3 Length |
| v_input_4 | 0.7 | TILLSON T3 Volume Factor |
| v_input_5 | 10 | ATR Length |
| v_input_6 | 14 | RSI Length |
| v_input_7 | true | Show RSI? |
| v_input_8 | true | Show Moving Average? |
| v_input_9 | true | Show Crossing Signals? |
| v_input_10 | true | Highlighter On/Off ? |
| v_input_11 | true | =Backtest Inputs= |
| v_input_12 | true | From Day |
| v_input_13 | true | From Month |
| v_input_14 | 2005 | From Year |
| v_input_15 | true | To Day |
| v_input_16 | true | To Month |
| v_input_17 | 9999 | To Year |
Source Pine Script
/*backtest
start: 2023-11-14 00:00:00
end: 2023-11-21 00:00:00
period: 5m
basePeriod: 1m
exchanges: [{"eid":"Futures_Binance","currency":"BTC_USDT"}]
*/

//@version=4
// This source code is subject to the terms of the Mozilla Public License 2.0 at https://mozilla.org/MPL/2.0/
// © KivancOzbilgic
//developer: @KivancOzbilgic
//author: @KivancOzbilgic

strategy("PMax on Rsi w T3 Strategy","PmR3St.", overlay=false, precision=2)
src = input(hl2, title="Source")
Multiplier = input(title="ATR Multiplier", type=input.float, step=0.1, defval=3)
length =input(8, "Tillson T3 Length", minval=1)
T3a1 = input(0.7, "TILLSON T3 Volume Factor", step=0.1)
Periods = input(10,title="ATR Length", type=input.integer)
rsilength = input(14, minval=1, title="RSI Length")
showrsi = input(title="Show RSI?", type=input.bool, defval=true)
showsupport = input(title="Show Moving Average?", type=input.bool, defval=true)
showsignalsk = input(title="Show Crossing Signals?", type=input.bool, defval=true)
highlighting = input(title="Highlighter On/Off ?", type=input.bool, defval=true)
i = close>=close[1] ? close-close[1] : 0
i2 = close<close[1] ? close[1]-close : 0
Wwma_Func(src,rsilength)=>
    wwalpha = 1/ rsilength
    WWMA = 0.0
    WWMA := wwalpha*src + (1-wwalpha)*nz(WWMA[1])
WWMA=Wwma_Func(src,rsilength)
AvUp = Wwma_Func(i,rsilength)
AvDown = Wwma_Func(i2,rsilength)
AvgUp = sma(i,rsilength)
AvgDown =sma(i2,rsilength)
k1 = high>close[1] ? high-close[1] : 0
k2 = high<close[1] ? close[1]-high : 0
k3 = low>close[1] ? low-close[1] : 0
k4 = low<close[1] ? close[1]-low : 0
AvgUpH=(AvgUp*(rsilength-1)+ k1)/rsilength
AvgDownH=(AvgDown*(rsilength-1)+ k2)/rsilength
AvgUpL=(AvgUp*(rsilength-1)+ k3)/rsilength
AvgDownL=(AvgDown*(rsilength-1)+ k4)/rsilength
rs = AvUp/AvDown
rsi= rs==-1 ? 0 : (100-(100/(1+rs)))
rsh=AvgUpH/AvgDownH
rsih= rsh==-1 ? 0 : (100-(100/(1+rsh)))
rsl=AvgUpL/AvgDownL
rsil= rsl==-1 ? 0 : (100-(100/(1+rsl)))
TR=max(rsih-rsil,abs(rsih-rsi[1]),abs(rsil-rsi[1]))
atr=sma(TR,Periods)
plot(showrsi ? rsi : na, "RSI", color=#8E1599)
band1 = hline(70, "Upper Band", color=#C0C0C0)
band0 = hline(30, "Lower Band", color=#C0C0C0)
fill(band1, band0, color=#9915FF, transp=90, title="Background")
T3e1=ema(rsi, length)
T3e2=ema(T3e1,length)
T3e3=ema(T3e2,length)
T3e4=ema(T3e3,length)
T3e5=ema(T3e4,length)
T3e6=ema(T3e5,length)
T3c1=-T3a1*T3a1*T3a1
T3c2=3*T3a1*T3a1+3*T3a1*T3a1*T3a1
T3c3=-6*T3a1*T3a1-3*T3a1-3*T3a1*T3a1*T3a1
T3c4=1+3*T3a1+T3a1*T3a1*T3a1+3*T3a1*T3a1
T3=T3c1*T3e6+T3c2*T3e5+T3c3*T3e4+T3c4*T3e3
MAvg=T3
Pmax_Func(rsi,length)=>
    longStop = MAvg - Multiplier*atr
    longStopPrev = nz(longStop[1], longStop)
    longStop := MAvg > longStopPrev ? max(longStop, longStopPrev) : longStop
    shortStop = MAvg + Multiplier*atr
    shortStopPrev = nz(shortStop[1], shortStop)
    shortStop := MAvg < shortStopPrev ? min(shortStop, shortStopPrev) : shortStop
    dir = 1
    dir := nz(dir[1], dir)
    dir := dir == -1 and MAvg > shortStopPrev ? 1 : dir == 1 and MAvg < longStopPrev ? -1 : dir
    PMax = dir==1 ? longStop: shortStop
PMax=Pmax_Func(rsi,length)
plot(showsupport ? MAvg : na, color=color.black, linewidth=2, title="T3")
pALL=plot(PMax, color=color.red, linewidth=2, title="PMax", transp=0)
alertcondition(cross(MAvg, PMax), title="Cross Alert", message="PMax - Moving Avg Crossing!")
alertcondition(crossover(MAvg, PMax), title="Crossover Alarm", message="Moving Avg BUY SIGNAL!")
alertcondition(crossunder(MAvg, PMax), title="Crossunder Alarm", message="Moving Avg SELL SIGNAL!")
alertcondition(cross(src, PMax), title="Price Cross Alert", message="PMax - Price Crossing!")
alertcondition(crossover(src, PMax), title="Price Crossover Alarm", message="PRICE OVER PMax - BUY SIGNAL!")
alertcondition(crossunder(src, PMax), title="Price Crossunder Alarm", message="PRICE UNDER PMax - SELL SIGNAL!")
buySignalk = crossover(MAvg, PMax)
plotshape(buySignalk and showsignalsk ? PMax*0.995 : na, title="Buy", text="Buy", location=location.absolute, style=shape.labelup, size=size.tiny, color=color.green, textcolor=color.white, transp=0)
sellSignallk = crossunder(MAvg, PMax)
plotshape(sellSignallk and showsignalsk ? PMax*1.005 : na, title="Sell", text="Sell", location=location.absolute, style=shape.labeldown, size=size.tiny, color=color.red, textcolor=color.white, transp=0)
mPlot = plot(rsi, title="", style=plot.style_circles, linewidth=0,display=display.none)
longFillColor = highlighting ? (MAvg>PMax ? color.green : na) : na
shortFillColor = highlighting ? (MAvg<PMax ? color.red : na) : na
fill(mPlot, pALL, title="UpTrend Highligter", color=longFillColor)
fill(mPlot, pALL, title="DownTrend Highligter", color=shortFillColor)

dummy0 = input(true, title = "=Backtest Inputs=")
FromDay    = input(defval = 1, title = "From Day", minval = 1, maxval = 31)
FromMonth  = input(defval = 1, title = "From Month", minval = 1, maxval = 12)
FromYear   = input(defval = 2005, title = "From Year", minval = 2005)
ToDay      = input(defval = 1, title = "To Day", minval = 1, maxval = 31)
ToMonth    = input(defval = 1, title = "To Month", minval = 1, maxval = 12)
ToYear     = input(defval = 9999, title = "To Year", minval = 2006)
Start     = timestamp(FromYear, FromMonth, FromDay, 00, 00)
Finish    = timestamp(ToYear, ToMonth, ToDay, 23, 59)
Timerange() =>
    time >= Start and time <= Finish ? true : false
if buySignalk
    strategy.entry("Long", strategy.long,when=Timerange())
if sellSignallk
    strategy.entry("Short", strategy.short,when=Timerange())
Published by ChaoZhang on the FMZ strategy square · last modified 2023-11-22. Collected in the Quant Trading Vault. Unvalidated research: re-test with your own data and costs before trusting it.
Build this with AgenKit
A spec is not a trading system. Paste this into your coding agent and AgenKit runs a specialist team — architecture, test-first build, risk gates, review — with paper trading on by default.
/agenkit build a production-grade trading bot with a backtest engine, risk controls and paper trading by default from strategies/PMax-Breakout-Strategy-Based-on-RSI-and-T3-Indicators.md- npx agenkit install engineering-kit in your project
- Paste the command into your agent and approve each phase
- Get tests, backtest, risk controls and a paper-trading switch
Understand it first
Before you run this, read the lesson behind the idea and how to backtest it honestly. Specs like this one are the survivors of an unknown number of trials; deflate their results accordingly.
Related specs
- Dual MA Momentum Breakout StrategyPine Script · Breakout · 1h
- EMA and Bollinger Bands Breakout StrategyPine Script · Breakout · 1h
- Momentum Breakout Moving Average StrategyPine Script · Breakout · 1d
- Momentum Breakout Trading Strategy 440964Pine Script · Breakout · 5m
- Moving Average Crossover and Upper Rail Breakthrough Impulse StrategyPine Script · Breakout · 1m
- Multi Filter Trend Breakthrough Smart Moving Average Trading StrategyPine Script · Breakout · 1h