Price Volatility Breakout Strategy Based on Double Moving Averages
The core idea of this strategy is to use price volatility to judge market trends. When volatility rises, it means the market is forming a new trend. And when volatility declines, it means the current trend is ending…
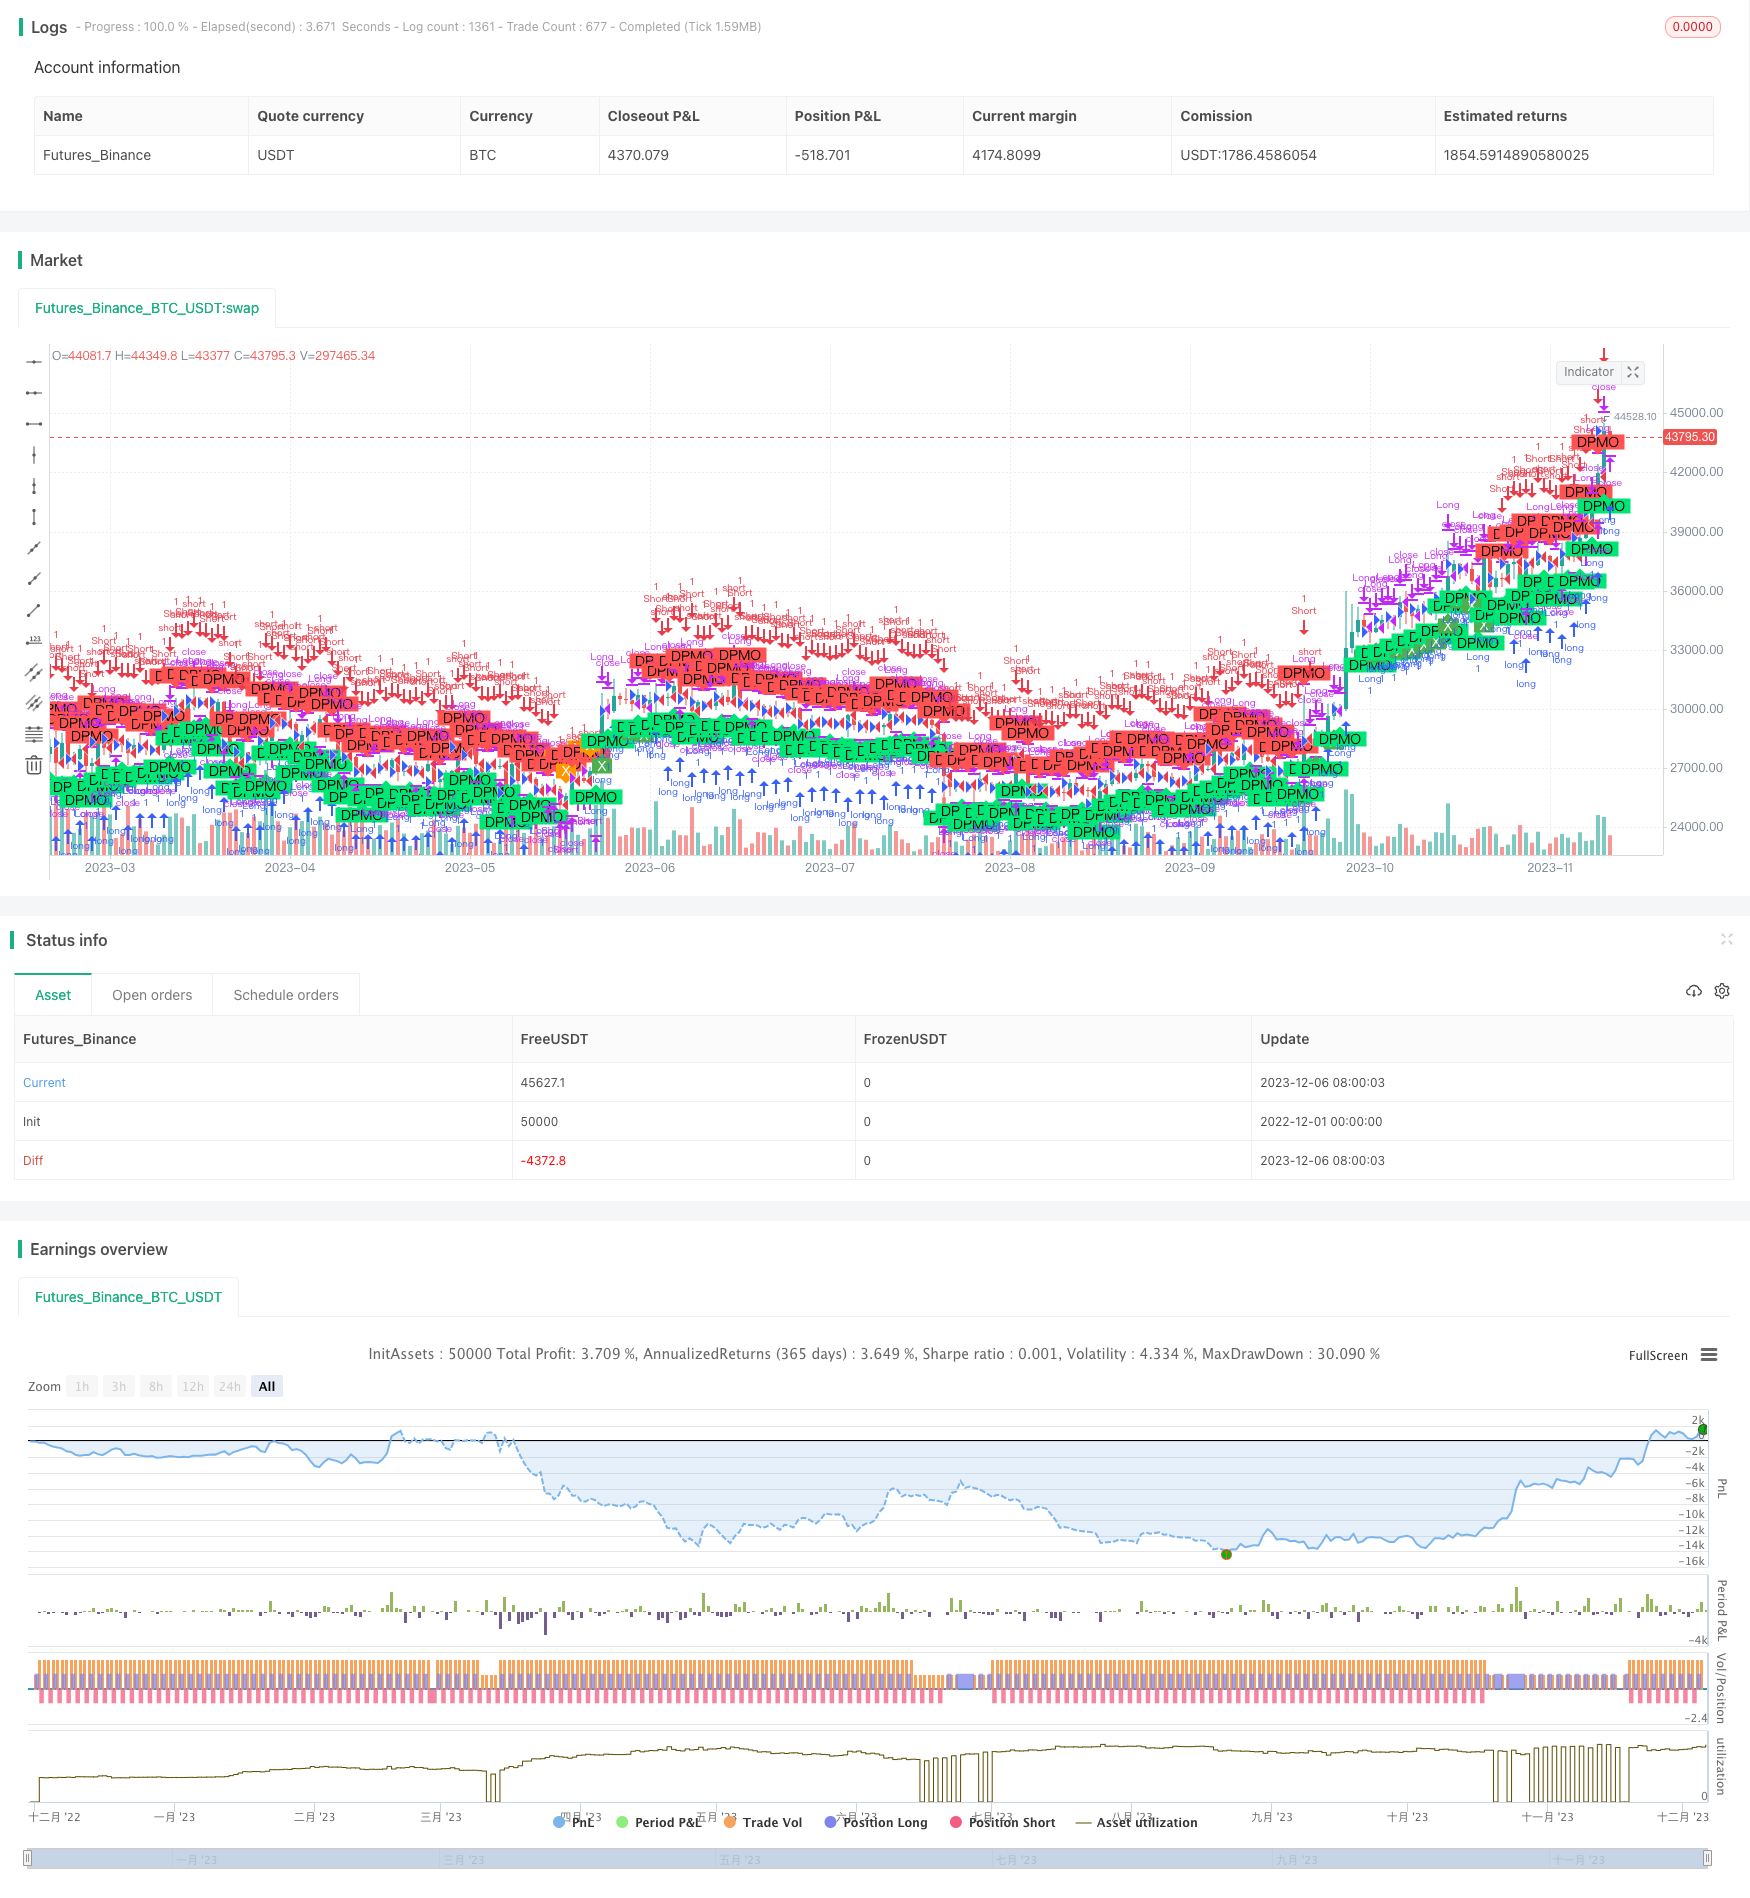
Overview
The core idea of this strategy is to use price volatility to judge market trends. When volatility rises, it means the market is forming a new trend. And when volatility declines, it means the current trend is ending. The strategy calculates the percentage change of price and then filters it with double moving averages to get an indicator reflecting price volatility. It generates buy signals when the indicator crosses above its signal line, and sells signals when crossing below.
Strategy Logic
The strategy first calculates the percentage change of price:
i=(src/nz(src[1], src))*100
Then it filters i with a 35-period moving average to get the preliminary volatility indicator pmol2. Pmol2 is filtered again with a 20-period moving average to get the final indicator pmol. Finally, a 10-period moving average of pmol is used as the signal line pmols. Buy when pmol crosses over pmols and sell when crossing below.
Advantage Analysis
- The double MA filtering extracts volatility well and filters out noise.
- Calculating percentage change amplifies price movements, making trend changes more visible.
- Profit model is clear: buy at trend start, sell at trend end.
Risk Analysis
- Double filtering causes some lag.
- Percentage change calculation is sensitive to price amplitude.
- Need timely exits at bull-bear transitions.
Optimization Directions
- Optimize MA parameters to improve trend catching.
- Try different price change calculation methods.
- Add filters to avoid wrong signals.
Summary
This strategy uses percentage change and double MA filtering to extract price volatility and judge trend changes. It belongs to the relatively mature technical indicator strategies. The strategy has good trend catching capability but medium turning point recognition capability. Can optimize via parameter tuning and adding auxiliary conditions.
Parameters
| Name | Default | What it controls |
|---|---|---|
| v_input_1_close | 0 | Source: close | high | low | open | hl2 | hlc3 | hlcc4 | ohlc4 |
| v_input_2 | 35 | First Smoothing |
| v_input_3 | 20 | Second Smoothing |
| v_input_4 | 10 | Signal Smoothing |
| v_input_5 | false | Enable Bar Colors |
Source Pine Script
/*backtest
start: 2022-12-01 00:00:00
end: 2023-12-07 00:00:00
period: 1d
basePeriod: 1h
exchanges: [{"eid":"Futures_Binance","currency":"BTC_USDT"}]
*/

//@version=2
strategy("Strategy for DPMO", overlay=true)

src=input(close, title="Source")
length1=input(35, title="First Smoothing")
length2=input(20, title="Second Smoothing")
siglength=input(10, title="Signal Smoothing")
ebc=input(false, title="Enable Bar Colors")

upSign = '↑' // indicates the indicator shows uptrend
downSign = '↓' // incicates the indicator showing downtrend
exitSign ='x' //indicates the indicator uptrend/downtrend ending

calc_csf(src, length) =>
	sm = 2.0/length
	csf=(src - nz(csf[1])) * sm + nz(csf[1])
	csf
i=(src/nz(src[1], src))*100
pmol2=calc_csf(i-100, length1)
pmol=calc_csf( 10 * pmol2, length2)
pmols=ema(pmol, siglength)
d=pmol-pmols
hc=d>0?d>d[1]?lime:green:d<d[1]?red:orange

buyDPMO = hc==lime and hc[1]!=lime
closeBuyDPMO = hc==green and hc[1]!=green
sellDPMO = hc==red and hc[1]!=red
closeSellDPMO = hc==orange and hc[1]!=orange

plotshape(buyDPMO, color=lime, style=shape.labelup, textcolor=#000000, text="DPMO", location=location.belowbar, transp=0)
plotshape(closeBuyDPMO, color=green, style=shape.labelup, textcolor=#ffffff,  text="X", location=location.belowbar, transp=0)
plotshape(sellDPMO, color=red, style=shape.labeldown, textcolor=#000000, text="DPMO", location=location.abovebar, transp=0)
plotshape(closeSellDPMO, color=orange, style=shape.labeldown, textcolor=#ffffff,  text="X", location=location.abovebar, transp=0)
barcolor(ebc?hc:na)


strategy.entry("Long", strategy.long, when=buyDPMO)
strategy.close("Long", when=closeBuyDPMO or sellDPMO)
strategy.entry("Short", strategy.short, when=sellDPMO)
strategy.close("Short", when=closeSellDPMO or buyDPMO)
Published by ChaoZhang on the FMZ strategy square · last modified 2023-12-08. Collected in the Quant Trading Vault. Unvalidated research: re-test with your own data and costs before trusting it.
Build this with AgenKit
A spec is not a trading system. Paste this into your coding agent and AgenKit runs a specialist team — architecture, test-first build, risk gates, review — with paper trading on by default.
/agenkit build a production-grade trading bot with a backtest engine, risk controls and paper trading by default from strategies/Price-Volatility-Breakout-Strategy-Based-on-Double-Moving-Averages.md- npx agenkit install engineering-kit in your project
- Paste the command into your agent and approve each phase
- Get tests, backtest, risk controls and a paper-trading switch
Understand it first
Before you run this, read the lesson behind the idea and how to backtest it honestly. Specs like this one are the survivors of an unknown number of trials; deflate their results accordingly.
Related specs
- Adaptive Multi Period Trading Strategy Based on Wave Trend Momentum BreakoutPine Script · Breakout · 2h
- BB Breakout StrategyPine Script · Breakout · 1d
- BMSB Breakout Strategy BMSBPine Script · Breakout · 1h
- Bollinger Band T3 Moving Average StrategyPine Script · Breakout · 10m
- Bollinger Bands Dual track Breakthrough StrategyPine Script · Breakout · 30m
- Bollinger Breakout StrategyPine Script · Breakout · 30m