Strategy vault / Trend following
Quantitative Trading Strategy Based on EMA Crossover
This strategy is named "Quantitative Trading Strategy Based on EMA Crossover". It utilizes the crossover principles of 9-day, 15-day and 50-day EMA lines to trade within short timeframes between 1-minute and…
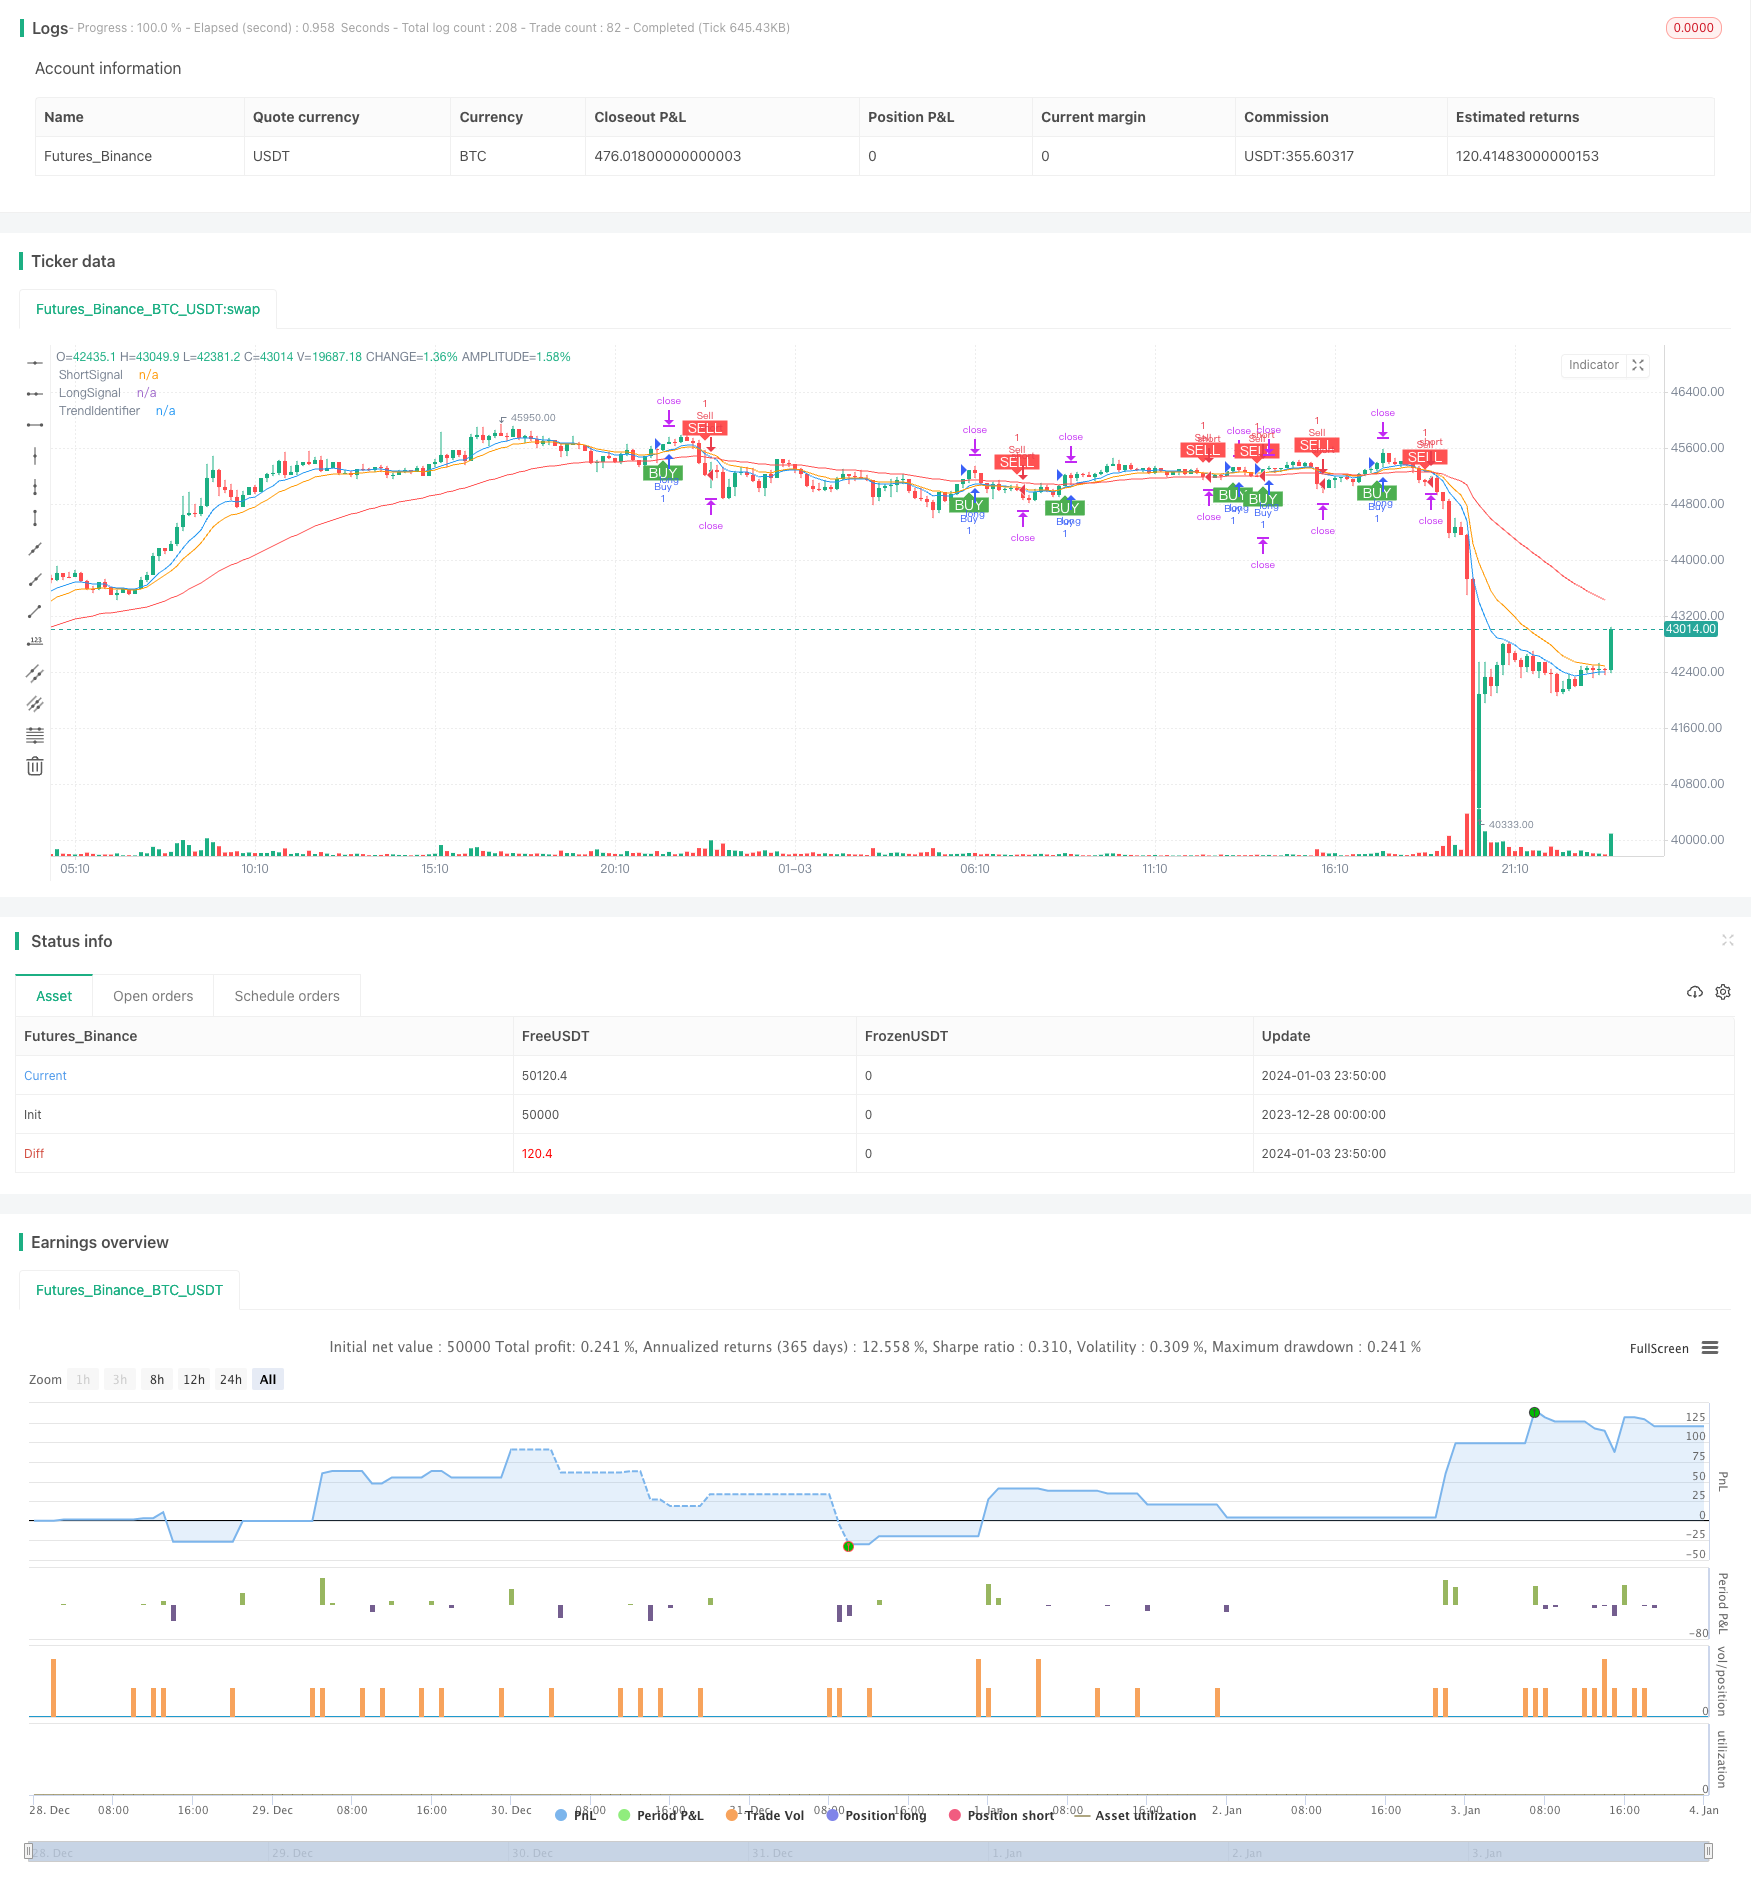
Overview
This strategy is named "Quantitative Trading Strategy Based on EMA Crossover". It utilizes the crossover principles of 9-day, 15-day and 50-day EMA lines to trade within short timeframes between 1-minute and 5-minute, in order to capture short-term price trends for quick entry and exit.
Strategy Principles
The strategy employs 9-day EMA, 15-day EMA and 50-day EMA. The crossover between 9-day EMA and 15-day EMA generates buy and sell signals. When 9-day EMA crosses above 15-day EMA, a buy signal is generated. When 9-day EMA crosses below 15-day EMA, a sell signal is generated. The 50-day EMA line judges the overall trend direction - buy signals are only generated when price is above 50-day EMA, and sell signals below it.
By utilizing fast EMA crossover and long-term EMA support, the strategy aims to capture short-term price actions while avoiding counter trend operations. The crossover of two fast EMAs ensures timely catching of recent price changes; the long period EMA effectively filters out market noise to prevent loss-making contrarian trades.
Advantages of the Strategy
Captures short-term trends: The crossover of two fast EMAs quickly seizes short-term price movements for swift entry and exit.
Filters out noise: Long EMA line judges overall direction to avoid ineffective contrarian trades and unnecessary stop loss.
Customizable parameters: Users can tweak EMA periods to adapt to different market conditions per their needs.
Easy to adopt: Relatively straightforward EMA crossover logic for facile utilization.
Risks of the Strategy
Too sensitive: Two fast EMAs may generate excessive false signals.
Ignores long-term trends: Long EMA cannot fully filter noise - some contrarian risks remain.
Parameter dependency: Optimized parameter reliance on historical data cannot guarantee future viability.
Suboptimal stop loss: Fixed stop loss difficult to calibrate - likely too loose or too tight.
Optimization Directions
Add Stochastics indicator to filter signals and employ KDJ overbought-oversold levels to augment EMA crossover signals.
Build in adaptive stop loss mechanism based on market volatility levels for intelligent adjustment of stop loss points.
Establish parameter optimization module via genetic algorithms for continual iteration towards optimum parameter combinations.
Integrate machine learning models to judge trend and signal accuracy, improving strategy resilience.
Conclusion
The strategy generates trade signals through crossover of two fast EMAs, and a long EMA line to determine overall direction, aiming to seize short-term price movements. Such short-term strategies are easy to use but have flaws e.g. excessive false signals, ignoring long-term trends. Solutions include adding auxiliary indicators, adaptive mechanisms and parameter optimization to improve real-life stability.
Source Pine Script
/*backtest
start: 2023-12-28 00:00:00
end: 2024-01-04 00:00:00
period: 10m
basePeriod: 1m
exchanges: [{"eid":"Futures_Binance","currency":"BTC_USDT"}]
*/

//@version=4
strategy("EMA Crossover Strategy", overlay=true)

// Define the EMAs
shortEma = ema(close, 9)
mediumEma = ema(close, 15)
longEma = ema(close, 50)

// Plot EMAs
plot(shortEma, title="ShortSignal", color=color.blue)
plot(mediumEma, title="LongSignal", color=color.orange)
plot(longEma, title="TrendIdentifier", color=color.red)

// Define the crossover conditions
buyCondition = crossover(shortEma, mediumEma) and close > longEma
sellCondition = crossunder(shortEma, mediumEma) and close < longEma

// Plot labels for crossovers with black text color
plotshape(series=buyCondition, title="Buy Signal", location=location.belowbar, color=color.green, style=shape.labelup, text="BUY", textcolor=color.white)
plotshape(series=sellCondition, title="Sell Signal", location=location.abovebar, color=color.red, style=shape.labeldown, text="SELL", textcolor=color.white)

// Define the strategy conditions
if (buyCondition)
    strategy.entry("Buy", strategy.long)
    strategy.exit("Take Profit", "Buy")

if (sellCondition)
    strategy.entry("Sell", strategy.short)
    strategy.exit("Take Profit", "Sell")

// Run the strategy
strategy.exit("TP/SL", profit=1, loss=0.5)
Published by ChaoZhang on the FMZ strategy square · last modified 2024-01-05. Collected in the Quant Trading Vault. Unvalidated research: re-test with your own data and costs before trusting it.
Build this with AgenKit
A spec is not a trading system. Paste this into your coding agent and AgenKit runs a specialist team — architecture, test-first build, risk gates, review — with paper trading on by default.
/agenkit build a production-grade trading bot with a backtest engine, risk controls and paper trading by default from strategies/Quantitative-Trading-Strategy-Based-on-EMA-Crossover.md- npx agenkit install engineering-kit in your project
- Paste the command into your agent and approve each phase
- Get tests, backtest, risk controls and a paper-trading switch
Understand it first
Before you run this, read the lesson behind the idea and how to backtest it honestly. Specs like this one are the survivors of an unknown number of trials; deflate their results accordingly.
Related specs
- EMA AROON ASHPine Script · Trend following · 3m
- EMA SMA Multi Indicator Comprehensive Trend Following StrategyPine Script · Trend following · 1h
- EMA200 and Stochastic RSI StrategyPine Script · Trend following · 1h
- Intraday Stochastic Oscillator with Double Moving Average Crossover StrategyPine Script · Trend following · 1d
- Multi Indicator Trend Divergence Quantitative Trading StrategyPine Script · Trend following · 1d
- Multifactor Driven Trend Trading StrategyPine Script · Trend following · 1m