Reversal Closing Price Breakout Strategy with Oscillating Stop Loss
This strategy utilizes the price breakout signals and oscillating stop loss mechanism for risk management. It goes long when price breaks out the resistance and goes short when price breaks the support. At the same…
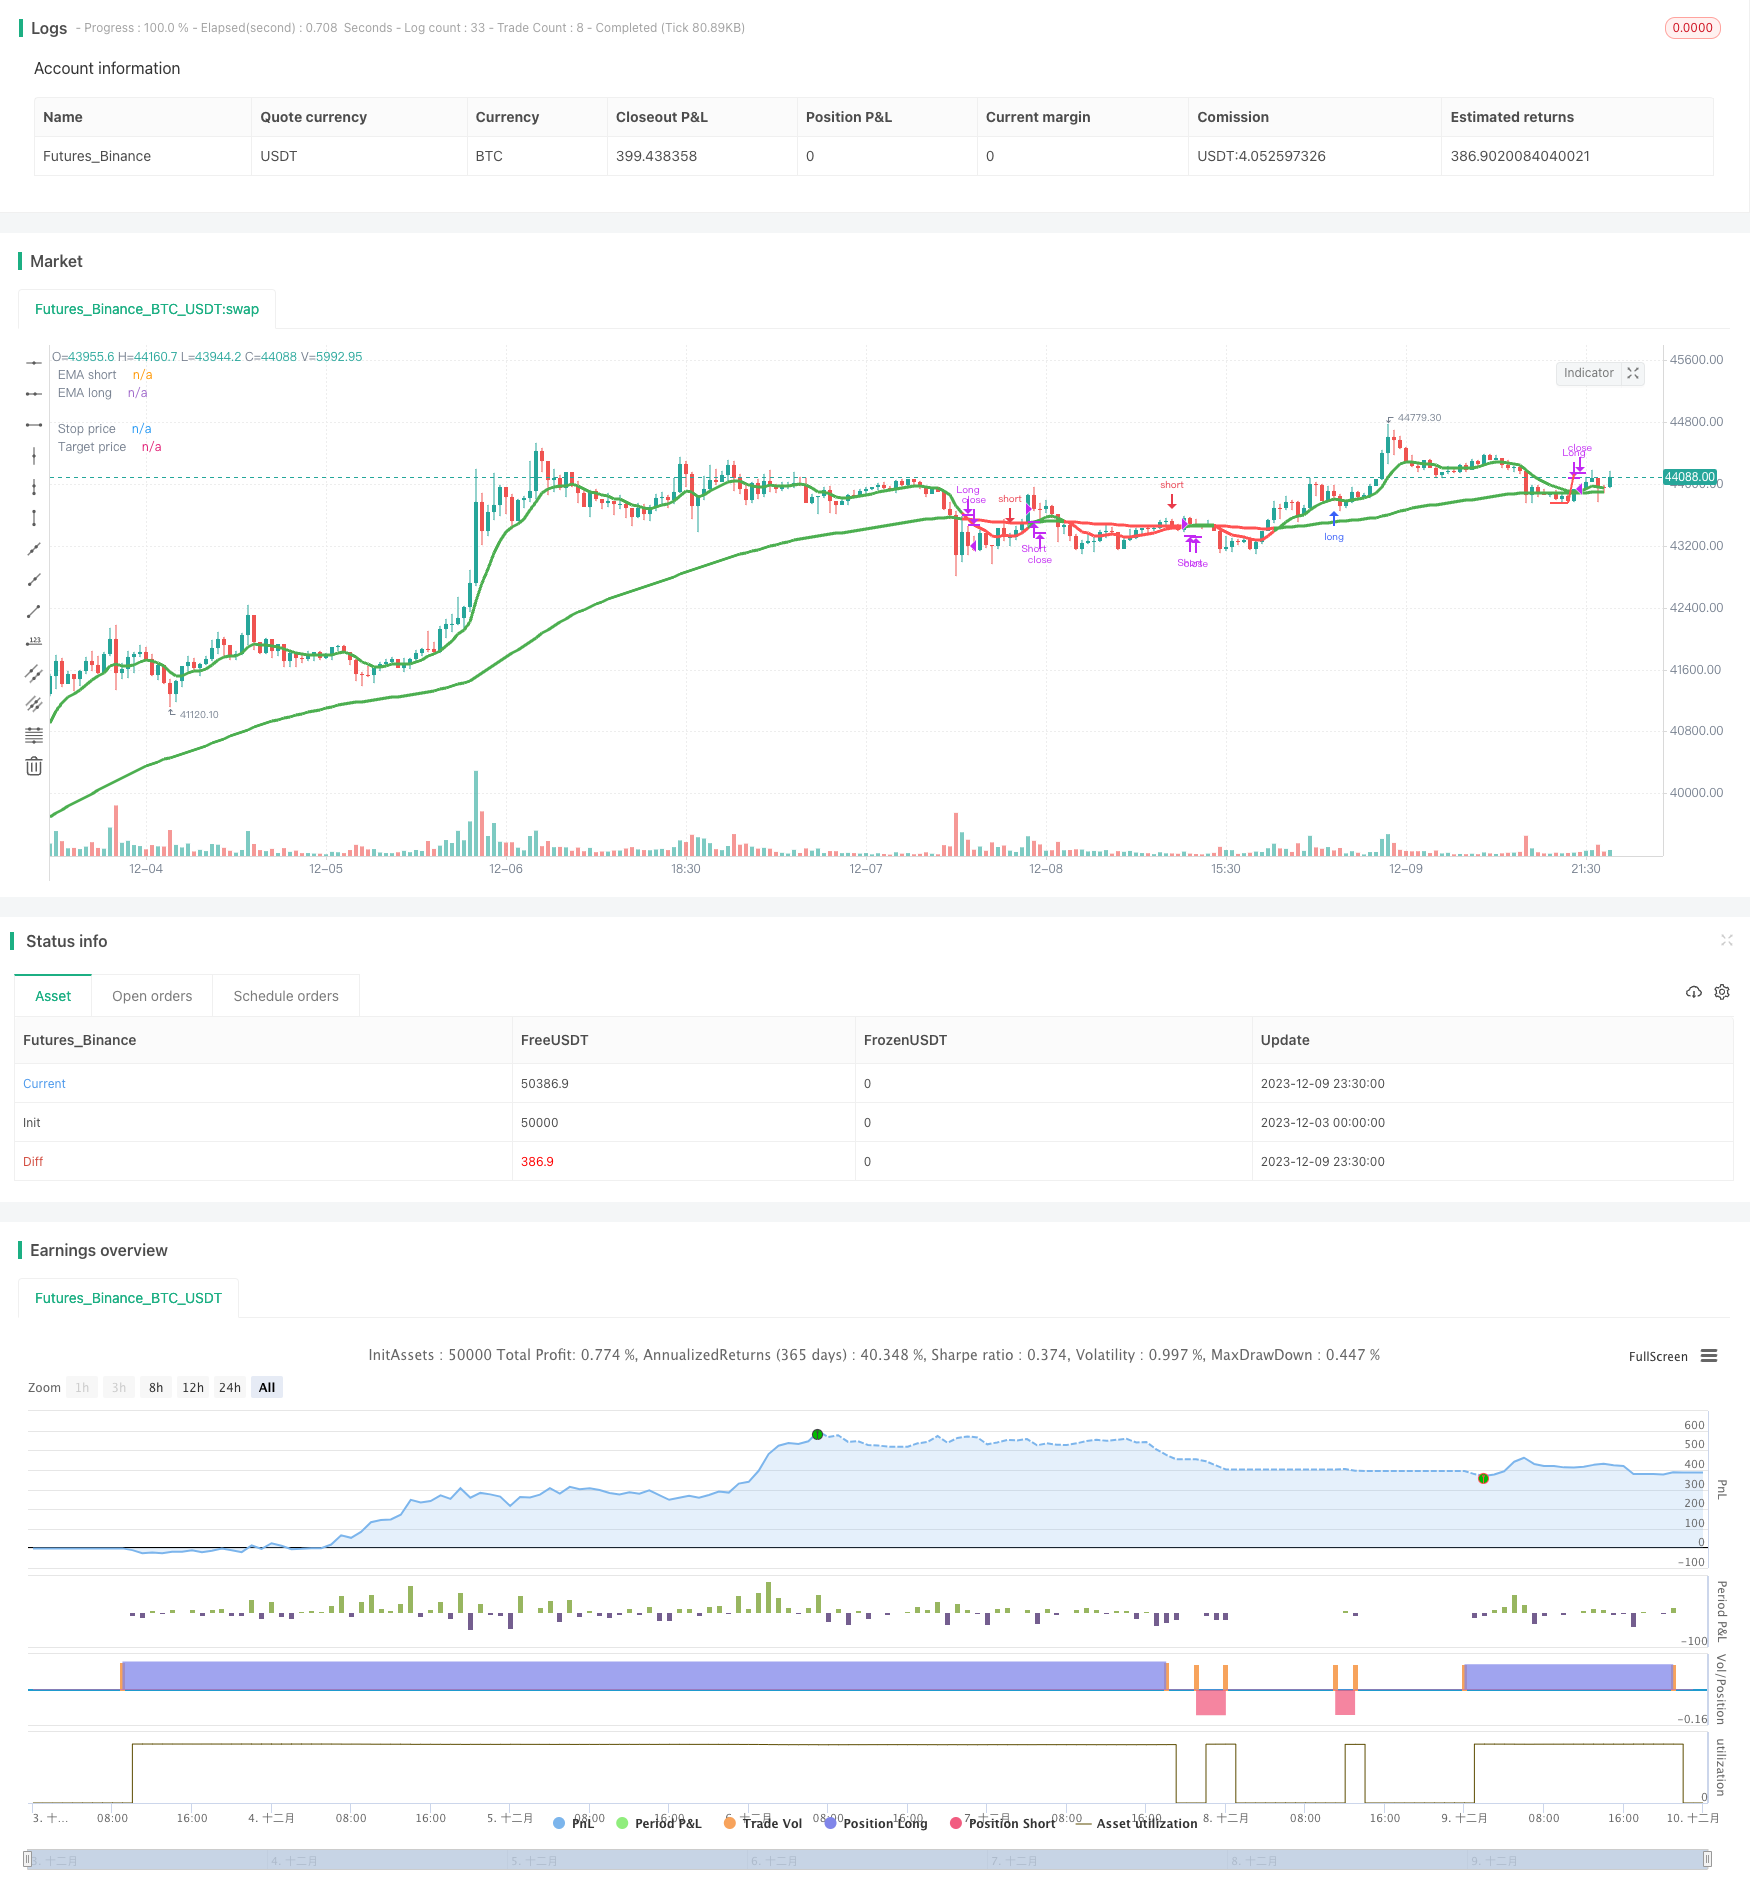
Overview
This strategy utilizes the price breakout signals and oscillating stop loss mechanism for risk management. It goes long when price breaks out the resistance and goes short when price breaks the support. At the same time, oscillating stop loss and profit taking stops are applied for better risk control.
Strategy Logic
The strategy is based on the following key points:
Using MA to determine the trend direction. Fast and slow MAs are plotted, fast MA crossing above slow MA signals bull trend, while crossing below signals bear trend.
Resistance breakout long signal. When price surges and breaks recent swing high, it is considered breaking resistance level, going long.
Support breakout short signal. When price drops and breaks recent swing low, it is considered breaking support level, going short.
Oscillating stop loss. After entry, stop loss line is set and keeps adjusting based on price fluctuation, forming an oscillating stop loss mechanism.
Stop loss and take profit exit. Stop loss exit controls risk, take profit lock in gains.
Specifically, it uses the average of high and low prices as the source, plots fast and slow EMAs to determine trends. When fast EMA goes above slow EMA and resistance breakout signal emerges, it goes long. When fast EMA drops below slow EMA and support breakout shows up, it goes short. After entry, the lowest price in certain periods is set as the stop loss line, keeps adjusting as price rises. Take profit line is plotted to lock in gains. The strategy effectively controls risk meanwhile profit from trends.
Advantage Analysis
The advantages of this strategy include:
Steady profitability. Following trends can make stable gains from long-term trends.
Excellent risk control. Oscillating stop and protective stop quickly cut losses.
Accurate signals. Resistance breakout long and support breakout short provide reliable signals.
Simple rules. Indicators and signals are straightforward, easy to follow.
Market adaptive. Works well across different products and market conditions.
Risk Analysis
Some risks to note for this strategy:
Breakout failure risk. Price may have throwback or pullback after initial breakout, triggering stop loss.
Parameter optimization risk. Bad parameter tuning leads to too many or too few signals. Optimization needs prudence.
Indicator failure risk. In extreme conditions, EMAs may stop working or lag behind price.
Trend reversal risk. Holding position against trend brings accumulating losses when trend reverses.
Proper parameter tuning, wide stop loss, strictly following rules can largely mitigate above risks.
Optimization Directions
The strategy can be further improved from the following aspects:
Timeframe optimization. Adjust calculation periods of MAs and price patterns, find best combinations.
Adaptability optimization. Tune parameters for different products.
Stop loss optimization. Test more advanced stop loss methods like trailing stop, Chandelier stop.
Take profit optimization. Adopt adaptive or exponential profit taking exits for better reward.
Add filters. Add volume, volatility filters to avoid false breakouts.
Enhance entry signals. Combine more indicators or patterns to confirm entries.
Conclusion
This is an effective breakout strategy with good risk control, stable profit model and straightforward logic flow. Fine-tuning and modular enhancement can make it more robust and adaptive to complex markets. It has great application potentials across more products.
Parameters
| Name | Default | What it controls |
|---|---|---|
| v_input_1_hl2 | 0 | Price source: hl2 | high | low | open | close | hlc3 | hlcc4 | ohlc4 |
| v_input_2 | 0 | Order direction: Both | Long | Short |
| v_input_3 | 80 | EMA long period |
| v_input_4 | 8 | EMA short period |
| v_input_5 | 2 | Risk to reward ratio |
| v_input_6 | 3 | Stoploss candle lookback |
| v_input_7 | true | Close if EMA crosses in oposite direction |
| v_input_8 | true | Allow price retracing |
Source Pine Script
/*backtest
start: 2023-12-03 00:00:00
end: 2023-12-10 00:00:00
period: 30m
basePeriod: 15m
exchanges: [{"eid":"Futures_Binance","currency":"BTC_USDT"}]
*/

// This source code is subject to the terms of the Mozilla Public License 2.0 at https://mozilla.org/MPL/2.0/
// © EduardoMattje

//@version=4
strategy("Reversal closing price", overlay=true, default_qty_type=strategy.percent_of_equity, default_qty_value=10, initial_capital=10000)

src = input(hl2, "Price source")
order_direction = input("Both", "Order direction", options=["Both", "Long", "Short"])

// EMA calculation and plot

ema_long_period = input(80, "EMA long period")
ema_short_period = input(8, "EMA short period")
ema_long = ema(src, ema_long_period)
ema_short = ema(src, ema_short_period)
ema_bull = ema_short > ema_long
ema_bear = ema_short < ema_long
plot(ema_long, "EMA long", ema_bull ? color.green : color.red, 3)
plot(ema_short, "EMA short", ema_bull ? color.green : color.red, 3)

// Settings

risk_reward_ratio = input(2.0, "Risk to reward ratio", minval=1.0, step=0.1)
stop_lookback = input(3, "Stoploss candle lookback", minval=1)
ema_cross_stop = input(true, "Close if EMA crosses in oposite direction")
allow_retracing = input(true, "Allow price retracing")

// RCP calculation

rcp_bull = low[0] < low[1] and low[0] < low[2] and close[0] > close[1]
rcp_bear = high[0] > high[1] and high[0] > high[2] and close[0] < close[1]

// Order placement

in_market = strategy.position_size != 0

long_condition = rcp_bull and ema_bull and not in_market and order_direction != "Short"
short_condition = rcp_bear and ema_bear and not in_market and order_direction != "Long"

bought = strategy.position_size[0] > strategy.position_size[1] and strategy.position_size[1] == 0
sold = strategy.position_size[0] < strategy.position_size[1] and strategy.position_size[1] == 0
closed = not in_market and in_market[1]

long_position = strategy.position_size > 0
short_position = strategy.position_size < 0

buy_price = high + syminfo.mintick
sell_price = low - syminfo.mintick

if long_condition
    strategy.entry("Long", true, stop=buy_price)
if short_condition
    strategy.entry("Short", false, stop=sell_price)

if allow_retracing
    better_price_long = barssince(closed) > barssince(long_condition) and barssince(long_condition) >= 1 and not in_market and ema_bull and buy_price < valuewhen(long_condition, buy_price, 0) and buy_price[0] < buy_price[1]
    if better_price_long
        strategy.cancel("Long")
        strategy.entry("Long", true, stop=buy_price)

    better_price_short = barssince(closed) > barssince(short_condition) and barssince(short_condition) >= 1 and not in_market and ema_bear and sell_price > valuewhen(short_condition, sell_price, 0) and sell_price[0] > sell_price[1]
    if better_price_short
        strategy.cancel("Short")
        strategy.entry("Short", false, stop=sell_price)

// Stoploss orders

stop_price = long_position ? valuewhen(bought, lowest(stop_lookback)[1] - syminfo.mintick, 0) : short_position ? valuewhen(sold, highest(3)[1] + syminfo.mintick, 0) : na
stop_comment = "Stoploss triggered"
strategy.close("Long", low <= stop_price, stop_comment)
strategy.close("Short", high >= stop_price, stop_comment)
plot(stop_price, "Stop price", color.red, 2, plot.style_linebr)

// EMA cross close orders

if ema_cross_stop
    if long_position and ema_bear
        strategy.close("Long", comment=stop_comment)
    if short_position and ema_bull
        strategy.close("Short", comment=stop_comment)

// Take profit orders

stop_ticks = abs(strategy.position_avg_price - stop_price)
take_profit_price = long_position ? valuewhen(bought, strategy.position_avg_price + stop_ticks * risk_reward_ratio, 0) : short_position ? valuewhen(sold, strategy.position_avg_price  - (stop_ticks * risk_reward_ratio), 0) : na
target_comment = "Take profit"
strategy.close("Long", high >= take_profit_price, target_comment)
strategy.close("Short", low <= take_profit_price, target_comment)
plot(take_profit_price, "Target price", color.green, 2, plot.style_linebr)
Published by ChaoZhang on the FMZ strategy square · last modified 2023-12-11. Collected in the Quant Trading Vault. Unvalidated research: re-test with your own data and costs before trusting it.
Build this with AgenKit
A spec is not a trading system. Paste this into your coding agent and AgenKit runs a specialist team — architecture, test-first build, risk gates, review — with paper trading on by default.
/agenkit build a production-grade trading bot with a backtest engine, risk controls and paper trading by default from strategies/Reversal-Closing-Price-Breakout-Strategy-with-Oscillating-Stop-Loss.md- npx agenkit install engineering-kit in your project
- Paste the command into your agent and approve each phase
- Get tests, backtest, risk controls and a paper-trading switch
Understand it first
Before you run this, read the lesson behind the idea and how to backtest it honestly. Specs like this one are the survivors of an unknown number of trials; deflate their results accordingly.
Related specs
- Adaptive Multi Period Trading Strategy Based on Wave Trend Momentum BreakoutPine Script · Breakout · 2h
- BB Breakout StrategyPine Script · Breakout · 1d
- BMSB Breakout Strategy BMSBPine Script · Breakout · 1h
- Bollinger Band T3 Moving Average StrategyPine Script · Breakout · 10m
- Bollinger Bands Dual track Breakthrough StrategyPine Script · Breakout · 30m
- Bollinger Breakout StrategyPine Script · Breakout · 30m