Strategy vault / Trend following
Robust Trend Continuation Strategy
This strategy is based on moving averages. It goes long after a short-term correction in an upward trend. It belongs to the trend following strategy.
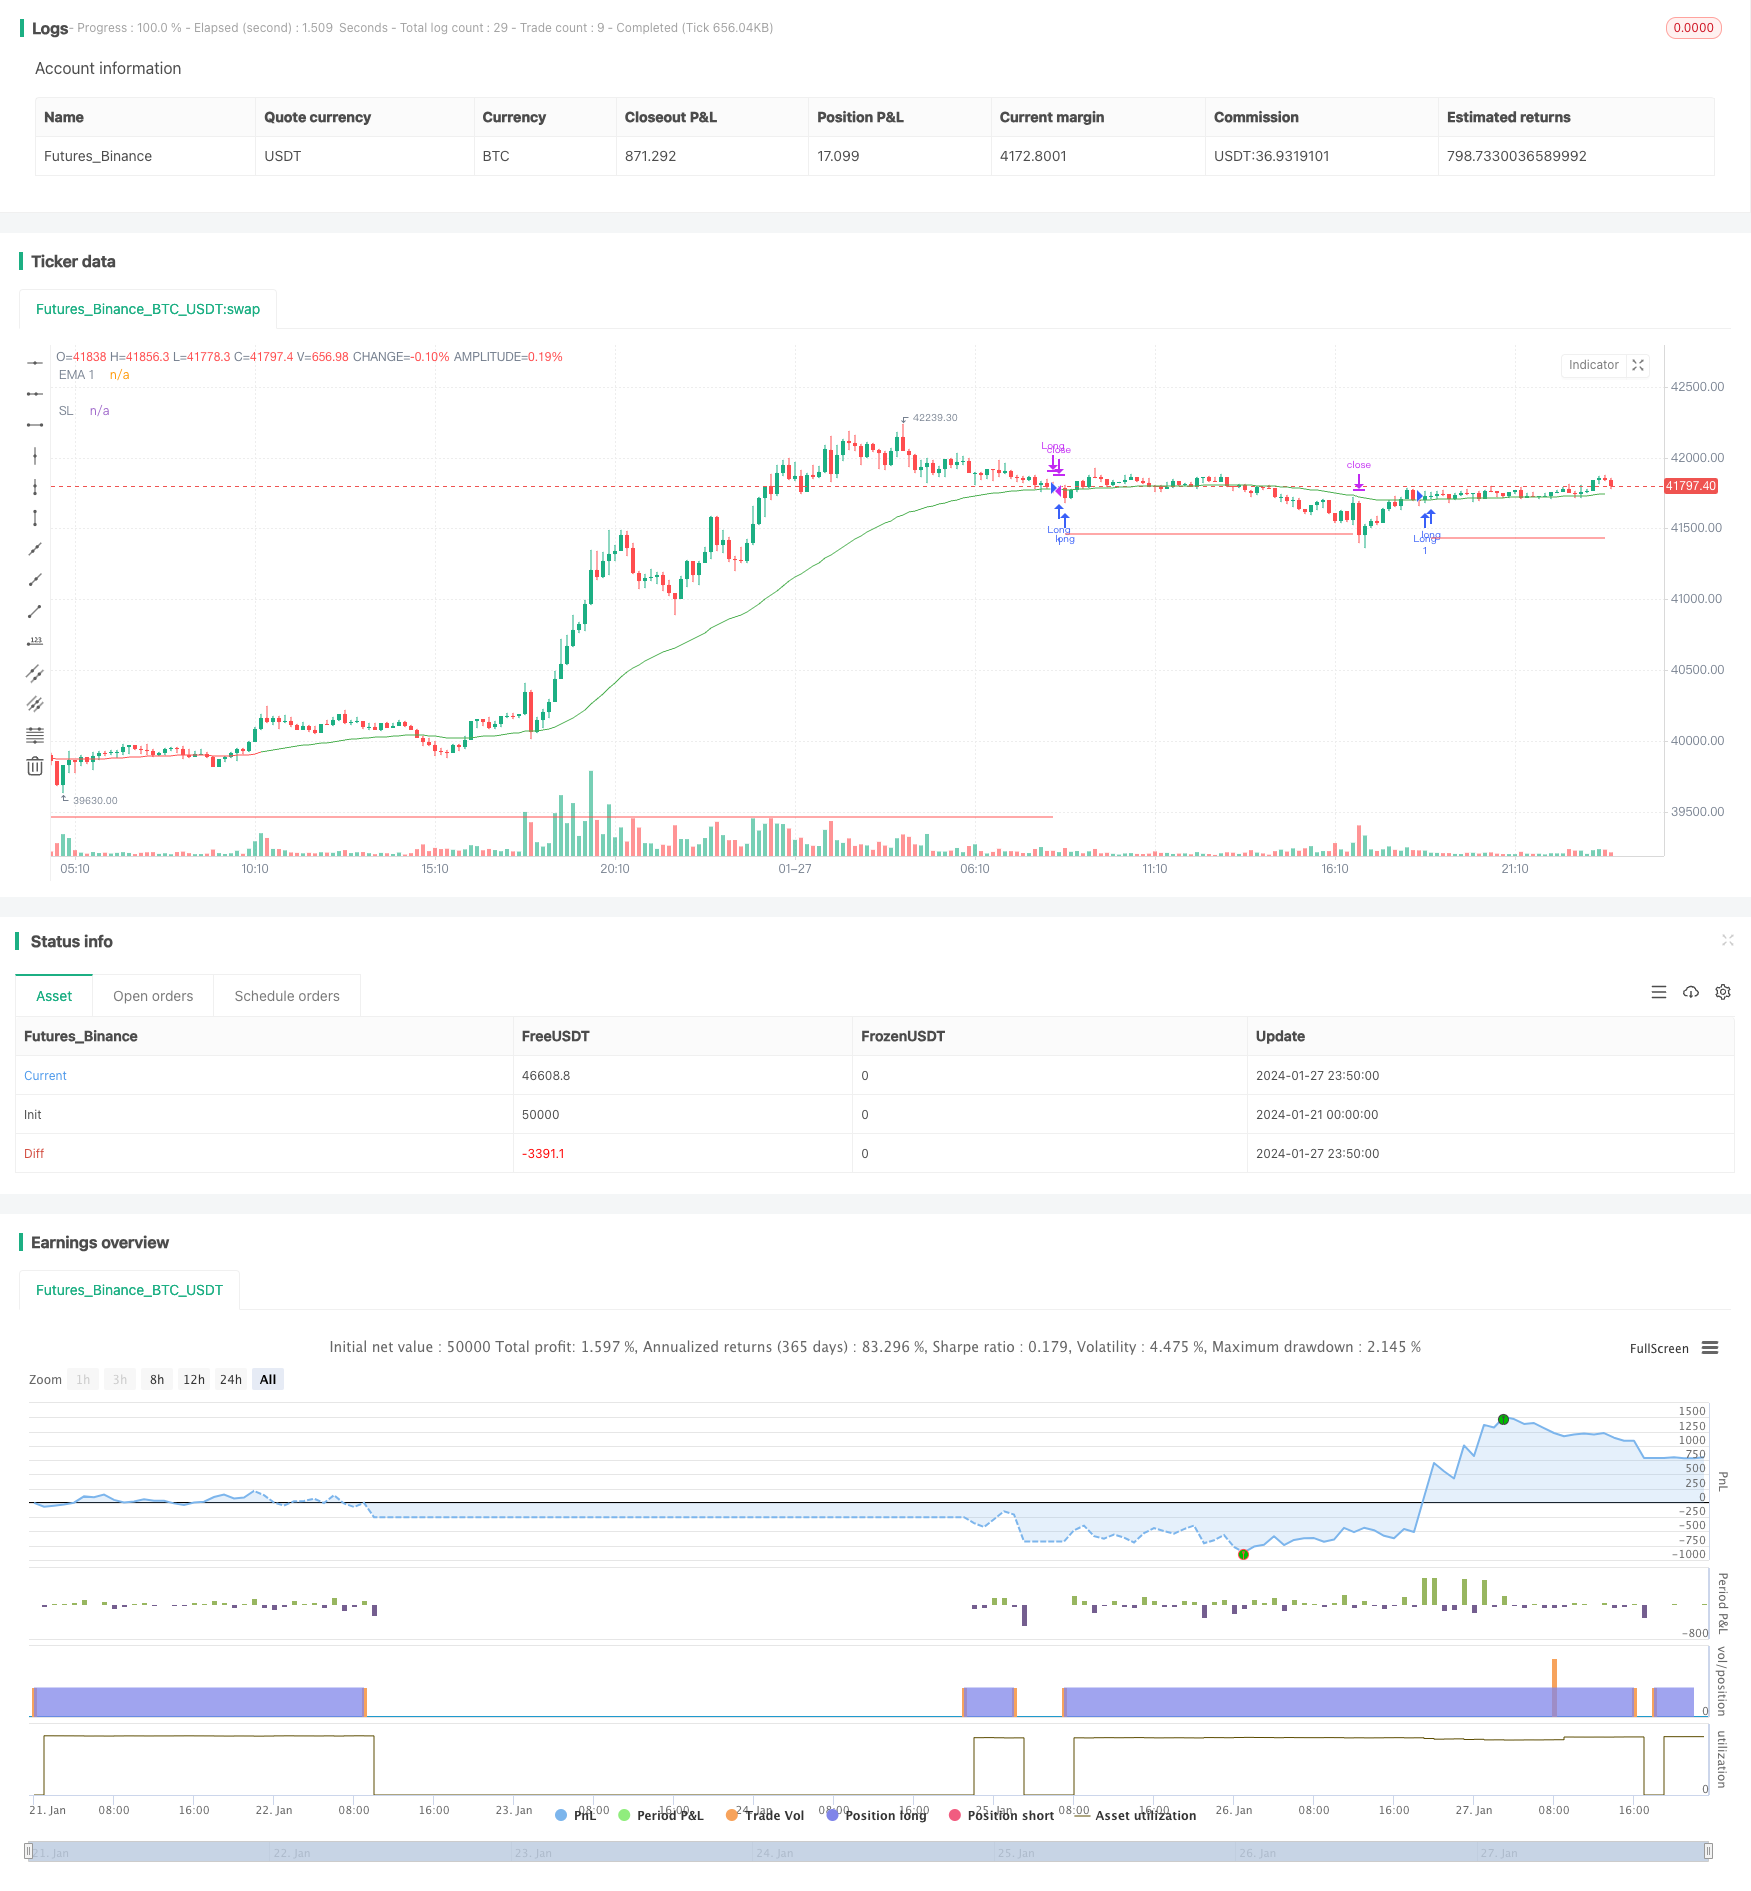
Overview
This strategy is based on moving averages. It goes long after a short-term correction in an upward trend. It belongs to the trend following strategy.
Strategy Principle
This strategy uses 3 EMA lines with different periods. The EMA1 line with shorter period is used to judge the short-term trend. The EMA2 and EMA3 lines with longer periods are used to determine the mid-long term trend, where EMA3 has the longest period. When the short-term EMA1 line goes up, it indicates that it is in a short-term upward trend. If EMA2 is above EMA3, it means the mid-long term is also in upward trend, so this is a good timing for long entry. Specifically, the trading signal is generated when the price crosses above the EMA1 line. To further verify the stability of the trend, it requires that EMA2 and EMA3 are pointing up and the last bar is also rising in the signal generation bar, which helps filter out wrong signals from short-term corrections.
The stop loss line and take profit line are set to lock in profits and losses. Specifically, the stop loss line moves according to the ATR value, and the take profit line also moves based on the ATR value.
Advantage Analysis
The biggest advantage of this strategy is that it can effectively capture the mid-long term upward trend, while also taking into account the short-term correction, which makes its holding time and profit space considerable.
In addition, the setting of stop loss and take profit also makes its risk controllable.
Risk Analysis
The biggest risk of this strategy is that it cannot determine the trend reversal point. If the mid-long term trend reverses while the short term is still rising, it will generate a wrong long signal to enter the market, which may cause greater loss.
In addition, unnecessary trading losses may also occur in range-bound markets.
Optimization Directions
Consider adjusting the cycle parameters of EMA based on the characteristics of specific trading varieties to better match the mid-long cycle of the variety.
Combining with other indicators to determine the end of short-term adjustments can avoid wrong entry.
Consider adjusting the stop loss coefficient based on the ATR value, appropriately relaxing the stop loss distance when ATR is large.
Conclusion
In general, this strategy is a mid-long term trend following strategy that performs well. It determines the trend direction through moving averages, entry timing through pullback signals, and locks in profits and losses through stop loss and take profit settings. But there is also a certain risk of blind trend following. Traders need to make their own judgment on the market to decide whether to enter.
Parameters
| Name | Default | What it controls |
|---|---|---|
| v_input_1_close | 0 | price: close | high | low | open | hl2 | hlc3 | hlcc4 | ohlc4 |
| v_input_int_1 | 50 | EMA 1 Length |
| v_input_int_2 | 80 | EMA 2 Length |
| v_input_int_3 | 200 | EMA 3 Length |
| v_input_2 | true | numberOfCandles |
| v_input_3 | 3.5 | slATRFactor |
| v_input_4 | 3.5 | tpATRFactor |
| v_input_5 | 14 | ATRLength |
Source Pine Script
/*backtest
start: 2024-01-21 00:00:00
end: 2024-01-28 00:00:00
period: 10m
basePeriod: 1m
exchanges: [{"eid":"Futures_Binance","currency":"BTC_USDT"}]
*/

//@version=5
strategy('Trend Continuation', shorttitle='Trend_Continuation', overlay=true)

// Input
price = input(close)
MA1_Length = input.int(50, step=1, title='EMA 1 Length')
MA2_Length = input.int(80, step=1, title='EMA 2 Length')
MA3_Length = input.int(200, step=1, title='EMA 3 Length')
numberOfCandles = input(1)
slATRFactor = input(3.5)
tpATRFactor = input(3.5)
ATRLength = input(14)
// switch1=input(true, title="Show Bar Color?")
// switch2=input(true, title="Show Moving Averages?")

// Calculation
MA1 = ta.ema(price, MA1_Length)
MA2 = ta.ema(price, MA2_Length)
MA3 = ta.ema(price, MA3_Length)
prev_price = close[numberOfCandles]


// Strategy
allPositive = true
for i = 0 to numberOfCandles - 1 by 1
    if close[i] < close[i + 1] or close[i] < MA1
        allPositive := false
        break


long = MA2 > MA3 and price > MA1 and ta.crossunder(prev_price, MA1) and allPositive
// short = crossover(price, MA3) or ( change(price)>0 and change(MA1)>0 and crossover(price,MA1)  and change(MA2)<0 )


if long
    strategy.entry('Long', strategy.long, comment='Long')

bought = strategy.position_size[0] > strategy.position_size[1]
atrAtLong = ta.valuewhen(bought, ta.atr(ATRLength), 0)


// Stop loss and take profit
slPrice = strategy.position_avg_price - slATRFactor * atrAtLong
tpPrice = strategy.position_avg_price + tpATRFactor * atrAtLong

SL = plot(slPrice, title='SL', style=plot.style_linebr, linewidth=1, color=color.new(color.red, 0))

if price >= tpPrice and price < MA1
    strategy.close('Long')

if price < strategy.position_avg_price
    strategy.exit('Stop Loss', 'Long', stop=slPrice)


// Strategy Alert
alertcondition(long, title='Long Alert', message='Go Long!')
// alertcondition(short, title='EMA Slope + EMA Cross Strategy, Short Alert', message='Go Short!')

// MA trend bar color
// up =  change(MA2)>0 and change(MA3)>0
// dn =  change(MA2)<0 and change(MA3)<0
// bar_color = up?green:dn?red:blue
// barcolor(switch1?bar_color:na)

// MA trend output color
change_1 = ta.change(MA2)
MA2_color = ta.change(MA2) > 0 ? color.lime : change_1 < 0 ? color.red : color.blue
change_2 = ta.change(MA3)
MA3_color = ta.change(MA3) > 0 ? color.lime : change_2 < 0 ? color.red : color.blue

// MA output
// EMA2 = plot(switch2?MA2:na, title="EMA 2", style=linebr, linewidth=2, color=MA2_color)
// EMA3 = plot(switch2?MA3:na, title="EMA 3", style=linebr, linewidth=4, color=MA3_color)
// fill(EMA2, EMA3, color=silver, transp=50)

color_1 = MA2 > MA3 ? color.green : color.red

EMA1 = plot(MA1, title='EMA 1', style=plot.style_linebr, linewidth=1, color=color_1)
// EMA2 = plot(MA2, title="EMA 2", style=linebr, linewidth=2, color=blue)
// EMA3 = plot(MA3, title="EMA 3", style=linebr, linewidth=3, color=red)


//plot(strategy.equity, title="equity", color=red, linewidth=2, style=areabr)
Published by ChaoZhang on the FMZ strategy square · last modified 2024-01-29. Collected in the Quant Trading Vault. Unvalidated research: re-test with your own data and costs before trusting it.
Build this with AgenKit
A spec is not a trading system. Paste this into your coding agent and AgenKit runs a specialist team — architecture, test-first build, risk gates, review — with paper trading on by default.
/agenkit build a production-grade trading bot with a backtest engine, risk controls and paper trading by default from strategies/Robust-Trend-Continuation-Strategy.md- npx agenkit install engineering-kit in your project
- Paste the command into your agent and approve each phase
- Get tests, backtest, risk controls and a paper-trading switch
Understand it first
Before you run this, read the lesson behind the idea and how to backtest it honestly. Specs like this one are the survivors of an unknown number of trials; deflate their results accordingly.
Related specs
- ATR Dynamic Trend Following and EMA Crossover Trading StrategyPine Script · Trend following · 1d
- ATR and Moving Average Crossover Hybrid StrategyPine Script · Trend following · 1h
- ATR and T3 Moving Average StrategyPine Script · Trend following · 5m
- Adaptive ATR and RSI Trend Following Strategy with Trailing Stop LossPine Script · Trend following · 1h
- Bollinger Bands and RSI Trend Following StrategyPine Script · Trend following · 1h
- Dual ATR Channel Trend Following StrategyPine Script · Trend following · 15m