Strategy vault / Trend following
RSI Alligator Trend Strategy
The RSI Alligator Trend strategy is based on the combination of RSI indicator and Alligator indicator to determine the entry and exit of trends. It uses three moving average lines - the alligator's jaw line, tooth…
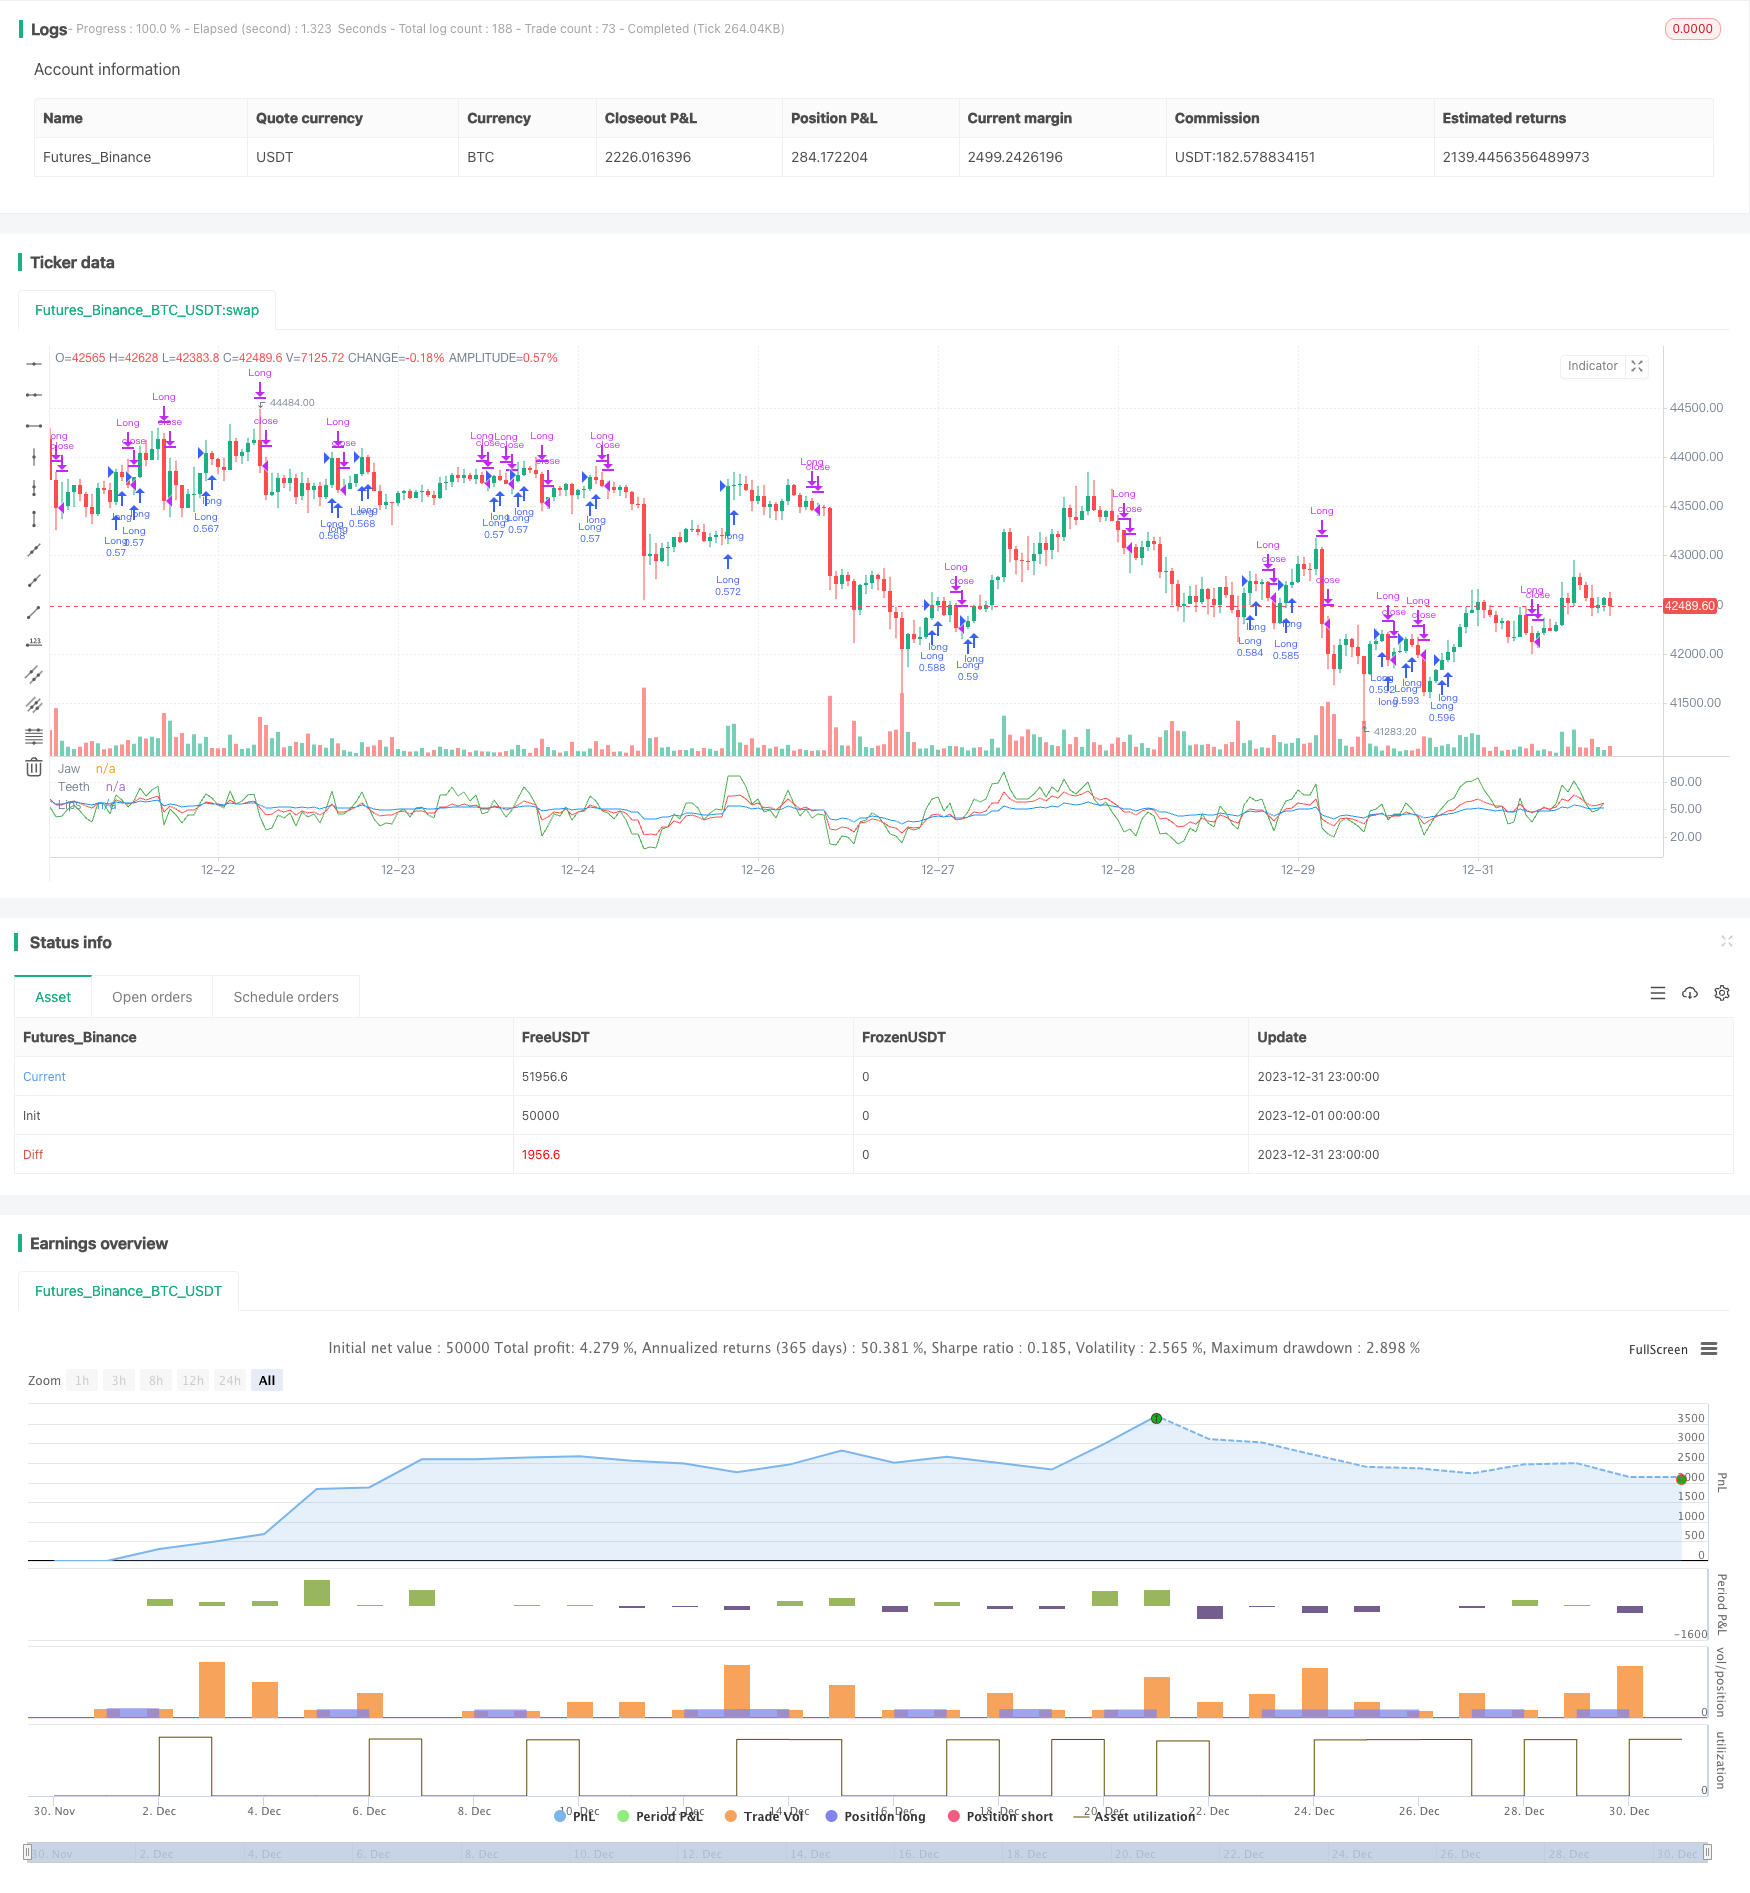
Overview
The RSI Alligator Trend strategy is based on the combination of RSI indicator and Alligator indicator to determine the entry and exit of trends. It uses three moving average lines - the alligator's jaw line, tooth line and lip line, constructed by RSI of different periods. It goes long when the tooth line crosses above the lip line and the RSI jaw line is higher than the tooth line; it goes short when the tooth line crosses below the lip line and the RSI jaw line is lower than the tooth line. The strategy also sets stop loss and take profit conditions.
Strategy Logic
The RSI Alligator Trend strategy builds the three lines of the Alligator indicator using RSI indicator. The specific settings are:
- Jaw line: 5-period RSI line
- Tooth line: 13-period RSI line
- Lip line: 34-period RSI line
The entry signal logic is:
Long signal: when the tooth line crosses above the lip line and the jaw line is higher than the tooth line, go long.
Short signal: when the tooth line crosses below the lip line and the jaw line is lower than the tooth line, go short.
The strategy also sets stop loss and take profit conditions:
- Stop loss is set at 10% below the entry price
- Take profit is set at 90% above the entry price
Strength Analysis
The RSI Alligator Trend strategy has the following strengths:
- Using the Alligator lines to determine the trend can effectively filter out market noise and lock in the major trend
- Combining multiple-period RSI avoids false breakouts and improves signal reliability
- Setting reasonable stop loss and take profit conditions helps stabilize strategy operations
- The strategy idea is clear and easy to understand, the parameter settings are simple, and it is easy to implement for live trading
- It can go both long and short, taking into account both directions of the trend, and has strong flexibility
Risk Analysis
The RSI Alligator Trend strategy also has the following risks:
There may be false breakouts at the crossover between the tooth line and the lip line, leading to unnecessary losses. The cycle parameters can be adjusted to reduce the probability of false breakouts.
The stop loss setting may be too aggressive, with a high probability of unnecessary stop loss. The stop loss range can be appropriately relaxed, or other conditions can be added as prerequisites for activating the stop loss.
If the market moves violently, the stop loss may fail to play its proper role of protecting the margin. In this case, manual intervention is required to stop the loss in time.
When long and short positions switch frequently, the trading cost pressure is greater. The entry conditions can be appropriately relaxed to reduce unnecessary round trips.
Optimization Directions
The RSI Alligator Trend strategy can be optimized in the following aspects:
Optimize the Alligator line parameter settings to find the best parameter combination
Optimize the entry condition logic, such as adding indicators like trading volume to filter signals
Optimize the take profit and stop loss strategies to make them more adaptive to market conditions and margin levels
Add mechanisms to deal with extreme events and avoid exposure to abnormal market conditions
Add open position algorithms to control the proportion of capital invested in a single trade to mitigate risks
Conclusion
In general, the RSI Alligator Trend strategy is a reliable and easy-to-use trend following strategy. It uses the Alligator indicator to determine the trend direction, combined with the RSI indicator to set reference thresholds, which can effectively lock in the trend and set reasonable exit points. At the same time, the strategy itself also has strong flexibility and extensibility, making it worthwhile for live trading and further optimization.
Parameters
| Name | Default | What it controls |
|---|---|---|
| v_input_1 | 70 | Over bought |
| v_input_2 | 30 | Over sold |
| v_input_3 | 5 | Jaw Periods |
| v_input_4 | false | Jaw Offset |
| v_input_5 | 13 | Teeth Periods |
| v_input_6 | false | Teeth Offset |
| v_input_7 | 34 | Lips Periods |
| v_input_8 | false | Lips Offset |
| v_input_9 | 0 | strategyType: Long Only | Long & Short | Short Only |
| v_input_10 | 7 | From Month |
| v_input_11 | true | From Day |
| v_input_12 | 2018 | From Year |
| v_input_13 | 12 | To Month |
| v_input_14 | true | To Day |
| v_input_15 | 2020 | To Year |
| v_input_16 | 10 | Stop Loss % |
| v_input_17 | 90 | Take Profit % |
Source Pine Script
/*backtest
start: 2023-12-01 00:00:00
end: 2023-12-31 23:59:59
period: 1h
basePeriod: 15m
exchanges: [{"eid":"Futures_Binance","currency":"BTC_USDT"}]
*/

// @version=3
// RSI Alligator
// Forked from Author: Reza Akhavan
// Updated by Khalid Salomão

strategy("RSI Alligator Strategy", overlay=false, pyramiding=0, default_qty_type=strategy.cash, default_qty_value=25000, initial_capital=25000, commission_type=strategy.commission.percent, commission_value=0.15, slippage=3)

// === TA LOGIC ===
overBought = input(70, minval=0, maxval=100, title="Over bought")
overSold = input(30, minval=0, maxval=100, title="Over sold")
jawPeriods = input(5, minval=1, title="Jaw Periods")
jawOffset = input(0, minval=0, title="Jaw Offset")
teethPeriods = input(13, minval=1, title="Teeth Periods")
teethOffset = input(0, minval=0, title="Teeth Offset")
lipsPeriods = input(34, minval=1, title="Lips Periods")
lipsOffset = input(0, minval=0, title="Lips Offset")

jaws = rsi(close, jawPeriods)
teeth = rsi(close, teethPeriods)
lips = rsi(close, lipsPeriods)
plot(jaws, color=green, offset=jawOffset, title="Jaw")
plot(teeth, color=red, offset=teethOffset, title="Teeth")
plot(lips, color=blue, offset=lipsOffset, title="Lips")

//
// === Signal logic ===
//
LONG_SIGNAL_BOOLEAN  = crossover(teeth, lips) and jaws > teeth
SHORT_SIGNAL_BOOLEAN = crossunder(teeth, lips) and jaws < teeth

// === INPUT BACKTEST DATE RANGE ===
strategyType = input(defval="Long Only", options=["Long & Short", "Long Only", "Short Only"])

FromMonth = input(defval = 7, title = "From Month", minval = 1, maxval = 12)
FromDay   = input(defval = 1, title = "From Day", minval = 1, maxval = 31)
FromYear  = input(defval = 2018, title = "From Year", minval = 2017)
ToMonth   = input(defval = 12, title = "To Month", minval = 1, maxval = 12)
ToDay     = input(defval = 1, title = "To Day", minval = 1, maxval = 31)
ToYear    = input(defval = 2020, title = "To Year", minval = 2017)

start     = timestamp(FromYear, FromMonth, FromDay, 00, 00)
finish    = timestamp(ToYear, ToMonth, ToDay, 23, 59)
window()  => true

// === STRATEGY BUY / SELL ENTRIES ===

// TODO: update the placeholder LONG_SIGNAL_BOOLEAN and SHORT_SIGNAL_BOOLEAN to signal
// long and short entries
buy()  => window() and LONG_SIGNAL_BOOLEAN
sell() => window() and SHORT_SIGNAL_BOOLEAN

if buy()
    if (strategyType == "Short Only")
        strategy.close("Short")
    else
        strategy.entry("Long", strategy.long, comment="Long")

if sell()
    if (strategyType == "Long Only")
        strategy.close("Long")
    else
        strategy.entry("Short", strategy.short, comment="Short")


// === BACKTESTING: EXIT strategy ===
sl_inp = input(10, title='Stop Loss %', type=float)/100
tp_inp = input(90, title='Take Profit %', type=float)/100

stop_level = strategy.position_avg_price * (1 - sl_inp)
take_level = strategy.position_avg_price * (1 + tp_inp)

strategy.exit("Stop Loss/Profit", "Long", stop=stop_level, limit=take_level)Published by ChaoZhang on the FMZ strategy square · last modified 2024-01-29. Collected in the Quant Trading Vault. Unvalidated research: re-test with your own data and costs before trusting it.
Build this with AgenKit
A spec is not a trading system. Paste this into your coding agent and AgenKit runs a specialist team — architecture, test-first build, risk gates, review — with paper trading on by default.
/agenkit build a production-grade trading bot with a backtest engine, risk controls and paper trading by default from strategies/RSI-Alligator-Trend-Strategy.md- npx agenkit install engineering-kit in your project
- Paste the command into your agent and approve each phase
- Get tests, backtest, risk controls and a paper-trading switch
Understand it first
Before you run this, read the lesson behind the idea and how to backtest it honestly. Specs like this one are the survivors of an unknown number of trials; deflate their results accordingly.
Related specs
- Adaptive ATR and RSI Trend Following Strategy with Trailing Stop LossPine Script · Trend following · 1h
- Adaptive Price Crossing Moving Average Trading StrategyPine Script · Trend following · 1d
- Adaptive Trading Strategy Based on Stochastic RSI Dual Line CrossoverPine Script · Trend following · 4h
- Advanced Multi Indicator Multi Dimensional Trend Cross Quantitative StrategyPine Script · Trend following · 3h
- Advanced Supertrend Indicator Trading Mechanism Optimization StrategyPine Script · Trend following · 1d
- BB Percentage Index Trend Fading StrategyPine Script · Trend following · 1h