RSI and Bollinger Bands Cross Regression Dual Strategy
This strategy is a dual technical analysis trading system based on the Relative Strength Index (RSI) and Bollinger Bands. The strategy combines RSI's overbought/oversold signals with Bollinger Bands' price channel…
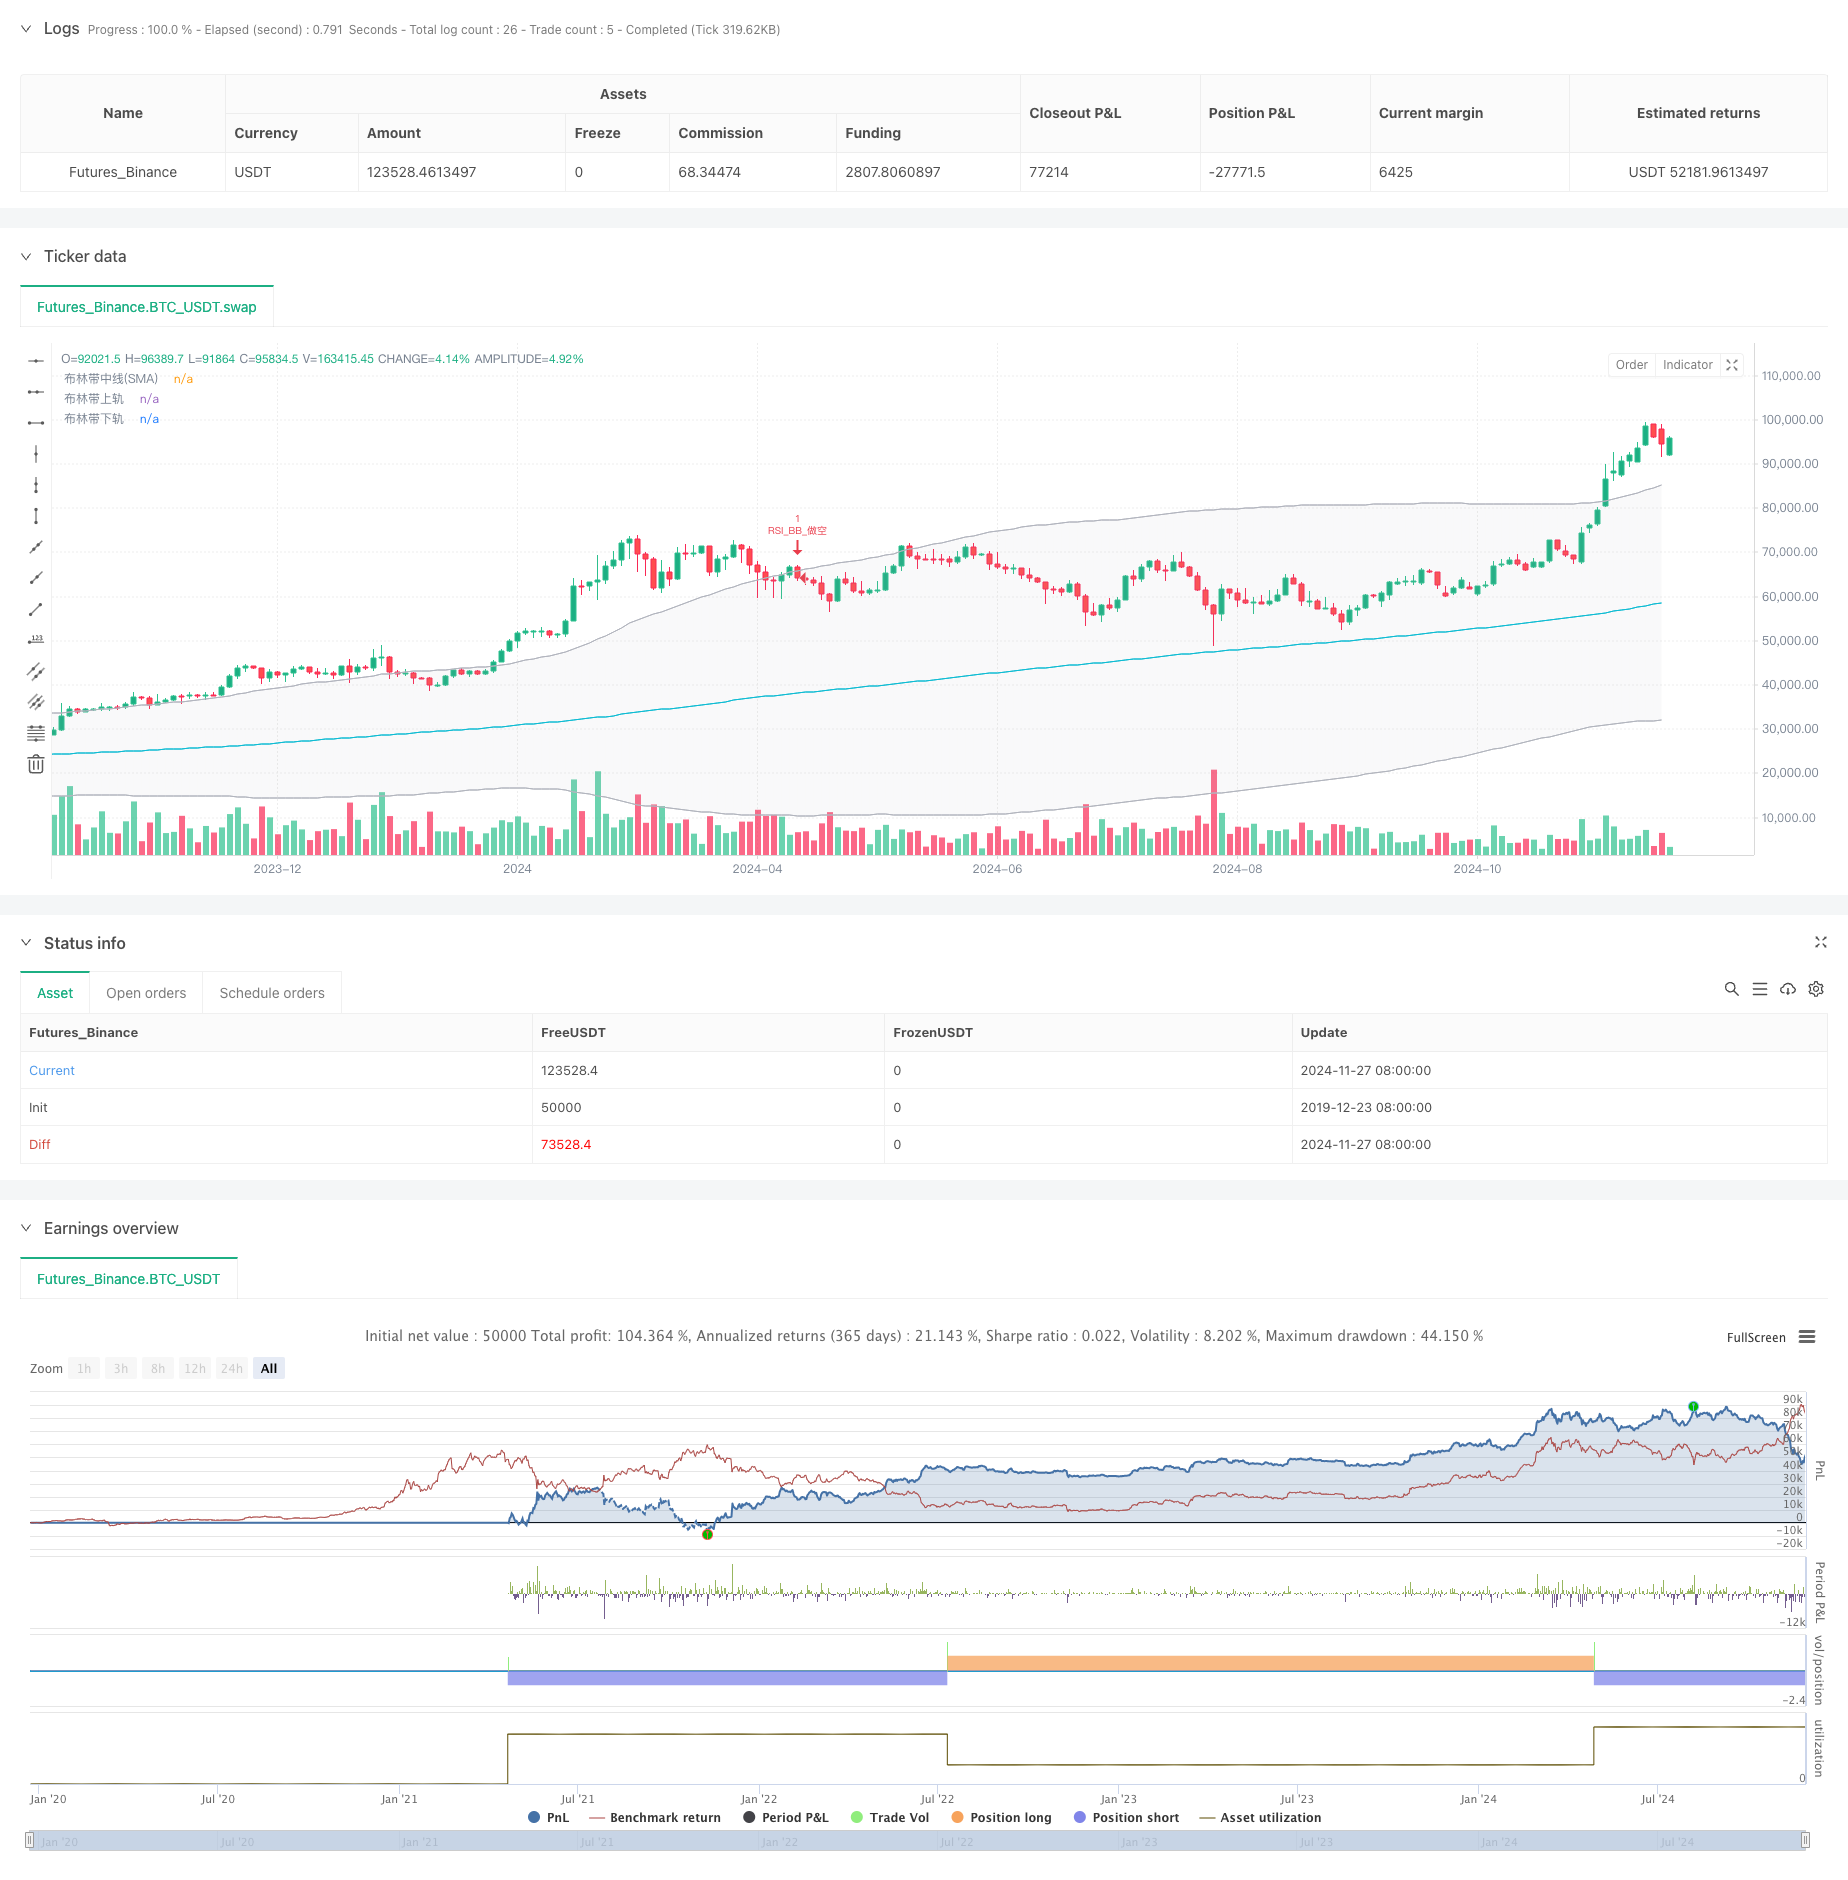
Overview
This strategy is a dual technical analysis trading system based on the Relative Strength Index (RSI) and Bollinger Bands. The strategy combines RSI's overbought/oversold signals with Bollinger Bands' price channel breakout signals to construct a complete trading decision framework. It is particularly suitable for markets with high volatility, achieving risk-controlled trading through strict entry and exit conditions.
Strategy Principle
The core logic is built on the synergy of two main technical indicators:
- RSI uses a 6-period calculation cycle with 50 as the overbought/oversold threshold.
- Bollinger Bands use a 200-period moving average as the middle band with a 2.0 standard deviation multiplier.
- Long condition: Triggered when RSI breaks above the oversold level (50) while price breaks above the lower Bollinger Band.
- Short condition: Triggered when RSI breaks below the overbought level (50) while price breaks below the upper Bollinger Band.
- Strategy employs OCA (One-Cancels-All) order management to ensure only one active trade at a time.
Strategy Advantages
- Dual confirmation mechanism reduces false signals through RSI and Bollinger Bands confirmation.
- Robust risk control using Bollinger Bands as stop-loss levels.
- Strong adaptability with Bollinger Bands automatically adjusting to market volatility.
- Optimized order management through OCA mechanism improves capital efficiency.
- High parameter adaptability allows optimization for different market characteristics.
Strategy Risks
- Sideways market risk: Frequent false breakouts in range-bound markets.
- Lag risk: Some inherent delay due to moving average calculations.
- Parameter sensitivity: Strategy performance heavily depends on RSI and Bollinger Bands parameters.
- Market environment dependence: Better performance in trending markets, potential underperformance in ranging markets.
Optimization Directions
- Dynamic parameter adjustment: Adapt RSI thresholds based on market volatility.
- Market environment filtering: Add trend indicators for different parameter sets in various market conditions.
- Take-profit optimization: Implement dynamic ATR-based take-profit mechanisms.
- Position management optimization: Adjust position size based on signal strength and market volatility.
- Time filtering: Add trading time window restrictions to avoid unfavorable periods.
Summary
This strategy builds a relatively complete trading system through the synergy of RSI and Bollinger Bands. Its main advantages lie in the dual confirmation mechanism and comprehensive risk control, while attention must be paid to market environment impacts. The proposed optimization directions can further enhance strategy stability and profitability.
Source Pine Script
/*backtest
start: 2019-12-23 08:00:00
end: 2024-11-28 00:00:00
period: 2d
basePeriod: 2d
exchanges: [{"eid":"Futures_Binance","currency":"BTC_USDT"}]
*/

//@version=5
strategy("RSIDual Strategy with Bollinger Bands (by ChartArt) v2.2", shorttitle="CA_RSI_Bollinger Bands Strategy_2.2", overlay=true)

// ChartArtofRSI + Double Bollinger Bands Strategy - Simplified version
//
// Chinese Version 3, BY Henry
// Original idea fromChartArt,2015Year1Moon18day
// Updated toPine Script v5Version, background color removed,KLine color and strategy profit drawing function
//
// Strategy Description:
// Strategy Used in CombinationRSIIndicators and Bollinger Bands.
// When the price is above the upper band andRSISell when overbought,
// When the price is below the lower band andRSIBuy when oversold.
//
// This strategy only applies whenRSISimultaneously with Bollinger Bands
// Triggered when overbought or oversold.

// === Input Parameters ===

// RSIParameters
RSIlength = input.int(6, title="RSIPeriod Length", minval=1)
RSIoverSold = input.int(50, title="RSIOversold Threshold", minval=0, maxval=100)
RSIoverBought = input.int(50, title="RSIOverbought Threshold", minval=0, maxval=100)

// Bollinger Bands parameters
BBlength = input.int(200, title="Bollinger Bands Period Length", minval=1)
BBmult = input.float(2.0, title="Bollinger Bands standard deviation multiplier", minval=0.001, maxval=50)

// === Calculation ===

price = close
vrsi = ta.rsi(price, RSIlength)

// Bollinger Bands calculation
BBbasis = ta.sma(price, BBlength)
BBdev = BBmult * ta.stdev(price, BBlength)
BBupper = BBbasis + BBdev
BBlower = BBbasis - BBdev

// === Drawing ===

plot(BBbasis, color=color.new(color.aqua, 0), title="Bollinger Bands middle line(SMA)")
p1 = plot(BBupper, color=color.new(color.silver, 0), title="Bollinger Band is on track")
p2 = plot(BBlower, color=color.new(color.silver, 0), title="Bollinger Bands are off track")
fill(p1, p2, color=color.new(color.silver, 90))

// === Strategy Logic ===

if (not na(vrsi))
    longCondition = ta.crossover(vrsi, RSIoverSold) and ta.crossover(price, BBlower)
    if (longCondition)
        strategy.entry("RSI_BB_go long", strategy.long, stop=BBlower, oca_name="RSI_BB",  comment="RSI_BB_go long")
    else
        strategy.cancel("RSI_BB_go long")

    shortCondition = ta.crossunder(vrsi, RSIoverBought) and ta.crossunder(price, BBupper)
    if (shortCondition)
        strategy.entry("RSI_BB_go short", strategy.short, stop=BBupper, oca_name="RSI_BB", comment="RSI_BB_go short")
    else
strategy.cancel("RSI_BB_go short")Published by ChaoZhang on the FMZ strategy square · last modified 2024-11-29. Collected in the Quant Trading Vault. Unvalidated research: re-test with your own data and costs before trusting it.
Build this with AgenKit
A spec is not a trading system. Paste this into your coding agent and AgenKit runs a specialist team — architecture, test-first build, risk gates, review — with paper trading on by default.
/agenkit build a production-grade trading bot with a backtest engine, risk controls and paper trading by default from strategies/RSI-and-Bollinger-Bands-Cross-Regression-Dual-Strategy.md- npx agenkit install engineering-kit in your project
- Paste the command into your agent and approve each phase
- Get tests, backtest, risk controls and a paper-trading switch
Understand it first
Before you run this, read the lesson behind the idea and how to backtest it honestly. Specs like this one are the survivors of an unknown number of trials; deflate their results accordingly.
Related specs
- EMA and Bollinger Bands Breakout StrategyPine Script · Breakout · 1h
- Momentum Breakout Moving Average StrategyPine Script · Breakout · 1d
- Momentum Breakout Trading Strategy 440964Pine Script · Breakout · 5m
- Moving Average Crossover and Upper Rail Breakthrough Impulse StrategyPine Script · Breakout · 1m
- Bollinger Bands Breakout Strategy 448080Pine Script · Breakout · 1h
- Enhanced Bollinger Breakout Quantitative Strategy with Momentum Filter Integration SystemPine Script · Breakout · 2d