RSI EMA Trend Breakout Strategy
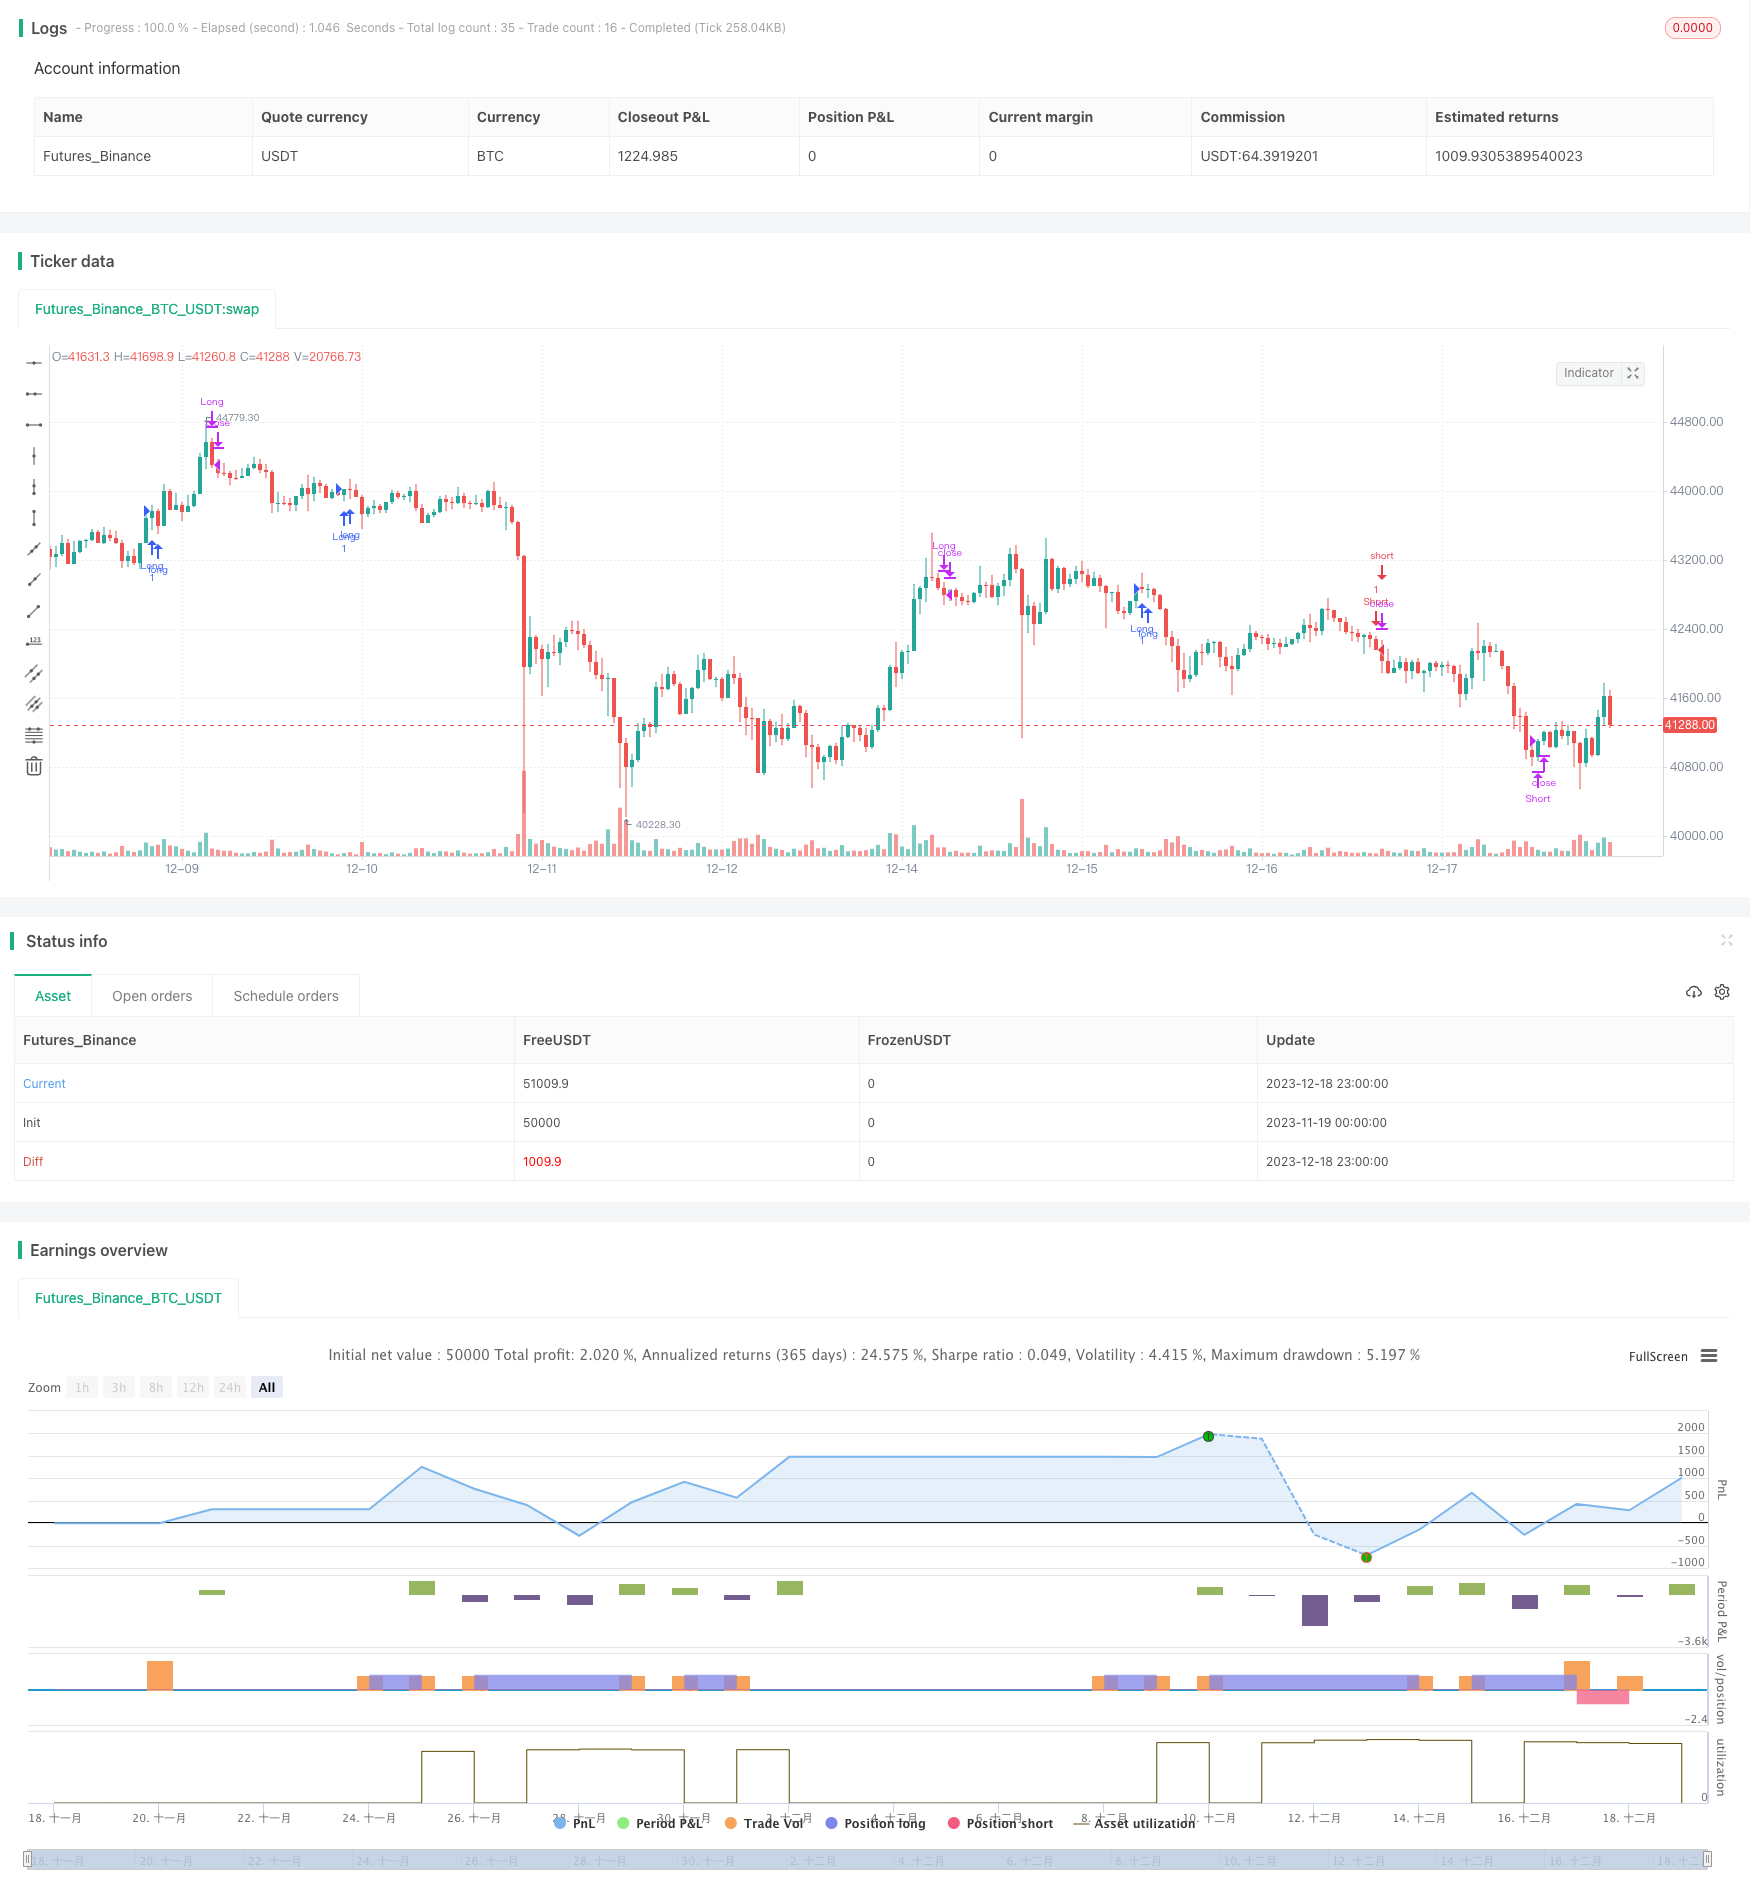
This is a trend following and trend breakout trading strategy based on RSI and EMA indicators. The strategy name is "RSI-EMA Trend Breakout Strategy". It incorporates trend tracking and oscillating indicators to…
Overview
This is a trend following and trend breakout trading strategy based on RSI and EMA indicators. The strategy name is "RSI-EMA Trend Breakout Strategy". It incorporates trend tracking and oscillating indicators to capture the medium-to-long term trend direction and enter at trend breakout points.
Strategy Logic
The strategy uses 5-day EMA, 20-day EMA and 50-day EMA to construct the long and short trend framework. When 5-day EMA crosses over 20-day EMA, and both EMAs are above 50-day EMA, it determines a recent bullish trend breakout for long entry. When 5-day EMA crosses below 20-day EMA, and both EMAs are below 50-day EMA, it determines a recent bearish trend breakout for short entry.
Meanwhile, the strategy also incorporates the RSI indicator to judge if it reaches overbought or oversold zones. RSI can effectively identify overbought and oversold conditions to avoid wrong signals when trend topping or consolidating. When RSI indicator moves from overbought to neutral zone, long position exits. When RSI indicator moves from oversold to neutral zone, short position exits.
Advantage Analysis
This strategy combines EMA and RSI indicators, which can capture medium-to-long term trends and avoid risks at trend ending, with very good risk-reward ratio characteristics. The main advantages are:
- EMA judges trend direction smoothly based on prices
- RSI avoids buying overbought zones and selling oversold zones to mitigate risks
- The strategy has relatively low trading frequency, suitable for medium-to-long term holding, reducing trading and slippage costs
Risk Analysis
There are also some risks in this strategy:
- In ranging markets, EMA and RSI will produce more wrong signals, leading to excessive invalid trades
- Breakout failures happen a lot, so stop loss should be set to control losses
- In some trending markets, RSI does not enter overbought or oversold zones. Using RSI for entry and take profit will miss some opportunities
To reduce these risks, we can set stop loss, adjust RSI parameters, or incorporate other indicators for confirmation.
Optimization Directions
There is room for further optimization of this strategy:
- Test different parameter combinations like EMA periods, RSI parameters to find the optimal
- Incorporate other indicators like MACD, Bollinger Bands to confirm trading signals and reduce errors
- Use machine learning etc. methods to dynamically optimize parameter settings
- Build trend judging system to dynamically adjust strategy parameters in different market environments
Conclusion
This RSI-EMA trend breakout strategy comprehensively considers trend tracking and entry timing judgment to capture trend profits on the basis of risk control. It is a very practical medium-to-long term strategy. We can further improve the stability and profitability through parameter optimization, adding other indicators etc.
Source Pine Script
/*backtest
start: 2023-11-19 00:00:00
end: 2023-12-19 00:00:00
period: 1h
basePeriod: 15m
exchanges: [{"eid":"Futures_Binance","currency":"BTC_USDT"}]
*/

// This source code is subject to the terms of the Mozilla Public License 2.0 at https://mozilla.org/MPL/2.0/
// © BrendanW98

//@version=4
strategy("My Strategy", overlay=true)

ema5 = ema(close, 9)
ema20 = ema(close, 21)
ema50 = ema(close, 55)

//RSI Signals
// Get user input
rsiSource = close
rsiLength = 14
rsiOverbought = 70
rsiOversold = 30
rsiMid = 50
// Get RSI value
rsiValue = rsi(rsiSource, rsiLength)

//See if RSI crosses 50
doBuy = crossover(rsiValue, rsiOversold) and rsiValue < 50
doSell = crossunder(rsiValue, rsiOverbought) and rsiValue > 50

emacrossover = crossover(ema5, ema20) and ema5 > ema50 and ema20 > ema50 and close > ema50
emacrossunder = crossunder(ema5, ema20) and ema5 < ema50 and ema20 < ema50 and close < ema50

//Entry and Exit
longCondition = emacrossover
closelongCondition = doSell

strategy.entry("Long", strategy.long, 1, when=longCondition)
strategy.close("Long", when=closelongCondition)


shortCondition = emacrossunder
closeshortCondition = doBuy

strategy.entry("Short", strategy.short, 1, when=shortCondition)
strategy.close("Short", when=closeshortCondition)
Published by ChaoZhang on the FMZ strategy square · last modified 2023-12-20. Collected in the Quant Trading Vault. Unvalidated research: re-test with your own data and costs before trusting it.
Build this with AgenKit
A spec is not a trading system. Paste this into your coding agent and AgenKit runs a specialist team — architecture, test-first build, risk gates, review — with paper trading on by default.
/agenkit build a production-grade trading bot with a backtest engine, risk controls and paper trading by default from strategies/RSI-EMA-Trend-Breakout-Strategy.md- npx agenkit install engineering-kit in your project
- Paste the command into your agent and approve each phase
- Get tests, backtest, risk controls and a paper-trading switch
Understand it first
Before you run this, read the lesson behind the idea and how to backtest it honestly. Specs like this one are the survivors of an unknown number of trials; deflate their results accordingly.
Related specs
- Momentum Breakout Moving Average StrategyPine Script · Breakout · 1d
- Momentum Breakout Trading Strategy 440964Pine Script · Breakout · 5m
- Moving Average Crossover and Upper Rail Breakthrough Impulse StrategyPine Script · Breakout · 1m
- Quadruple Crossing StrategyPine Script · Breakout · 1h
- Bollinger Bands Breakout Trend Trading StrategyPine Script · Breakout · 4h
- Double Strong Indicators StrategyPine Script · Breakout · 1d