Strategy vault / Trend following
RSI Trend Following Strategy
This strategy combines the RSI indicator and the weighted moving average to achieve trend following trading. When the RSI is above 60, it is bullish, when the RSI is below 40, it is bearish, and the moving average is…
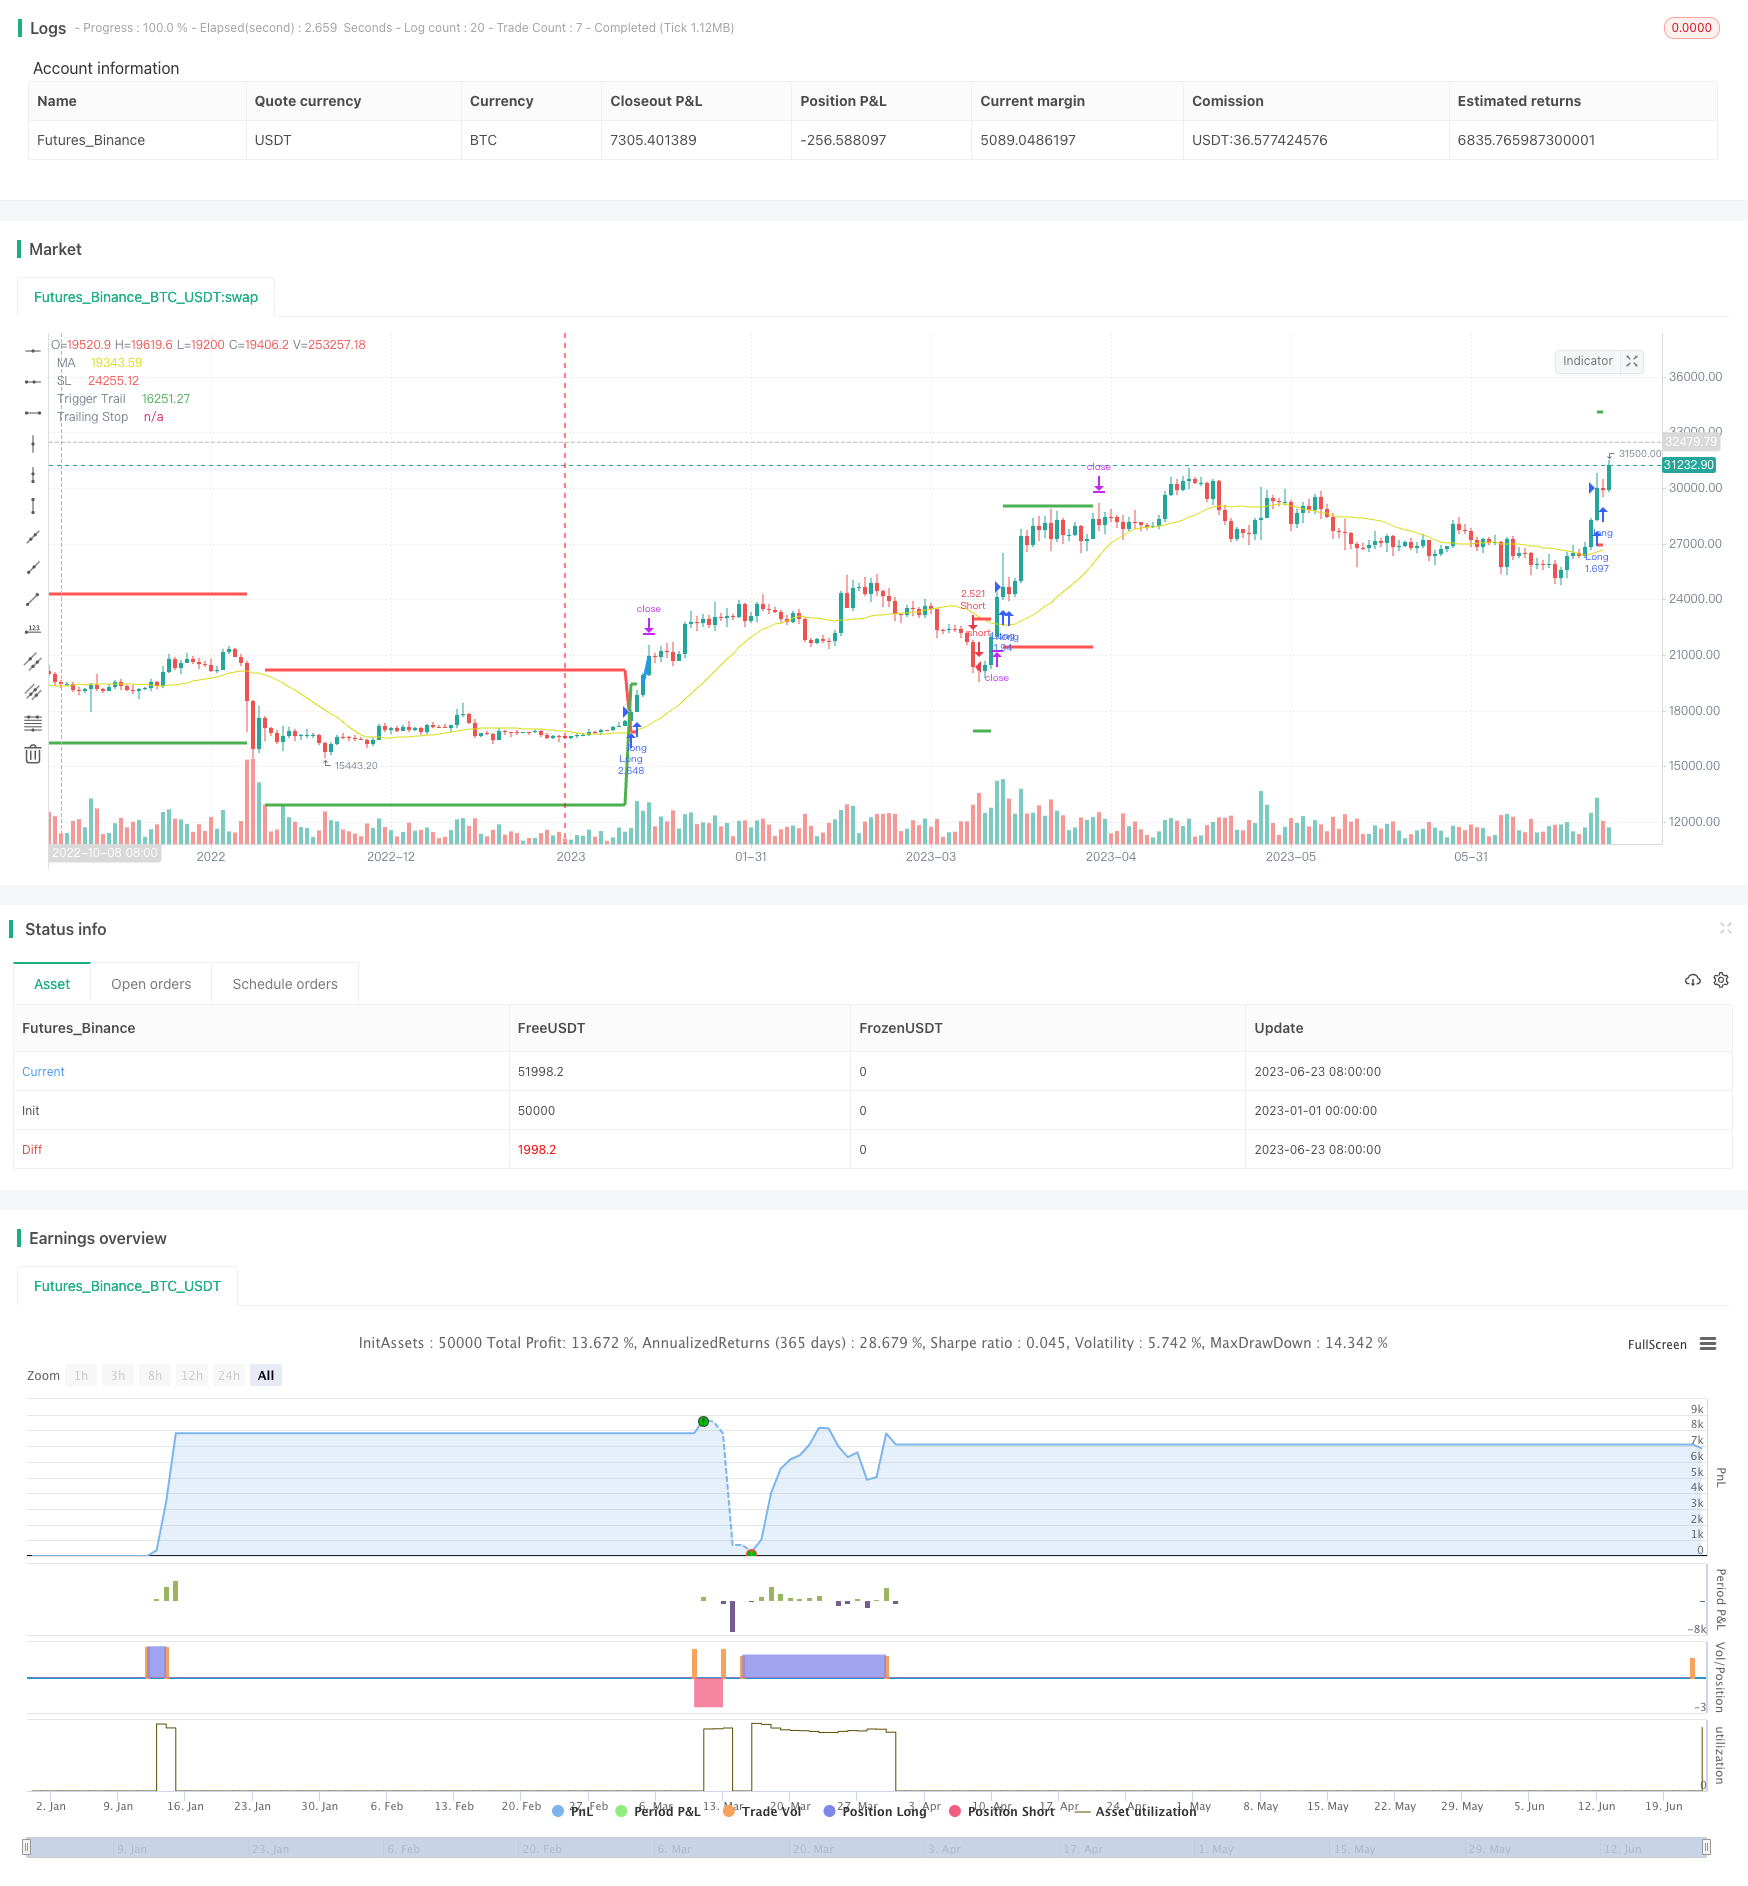
Overview
This strategy combines the RSI indicator and the weighted moving average to achieve trend following trading. When the RSI is above 60, it is bullish, when the RSI is below 40, it is bearish, and the moving average is required to meet the trend condition. Use the 40-period RSI as a trend following indicator. Weighted moving averages reduce the impact of short-term fluctuations by using different weights. The strategy sets both stop loss and trailing take profit to control risk.
Strategy Principle
The strategy first calculates the RSI and weighted moving averages. The RSI length is 20 periods, the weighted moving average length is 20, and the weight is set larger to reduce the impact of short-term fluctuations. When the RSI is greater than 60 and the change rate of the weighted moving average is less than -1%, perform a long operation; when the RSI is less than 40 and the change rate of the weighted moving average is greater than 1%, perform a short operation.
After going long or short, a stop loss order and a trailing take profit order will be set at the same time. The stop loss is 3 times ATR from the current price; the moving take profit is initially activated at a price 4 times ATR from the current price, and then moves at a rate of 3%. When the price hits the stop loss or moving take profit activation price, the corresponding position will be closed.
This strategy also adds fund management rules and adjusts positions through a fixed ratio method. Whenever profit or loss reaches a fixed amount, increase or decrease the trading volume by a fixed amount.
Advantage Analysis
- Use RSI Indicator for Trend Assessment, Able to Effectively Follow Trends
- Weighted Moving Average Reduces the Impact of Short-Term Fluctuations Through Different Weights to Avoid Being Trapped
- Use moving take-profit to maximize profits
- Fixed ratio method fund management effectively controls risks
The overall advantage of this strategy is that it can track the trend and take stop-loss and trailing take-profit measures to control risks, thereby obtaining better returns in strong market conditions.
Risk Analysis
- RSIIncorrect signals from indicators may lead to unnecessary trades
- Forced Stop Loss When Breaking Stop Loss or Moving Profit Price, Cannot Continuously Follow Trend
- Risk Management Rules May Be Too Aggressive, Causing Large Losses
The main risk of this strategy lies in the reliability of the RSI indicator and whether the stop-loss and moving take-profit settings are reasonable. If the parameters are set improperly, it may lead to unnecessary closing of positions or losses beyond tolerance. In addition, when the stop loss or take profit price is exceeded, you may be forced to stop the loss and lose the opportunity to continue to follow the trend.
You can consider optimizing RSI parameters or using other indicators to assist judgment. Adjust stop loss, moving and take profit parameters to suit different varieties and fluctuation conditions. Finally, fund management rules must be set prudently and not be too aggressive to avoid exceeding risk tolerance.
Optimization Direction
- Try Other Indicators Combined with RSI for Signal Confirmation, Such as KD, MACD, etc.
- Optimize the stop-loss moving and take-profit parameters according to the characteristics and fluctuation range of different varieties
- Try Other Money Management Methods, Such as Fixed Volume Trading, Kelly Formula, etc.
- Add opening conditions, such as breaking through Bollinger Bands, RSI divergence, etc.
- Consider Adding Exit Price, Increase Positions in Strong Trends
This strategy can be optimized from many aspects. The first is to look for other technical indicators that can assist or confirm the RSI indicator and improve signal reliability. Secondly, it is very critical to optimize the stop loss and moving take profit parameters according to the characteristics of specific varieties. You can test the revenue effects of different parameters on historical data. Money management can also be adapted to other types of methods. Finally, the conditions for opening and adding positions can be further optimized, and positions can be added appropriately when the trend is strong.
Summary
The overall idea of this RSI trend tracking strategy is clear. The core is to use RSI to judge the trend direction, and to assist with the weighted moving average to improve the accuracy of judgment. The advantage of the strategy is that it can track trends and lock in profits to the maximum extent, while also setting up stop losses and fund management to control risks. However, the reliability of the RSI indicator is low and there is room for optimization in parameter settings. We can start by optimizing signal indicators, stop-loss moving and take-profit parameters, and fund management methods to make the strategy more suitable for different varieties and achieve better results.
||
Overview
This strategy combines the RSI indicator and weighted moving average for trend following trading. It goes long when RSI is above 60 and goes short when RSI is below 40, with the moving average verifying the trend condition. The 40-period RSI acts as a trend following indicator. The weighted moving average uses different weights to reduce the impact of short-term fluctuations. The strategy also employs stop loss and trailing take profit to control risks.
Strategy Logic
The strategy firstly calculates the RSI and weighted moving average. The RSI length is 20 periods and the weighted MA length is 20 with higher weights that reduce the impact of short-term volatility. It goes long when RSI is above 60 and weighted MA rate of change is below -1%. It goes short when RSI is below 40 and weighted MA rate of change is above 1%.
After opening long or short, stop loss and trailing take profit orders are placed simultaneously. The stop loss is set at 3 ATR from the current price. The initial trailing take profit activation is 4 ATR away, and trails in 3% increments. When price hits either stop loss or trailing take profit activation, the position will be closed.
The strategy also incorporates money management rules based on the fixed fractional position sizing approach. Whenever PNL hits a fixed amount, the order size is increased or decreased by a fixed amount.
Advantage Analysis
- RSI indicator can effectively track trends
- Weighted MA reduces the impact of short-term fluctuations, avoiding whipsaws
- Trailing take profit allows profits to be maximized
- Fixed fraction position sizing controls risk effectively
The overall edge is the ability to follow trends, while taking stop loss and trailing take profit measures to control risks, thus capturing significant gains in strong trends.
Risk Analysis
- False signals from RSI may cause unnecessary trades
- Forced to stop out when price breaches stop or trailing take profit levels, unable to keep following trends
- Aggressive money management rules may lead to large losses
The main risks come from the reliability of RSI signals and the stop loss/trailing take profit settings. Incorrect parameters may result in unnecessary closing of trades or losses beyond risk appetite. Breaking stop loss/take profit may also force unwarranted stop outs, losing the chance to continue trend trading.
Solutions include optimizing RSI parameters or adding other indicators for signal confirmation. Adjust stop/trailing take profit levels based on different products and volatility conditions. Also be prudent with money management rules to avoid excessive risks.
Optimization Directions
- Test other indicators together with RSI for signal confirmation, e.g. KD, MACD etc
- Optimize stop loss and trailing take profit parameters based on product characteristics and volatility range
- Try other money management techniques like fixed size trading, Kelly formula etc
- Add entry conditions like Bollinger breakouts, RSI divergences etc
- Consider adding positions on strong trends
There are many aspects to optimize. First is identifying other indicators to supplement RSI signals. Next critical step is optimizing stop loss/trailing take profit parameters based on historical performance. Money management can also switch to other types. Finally, entry, add-on conditions can be enhanced to pyramiding positions in strong trends.
Summary
The RSI trend following strategy has clear logic, using RSI for trend direction and weighted MA for confirmation. Its strength lies in trend trading, maximizing profits with stops/money management controlling risks. But RSI reliability and parameter optimization need improvement. We can look into enhancing signal indicators, stop/trailing parameters, money management methods etc to make the strategy more robust across different products.
Parameters
| Name | Default | What it controls |
|---|---|---|
| v_input_int_1 | 20 | (?RSI Settings)RSI Length |
| v_input_string_1 | 0 | (?MA Settings)MA Type: RWMA | SMA |
| v_input_int_2 | 20 | MA Length |
| v_input_int_3 | 60 | (?Strategy parameters)RSI Long Signal |
| v_input_int_4 | 40 | RSI Short Signal |
| v_input_float_1 | -1 | ROC MA Long Signal |
| v_input_float_2 | true | ROC MA Short Signal |
| v_input_float_3 | 4 | TP activation in multiple of ATR |
| v_input_float_4 | 3 | Trailing TP in percentage |
| v_input_int_5 | 400 | (?Money Management)Fixed Ratio Value ($) |
| v_input_int_6 | 200 | Increasing Order Amount ($) |
| v_input_1 | timestamp(1 Jan 2018 00:00:00) | (?Backtesting Period)Start Date |
| v_input_2 | timestamp(1 July 2024 00:00:00) | End Date |
Source Pine Script
/*backtest
start: 2023-01-01 00:00:00
end: 2023-06-24 00:00:00
period: 1d
basePeriod: 1h
exchanges: [{"eid":"Futures_Binance","currency":"BTC_USDT"}]
*/

// This source code is subject to the terms of the Mozilla Public License 2.0 at https://mozilla.org/MPL/2.0/
// © gsanson66


//This code is based on RSI and a backed weighted MA
//@version=5
strategy("RSI + MA BACKTESTING", overlay=true, initial_capital=1000, default_qty_type=strategy.fixed, commission_type=strategy.commission.percent, commission_value=0.18)


//------------------------FUNCTIONS---------------------------//

//@function which calculate a retro weighted moving average to minimize the impact of short term reversal
rwma(source, length) =>
    sum = 0.0
    denominator = 0.0
    weight = 0.0
    weight_x = 100/(4+(length-4)*1.30)
    weight_y = 1.30*weight_x
    for i=0 to length - 1
        if i <= 3
            weight := weight_x
        else
            weight := weight_y
        sum := sum + source[i] * weight
        denominator := denominator + weight
    rwma = sum/denominator

//@function which permits the user to choose a moving average type
ma(source, length, type) =>
    switch type
        "SMA" => ta.sma(source, length)
        "RWMA" => rwma(source, length)

//@function Displays text passed to `txt` when called.
debugLabel(txt, color) =>
    label.new(bar_index, high, text = txt, color=color, style = label.style_label_lower_right, textcolor = color.black, size = size.small)

//@function which looks if the close date of the current bar falls inside the date range
inBacktestPeriod(start, end) => (time >= start) and (time <= end)


//--------------------------------USER INPUTS-------------------------------//

//Technical parameters
rsiLengthInput = input.int(20, minval=1, title="RSI Length", group="RSI Settings")
maTypeInput = input.string("RWMA", title="MA Type", options=["SMA", "RWMA"], group="MA Settings", inline="1")
maLenghtInput = input.int(20, minval=1, title="MA Length", group="MA Settings", inline="1")
rsiLongSignalValue = input.int(60, minval=1, maxval=99, title="RSI Long Signal", group="Strategy parameters", inline="3")
rsiShortSignalValue = input.int(40, minval=1, maxval=99, title="RSI Short Signal", group="Strategy parameters", inline="3")
rocMovAverLongSignalValue = input.float(-1, maxval=0, title="ROC MA Long Signal", group="Strategy parameters", inline="4")
rocMovAverShortSignalValue = input.float(1, minval=0, title="ROC MA Short Signal", group="Strategy parameters", inline="4")
//TP Activation and Trailing TP
takeProfitActivationInput = input.float(4, minval=1.0, title="TP activation in multiple of ATR", group="Strategy parameters")
trailingStopInput = input.float(3, minval=0, title="Trailing TP in percentage", group="Strategy parameters")
//Money Management
fixedRatio = input.int(defval=400, minval=1, title="Fixed Ratio Value ($)", group="Money Management")
increasingOrderAmount = input.int(defval=200, minval=1, title="Increasing Order Amount ($)", group="Money Management")
//Backtesting period
startDate = input(title="Start Date", defval=timestamp("1 Jan 2018 00:00:00"), group="Backtesting Period")
endDate = input(title="End Date", defval=timestamp("1 July 2024 00:00:00"), group="Backtesting Period")

strategy.initial_capital = 50000

//------------------------------VARIABLES INITIALISATION-----------------------------//

float rsi = ta.rsi(close, rsiLengthInput)
float ma = ma(close, maLenghtInput, maTypeInput)
float roc_ma = ((ma/ma[maLenghtInput]) - 1)*100
float atr = ta.atr(20)
var float trailingStopOffset = na
var float trailingStopActivation = na
var float trailingStop = na
var float stopLoss = na
var bool long = na
var bool short = na
var bool bufferTrailingStopDrawing = na
float theoreticalStopPrice = na
bool inRange = na
equity = strategy.equity - strategy.openprofit
var float capital_ref = strategy.initial_capital
var float cashOrder = strategy.initial_capital * 0.95


//------------------------------CHECKING SOME CONDITIONS ON EACH SCRIPT EXECUTION-------------------------------//

//Checking if the date belong to the range
inRange := true

//Checking performances of the strategy
if equity > capital_ref + fixedRatio
    spread = (equity - capital_ref)/fixedRatio
    nb_level = int(spread)
    increasingOrder = nb_level * increasingOrderAmount
    cashOrder := cashOrder + increasingOrder
    capital_ref := capital_ref + nb_level*fixedRatio
if equity < capital_ref - fixedRatio
    spread = (capital_ref - equity)/fixedRatio
    nb_level = int(spread)
    decreasingOrder = nb_level * increasingOrderAmount
    cashOrder := cashOrder - decreasingOrder
    capital_ref := capital_ref - nb_level*fixedRatio

//Checking if we close all trades in case where we exit the backtesting period
if strategy.position_size!=0 and not inRange
    debugLabel("END OF BACKTESTING PERIOD : we close the trade", color=color.rgb(116, 116, 116))
    strategy.close_all()
    bufferTrailingStopDrawing := false
    stopLoss := na
    trailingStopActivation := na
    trailingStop := na
    short := false
    long := false


//------------------------------STOP LOSS AND TRAILING STOP ACTIVATION----------------------------//

// We handle the stop loss and trailing stop activation
if (low <= stopLoss or high >= trailingStopActivation) and long
    if high >= trailingStopActivation
        bufferTrailingStopDrawing := true
    else if low <= stopLoss
        long := false
    stopLoss := na
    trailingStopActivation := na
if (low <= trailingStopActivation or high >= stopLoss) and short
    if low <= trailingStopActivation
        bufferTrailingStopDrawing := true
    else if high >= stopLoss
        short := false
    stopLoss := na
    trailingStopActivation := na


//-------------------------------------TRAILING STOP--------------------------------------//

// If the traling stop is activated, we manage its plotting with the bufferTrailingStopDrawing
if bufferTrailingStopDrawing and long
    theoreticalStopPrice := high - trailingStopOffset * syminfo.mintick
    if na(trailingStop)
        trailingStop := theoreticalStopPrice
    else if theoreticalStopPrice > trailingStop
        trailingStop := theoreticalStopPrice
    else if low <= trailingStop
        trailingStop := na
        bufferTrailingStopDrawing := false
        long := false
if bufferTrailingStopDrawing and short
    theoreticalStopPrice := low + trailingStopOffset * syminfo.mintick
    if na(trailingStop)
        trailingStop := theoreticalStopPrice
    else if theoreticalStopPrice < trailingStop
        trailingStop := theoreticalStopPrice
    else if high >= trailingStop
        trailingStop := na
        bufferTrailingStopDrawing := false
        short := false


//---------------------------------LONG CONDITION--------------------------//

if rsi >= 60 and roc_ma <= rocMovAverLongSignalValue and inRange and not long
    if short
        bufferTrailingStopDrawing := false
        stopLoss := na
        trailingStopActivation := na
        trailingStop := na
        short := false
    trailingStopActivation := close + takeProfitActivationInput*atr
    trailingStopOffset := (trailingStopActivation * trailingStopInput/100) / syminfo.mintick
    stopLoss := close - 3*atr
    long := true
    qty = cashOrder/close
    strategy.entry("Long", strategy.long, qty)
    strategy.exit("Exit Long", "Long", stop = stopLoss, trail_price = trailingStopActivation,
                 trail_offset = trailingStopOffset)


//--------------------------------SHORT CONDITION-------------------------------//

if rsi <= 40 and roc_ma >= rocMovAverShortSignalValue and inRange and not short
    if long
        bufferTrailingStopDrawing := false
        stopLoss := na
        trailingStopActivation := na
        trailingStop := na
        long := false
    trailingStopActivation := close - takeProfitActivationInput*atr
    trailingStopOffset := (trailingStopActivation * trailingStopInput/100) / syminfo.mintick
    stopLoss := close + 3*atr
    short := true
    qty = cashOrder/close
    strategy.entry("Short", strategy.short, qty)
    strategy.exit("Exit Short", "Short", stop = stopLoss, trail_price = trailingStopActivation,
                 trail_offset = trailingStopOffset)


//--------------------------------PLOTTING ELEMENT---------------------------------//

// Plotting of element in the graph
plotchar(rsi, "RSI", "", location.top, color.rgb(0, 214, 243))
plot(ma, "MA", color.rgb(219, 219, 18))
plotchar(roc_ma, "ROC MA", "", location.top, color=color.orange)
// Visualizer trailing stop and stop loss movement
plot(stopLoss, "SL", color.red, 3, plot.style_linebr)
plot(trailingStopActivation, "Trigger Trail", color.green, 3, plot.style_linebr)
plot(trailingStop, "Trailing Stop",  color.blue, 3, plot.style_linebr)
Published by ChaoZhang on the FMZ strategy square · last modified 2023-11-16. Collected in the Quant Trading Vault. Unvalidated research: re-test with your own data and costs before trusting it.
Build this with AgenKit
A spec is not a trading system. Paste this into your coding agent and AgenKit runs a specialist team — architecture, test-first build, risk gates, review — with paper trading on by default.
/agenkit build a production-grade trading bot with a backtest engine, risk controls and paper trading by default from strategies/RSI-Trend-Following-Strategy.md- npx agenkit install engineering-kit in your project
- Paste the command into your agent and approve each phase
- Get tests, backtest, risk controls and a paper-trading switch
Understand it first
Before you run this, read the lesson behind the idea and how to backtest it honestly. Specs like this one are the survivors of an unknown number of trials; deflate their results accordingly.
Related specs
- BB Percentage Index Trend Fading StrategyPine Script · Trend following · 1h
- Bollinger Bands and RSI Trend Following StrategyPine Script · Trend following · 1h
- Dual ATR Channel Trend Following StrategyPine Script · Trend following · 15m
- Dual Mode Adaptive Trend Trading Strategy EMA Crossover with ATR Volatility Based Risk Management SystemPine Script · Trend following · 1d
- Dynamic Dual EMA Crossover Strategy with Adaptive Profit Loss ControlPine Script · Trend following · 1d
- Dynamic Signal Line Trend Following and Volatility Filtering StrategyPine Script · Trend following · 1h