RSIBollinger Bands Breakout Strategy at Lower Area
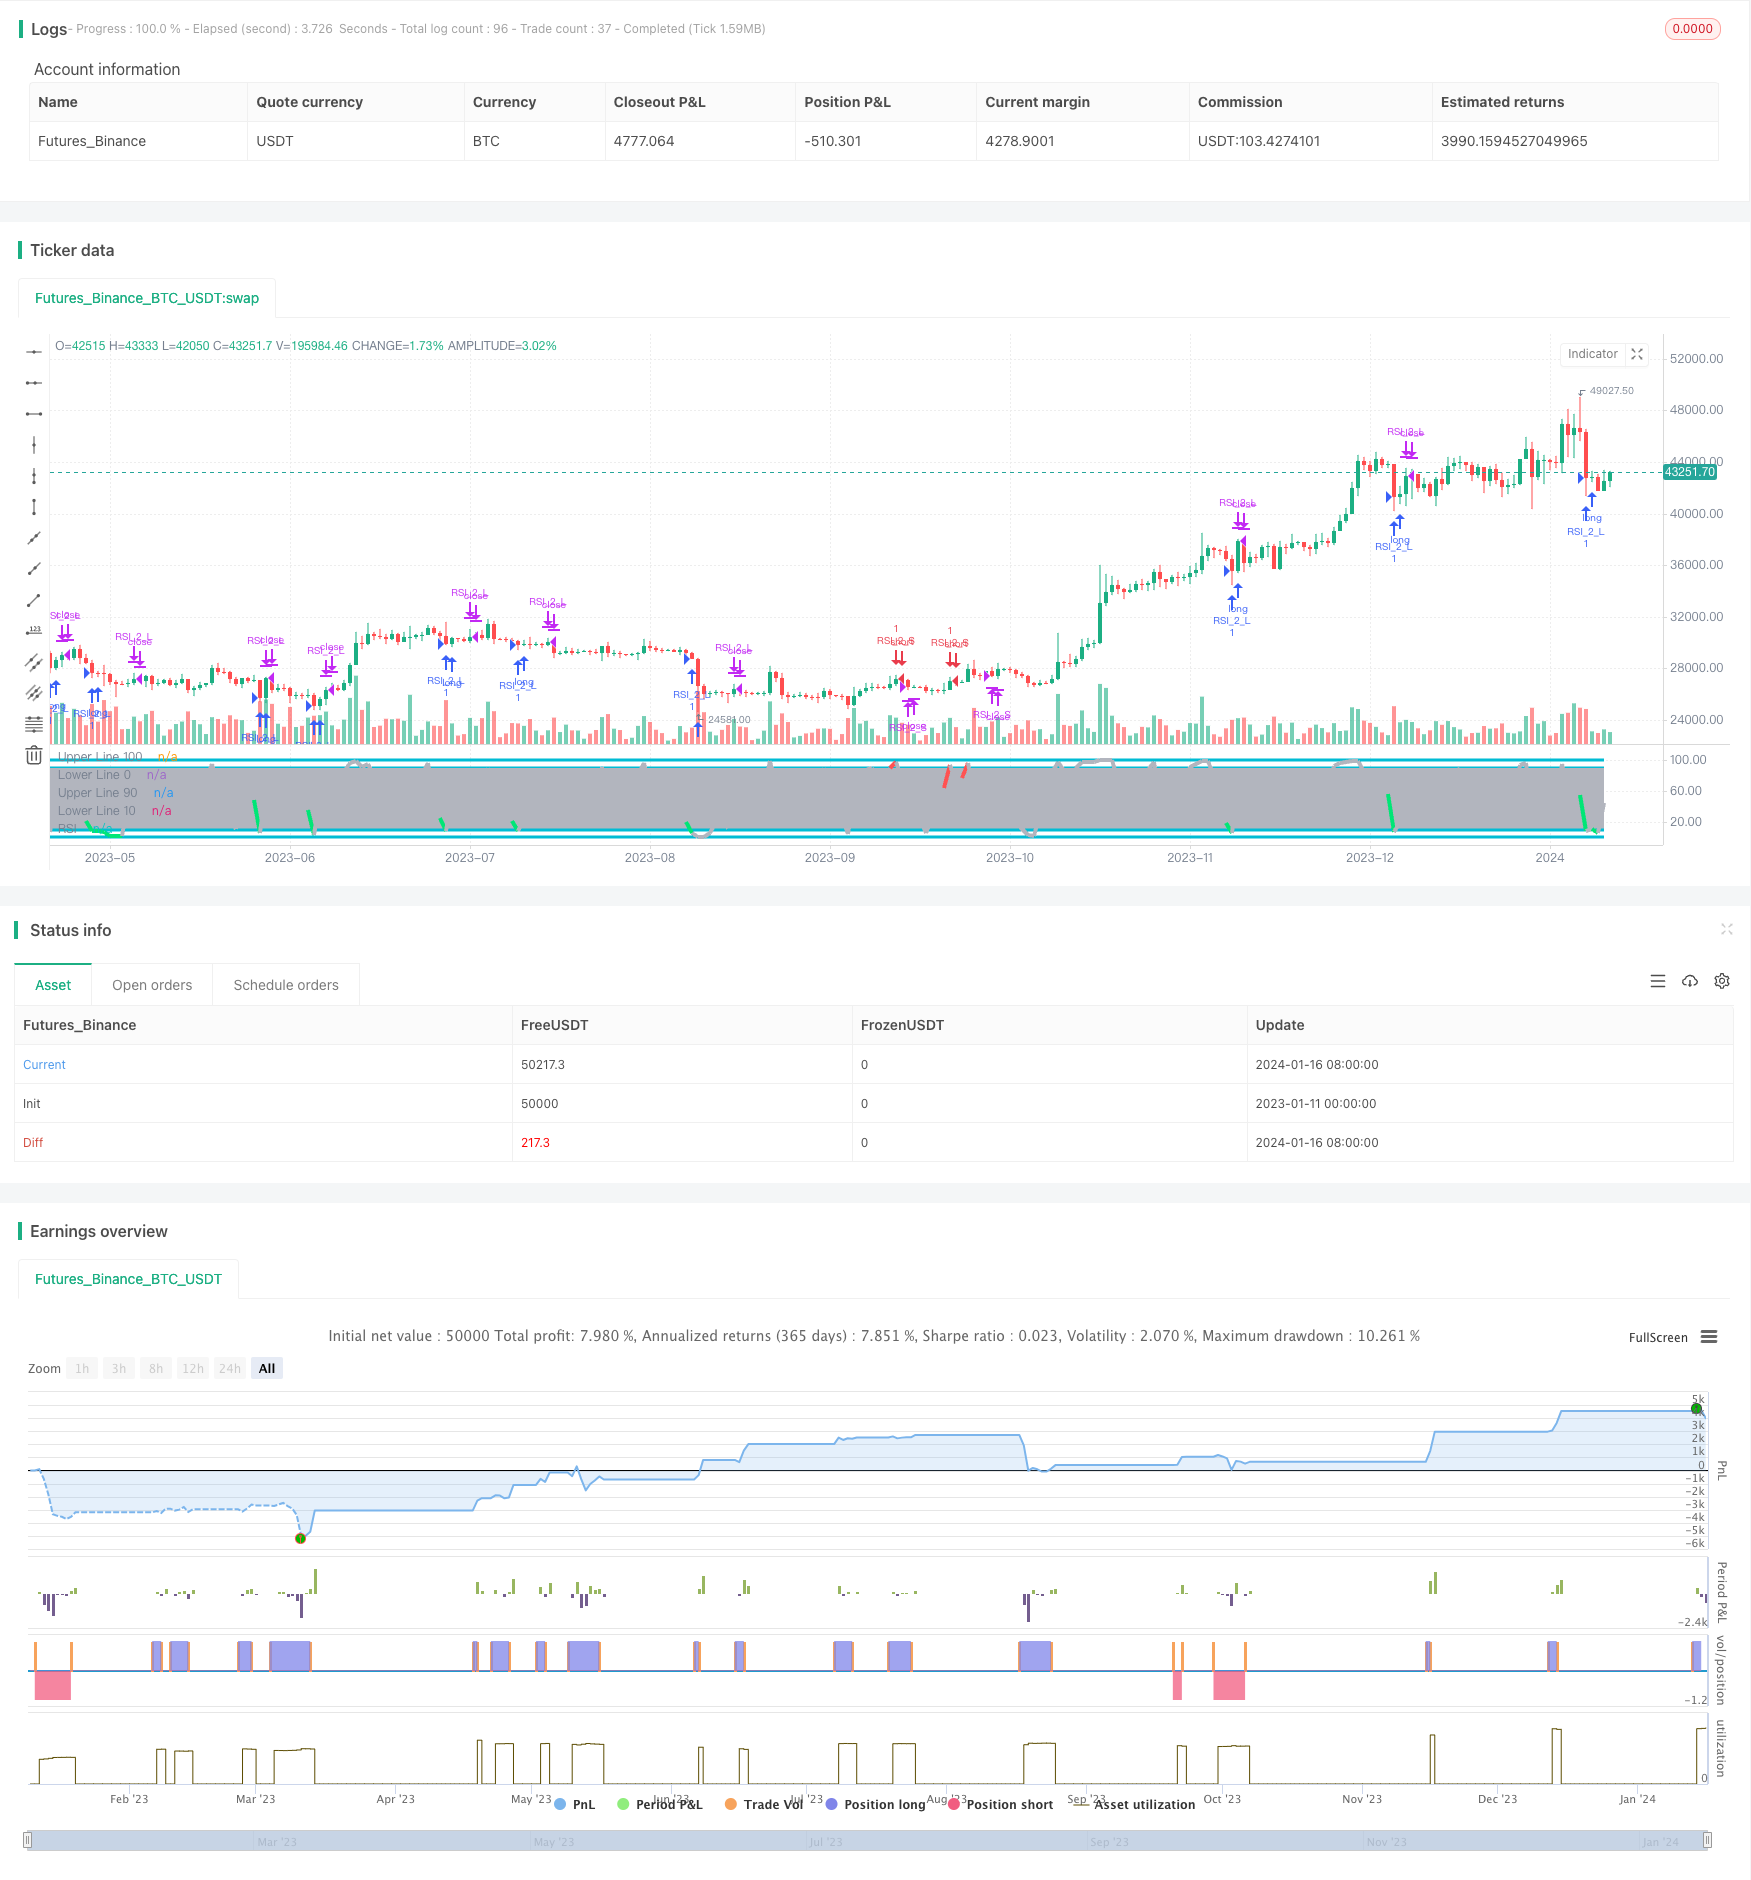
This is a breakout strategy that combines the RSI indicator and Bollinger Bands. The main idea is to buy when RSI is below 10 and sell when RSI is above 90, with the 5 period SMA as the stop loss line. When RSI is…
1. Overview
This is a breakout strategy that combines the RSI indicator and Bollinger Bands. The main idea is to buy when RSI is below 10 and sell when RSI is above 90, with the 5 period SMA as the stop loss line.
2. Principles
When RSI is below 10, it is considered an oversold signal, and the likelihood of overvaluation of the stock is small, so it is a good time to buy. When RSI is above 90, it is considered an overbought signal and a sell signal. The stop loss line is set at the 5 period simple moving average to prevent stop loss due to normal fluctuations in the market in the short term.
3. Advantages
This is a statistical arbitrage strategy that buys low and sells high using indicator signals. Its biggest advantage is that by judging buy and sell points through the RSI indicator, it can effectively seize the timing of stock overvaluation and undervaluation to achieve excess returns. At the same time, combined with breakout judgments of Bollinger Bands, it avoids the risks of catching a falling knife and chasing tops and bottoms.
4. Risks and Solutions
The biggest risk of this strategy is that normal fluctuations in the market in the short term may exceed the stop loss line, causing unnecessary stop loss. In addition, failure to take profits in time may also miss profits. Solutions are to appropriately adjust the cycle parameters of the stop loss line to prevent normal fluctuations from being stopped out. At the same time, a take profit line can also be set to take profits proactively after reaching the target return.
5. Optimization Directions
This strategy can be optimized in the following aspects:
(1) Adjust the overbought and oversold threshold values of the RSI indicator, such as 15 and 85, to obtain more trading opportunities.
(2) Optimize the cycle parameters of the stop loss line to adapt to short-term fluctuations in the market.
(3) Add settings for take profit lines for automatic profit taking and risk control.
(4) Combine volatility indicators to optimize parameters, such as adding ATR indicators.
6. Summary
The RSI+Bollinger Bands breakout strategy at lower area uses RSI to determine entry and exit points, Bollinger Bands to determine range, and SMA as stop loss line, which can effectively capture trends, control risks, and achieve steady profits. There is still much room for optimization of this strategy and it is worth further research.
Source Pine Script
/*backtest
start: 2023-01-11 00:00:00
end: 2024-01-17 00:00:00
period: 1d
basePeriod: 1h
exchanges: [{"eid":"Futures_Binance","currency":"BTC_USDT"}]
*/

//@version=2
//Created by ChrisMoody
//Based on Larry Connors RSI-2 Strategy - Lower RSI
strategy(title="_CM_RSI_2_Strat_Low", shorttitle="_CM_RSI_2_Strategy_Lower", overlay=false)
src = close,

//RSI CODE
up = rma(max(change(src), 0), 2)
down = rma(-min(change(src), 0), 2)
rsi = down == 0 ? 100 : up == 0 ? 0 : 100 - (100 / (1 + up / down))
//Criteria for Moving Avg rules
ma1 = sma(close,1)
ma2 = sma(close,2)
ma3 = sma(close,3)
ma4 = sma(close,4)
ma5 = sma(close,5)
ma6 = sma(close,6)
ma7 = sma(close,7)
ma8 = sma(close,8)
ma9 = sma(close,9)
ma200= sma(close, 200)

//Rule for RSI Color
col = close > ma200 and close < ma5 and rsi < 10 ? lime : close < ma200 and close > ma5 and rsi > 90 ? red : silver

plot(rsi, title="RSI", style=line, linewidth=4,color=col)
plot(100, title="Upper Line 100",style=line, linewidth=3, color=aqua)
plot(0, title="Lower Line 0",style=line, linewidth=3, color=aqua)

band1 = plot(90, title="Upper Line 90",style=line, linewidth=3, color=aqua)
band0 = plot(10, title="Lower Line 10",style=line, linewidth=3, color=aqua)
fill(band1, band0, color=silver, transp=90)

///////////// RSI + Bollinger Bands Strategy


if (close > ma200 and rsi < 10)
    strategy.entry("RSI_2_L", strategy.long, comment="Bullish")
if (close < ma200 and rsi > 90)
    strategy.entry("RSI_2_S", strategy.short, comment="Bearish")


strategy.close("RSI_2_L", when = close > ma5)
strategy.close("RSI_2_S", when = close < ma5)
Published by ChaoZhang on the FMZ strategy square · last modified 2024-01-18. Collected in the Quant Trading Vault. Unvalidated research: re-test with your own data and costs before trusting it.
Build this with AgenKit
A spec is not a trading system. Paste this into your coding agent and AgenKit runs a specialist team — architecture, test-first build, risk gates, review — with paper trading on by default.
/agenkit build a production-grade trading bot with a backtest engine, risk controls and paper trading by default from strategies/RSIBollinger-Bands-Breakout-Strategy-at-Lower-Area.md- npx agenkit install engineering-kit in your project
- Paste the command into your agent and approve each phase
- Get tests, backtest, risk controls and a paper-trading switch
Understand it first
Before you run this, read the lesson behind the idea and how to backtest it honestly. Specs like this one are the survivors of an unknown number of trials; deflate their results accordingly.
Related specs
- EMA and Bollinger Bands Breakout StrategyPine Script · Breakout · 1h
- Momentum Breakout Moving Average StrategyPine Script · Breakout · 1d
- Momentum Breakout Trading Strategy 440964Pine Script · Breakout · 5m
- Moving Average Crossover and Upper Rail Breakthrough Impulse StrategyPine Script · Breakout · 1m
- Bollinger Bands Breakout Strategy 448080Pine Script · Breakout · 1h
- Enhanced Bollinger Breakout Quantitative Strategy with Momentum Filter Integration SystemPine Script · Breakout · 2d