Strategy vault / Trend following
Single Exponential Smoothed Moving Average with Trailing Stop Loss Trend Following Strategy
This strategy combines Single Exponential Smoothed Moving Average (SESMA) and a trailing stop loss mechanism with the Chandelier Exit to form a very stable and efficient trend following strategy. SESMA serves as the…
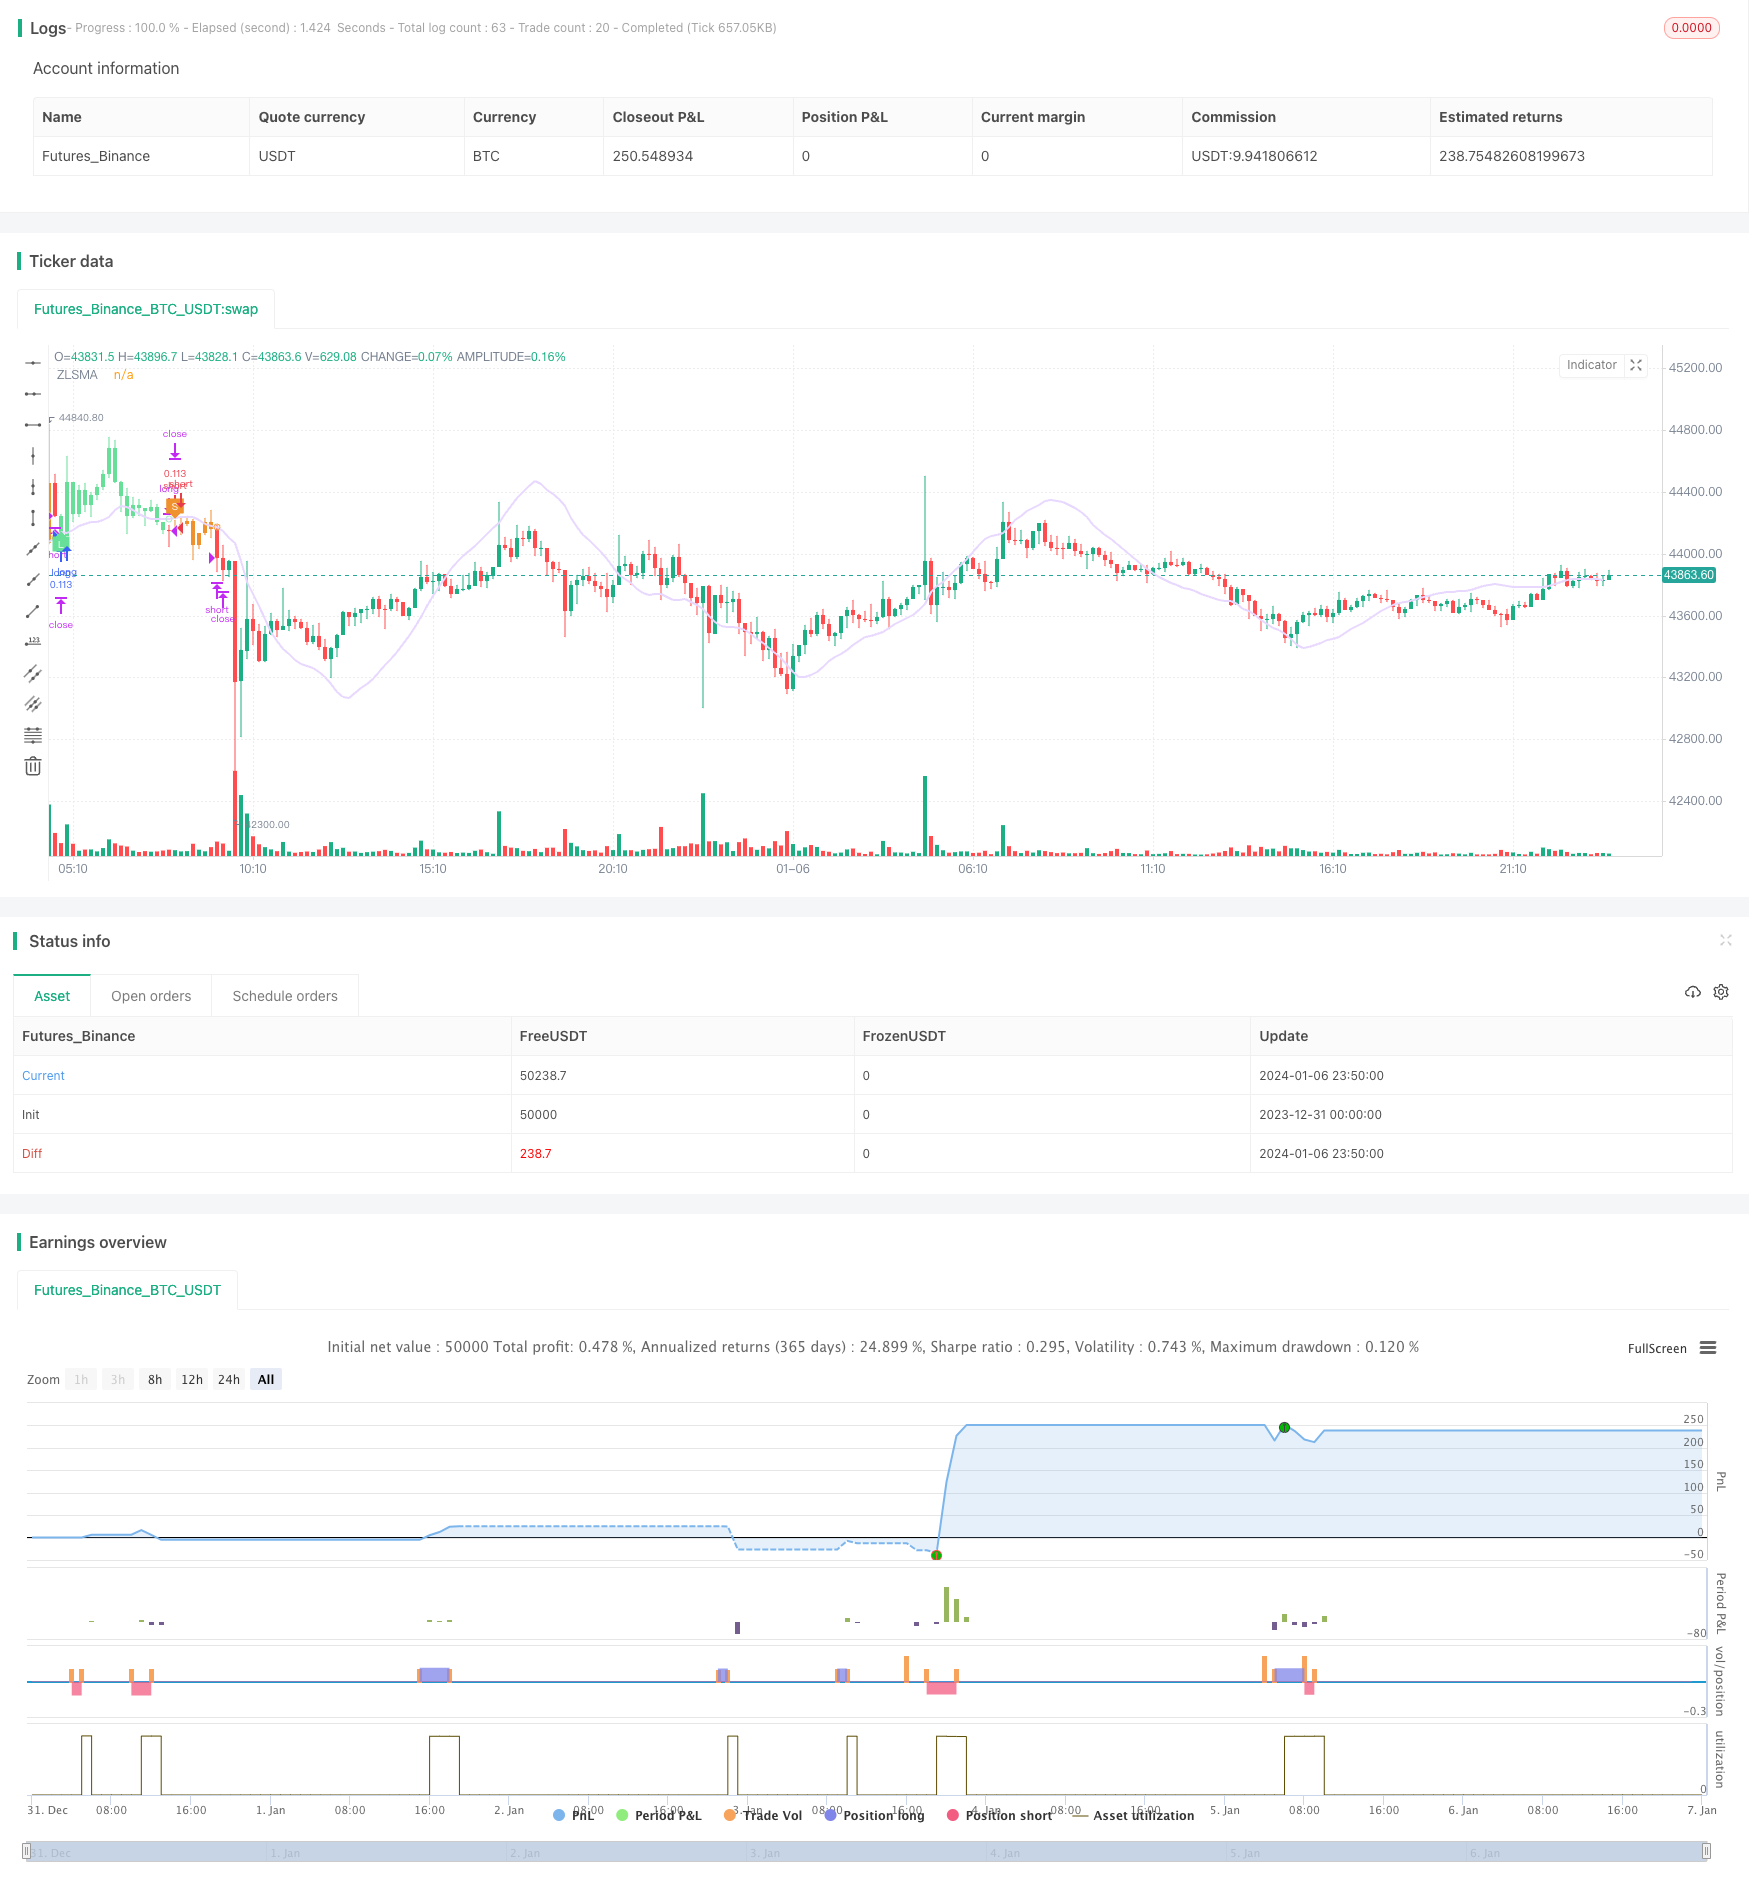
Overview
This strategy combines Single Exponential Smoothed Moving Average (SESMA) and a trailing stop loss mechanism with the Chandelier Exit to form a very stable and efficient trend following strategy. SESMA serves as the main line to identify the trend direction of prices. The trailing stop loss mechanism can effectively reduce the risk of the strategy while protecting profits.
Strategy Logic
The strategy consists of two core indicators:
Single Exponential Smoothed Moving Average (SESMA): SESMA draws on the idea of EMA and improves the parameters to make the curve smoother and reduce lag. It uses the direction and level of SESMA to judge price trends.
Trailing stop loss mechanism: Combined with highest price, lowest price and ATR indicator to calculate long and short stop loss lines in real time. It is a dynamic adjustable stop loss mechanism that can adjust stop loss range based on market volatility and trends. The relationship between stop loss line and price level is used to determine the timing of exit orders.
The entry signal of this strategy is triggered when price crosses over SESMA. The exit signal is generated by the stop loss lines. Option to show entry/exit markings.
Advantages of the Strategy
- The SESMA calculation method is improved and can effectively reduce lag and improve trend-following ability.
- The trailing stop loss mechanism can adjust the stop loss range according to real-time fluctuations to avoid excessively wide or too tight stop loss.
- Comes with visual assistances to mark Entry and Exit signals.
- Customizable parameters suitable for different products and parameter optimizations.
Risks and Optimization Directions
- Stop loss may be triggered prematurely during trend reversals. Can appropriately loosen the stop loss range.
- SESMA parameters can be optimized to find the best length.
- The period parameter of ATR can also be tested.
- Test the effects of showing markings.
Conclusion
This strategy integrates trend judging and risk control indicators to form a relatively robust trend following strategy. Compared to simple moving average strategies, this strategy can capture trends more flexibly while reducing drawdowns. Through parameter optimization, the strategy can achieve better results in different markets.
Parameters
| Name | Default | What it controls |
|---|---|---|
| v_input_1 | true | ATR Period |
| v_input_float_1 | 2 | ATR Multiplier |
| v_input_2 | false | Show Buy/Sell Labels ? |
| v_input_3 | true | Show Signal Labels ? |
| v_input_4 | true | Use Close Price for Extrema ? |
| v_input_5 | false | Enable Rising/Decreasing Highlightning |
| v_input_6 | 50 | ZLSMA Length |
| v_input_7 | false | Offset |
Source Pine Script
/*backtest
start: 2023-12-31 00:00:00
end: 2024-01-07 00:00:00
period: 10m
basePeriod: 1m
exchanges: [{"eid":"Futures_Binance","currency":"BTC_USDT"}]
*/


//@version=5
// This source code is subject to the terms of the Mozilla Public License 2.0 at https://mozilla.org/MPL/2.0/
// © simwai
strategy('Chandelier Exit ZLSMA Strategy', shorttitle='CE_ZLSMA', overlay = true, initial_capital = 1000, default_qty_value = 10, default_qty_type = strategy.percent_of_equity, calc_on_every_tick = false, process_orders_on_close = true, commission_value = 0.075)

// -- Colors --
color maximumYellowRed = color.rgb(255, 203, 98) // yellow
color rajah = color.rgb(242, 166, 84) // orange
color magicMint = color.rgb(171, 237, 198)
color languidLavender = color.rgb(232, 215, 255)
color maximumBluePurple = color.rgb(181, 161, 226)
color skyBlue = color.rgb(144, 226, 244)
color lightGray = color.rgb(214, 214, 214)
color quickSilver = color.rgb(163, 163, 163)
color mediumAquamarine = color.rgb(104, 223, 153)
color carrotOrange = color.rgb(239, 146, 46)

// -- Inputs --
length = input(title='ATR Period', defval=1)
mult = input.float(title='ATR Multiplier', step=0.1, defval=2)
showLabels = input(title='Show Buy/Sell Labels ?', tooltip='Created by Chandelier Exit (CE)', defval=false)
isSignalLabelEnabled = input(title='Show Signal Labels ?', defval=true)
useClose = input(title='Use Close Price for Extrema ?', defval=true)
zcolorchange = input(title='Enable Rising/Decreasing Highlightning', defval=false)
zlsmaLength = input(title='ZLSMA Length', defval=50)
offset = input(title='Offset', defval=0)

// -- CE - Credits to @everget --
float haClose = float(1) / 4 * (open[1] + high[1] + low[1] + close[1])
atr = mult * ta.atr(length)[1]

longStop = (useClose ? ta.highest(haClose, length) : ta.highest(haClose, length)) - atr
longStopPrev = nz(longStop[1], longStop)
longStop := haClose > longStopPrev ? math.max(longStop, longStopPrev) : longStop

shortStop = (useClose ? ta.lowest(haClose, length) : ta.lowest(haClose, length)) + atr
shortStopPrev = nz(shortStop[1], shortStop)
shortStop := haClose < shortStopPrev ? math.min(shortStop, shortStopPrev) : shortStop

var int dir = 1
dir := haClose > shortStopPrev ? 1 : haClose < longStopPrev ? -1 : dir

buySignal = dir == 1 and dir[1] == -1
plotshape(buySignal and showLabels ? longStop : na, title='Buy Label', text='Buy', location=location.absolute, style=shape.labelup, size=size.tiny, color=mediumAquamarine, textcolor=color.white)
sellSignal = dir == -1 and dir[1] == 1
plotshape(sellSignal and showLabels ? shortStop : na, title='Sell Label', text='Sell', location=location.absolute, style=shape.labeldown, size=size.tiny, color=carrotOrange, textcolor=color.white)

changeCond = dir != dir[1]

// -- ZLSMA - Credits to @netweaver2011 --
lsma = ta.linreg(haClose, zlsmaLength, offset)
lsma2 = ta.linreg(lsma, zlsmaLength, offset)
eq = lsma - lsma2
zlsma = lsma + eq

zColor = zcolorchange ? zlsma > zlsma[1] ? magicMint : rajah : languidLavender
plot(zlsma, title='ZLSMA', linewidth=2, color=zColor)

// -- Signals --
var string isTradeOpen = ''
var string signalCache = ''

bool enterLong = buySignal and ta.crossover(haClose, zlsma)
bool exitLong = ta.crossunder(haClose, zlsma)
bool enterShort = sellSignal and ta.crossunder(haClose, zlsma)
bool exitShort = ta.crossover(haClose, zlsma)

if (signalCache == 'long entry')
    signalCache := ''
    enterLong := true
else if (signalCache == 'short entry')
    signalCache := ''
    enterShort := true

if (isTradeOpen == '')
    if (exitShort and (not enterLong))
        exitShort := false
    if (exitLong and (not enterShort))
        exitLong := false
    if (enterLong and exitShort)
        isTradeOpen := 'long'
        exitShort := false
    else if (enterShort and exitLong)
        isTradeOpen := 'short'
        exitLong := false
    else if (enterLong)
        isTradeOpen := 'long'
    else if (enterShort)
        isTradeOpen := 'short'
else if (isTradeOpen == 'long')
    if (exitShort)
        exitShort := false
    if (enterLong)
        enterLong := false
    if (enterShort and exitLong)
        enterShort := false
        signalCache := 'short entry'
    if (exitLong)
        isTradeOpen := ''
else if (isTradeOpen == 'short')
    if (exitLong)
        exitLong := false
    if (enterShort)
        enterShort := false
    if (enterLong and exitShort)
        enterLong := false
        signalCache := 'long entry'
    if (exitShort)
        isTradeOpen := ''

plotshape((isSignalLabelEnabled and enterLong) ? zlsma : na, title='LONG', text='L', style=shape.labelup, color=mediumAquamarine, textcolor=color.white, size=size.tiny, location=location.absolute)
plotshape((isSignalLabelEnabled and enterShort) ? zlsma : na, title='SHORT', text='S', style=shape.labeldown, color=carrotOrange, textcolor=color.white, size=size.tiny, location=location.absolute)
plotshape((isSignalLabelEnabled and exitLong) ? zlsma : na, title='LONG EXIT', style=shape.circle, color=magicMint, size=size.tiny, location=location.absolute)
plotshape((isSignalLabelEnabled and exitShort) ? zlsma : na, title='SHORT EXIT', style=shape.circle, color=rajah, size=size.tiny, location=location.absolute)

barcolor(color=isTradeOpen == 'long' ? mediumAquamarine : isTradeOpen == 'short' ? carrotOrange : na)

// -- Long Exits --
if (exitLong and strategy.position_size > 0)
    strategy.close('long', comment='EXIT_LONG')

// -- Short Exits --
if (exitShort and strategy.position_size < 0)
    strategy.close('short', comment='EXIT_SHORT')

// -- Long Entries --
if (enterLong)
    strategy.entry('long', strategy.long, comment='ENTER_LONG')

// -- Short Entries --
if (enterShort)
strategy.entry('short', strategy.short, comment='ENTER_SHORT')Published by ChaoZhang on the FMZ strategy square · last modified 2024-01-08. Collected in the Quant Trading Vault. Unvalidated research: re-test with your own data and costs before trusting it.
Build this with AgenKit
A spec is not a trading system. Paste this into your coding agent and AgenKit runs a specialist team — architecture, test-first build, risk gates, review — with paper trading on by default.
/agenkit build a production-grade trading bot with a backtest engine, risk controls and paper trading by default from strategies/Single-Exponential-Smoothed-Moving-Average-with-Trailing-Stop-Loss-Trend-Following-Strategy.md- npx agenkit install engineering-kit in your project
- Paste the command into your agent and approve each phase
- Get tests, backtest, risk controls and a paper-trading switch
Understand it first
Before you run this, read the lesson behind the idea and how to backtest it honestly. Specs like this one are the survivors of an unknown number of trials; deflate their results accordingly.
Related specs
- ATR and Moving Average Crossover Hybrid StrategyPine Script · Trend following · 1h
- Bollinger Bands and RSI Trend Following StrategyPine Script · Trend following · 1h
- Dual ATR Channel Trend Following StrategyPine Script · Trend following · 15m
- Dual MA Crossover Trend Tracking StrategyPine Script · Trend following · 1h
- Dual Mode Adaptive Trend Trading Strategy EMA Crossover with ATR Volatility Based Risk Management SystemPine Script · Trend following · 1d
- Dual Moving Average Crossover Dynamic Position Optimization Strategy with EMA Cross Signal SystemPine Script · Trend following · 1h