Spiral Breakout Moving Average Strategy
This strategy combines the Spiral Channel indicator and the Rate of Change (ROC) indicator. It generates buy signals when the price breaks through the upper band and moving average, and sell signals when the price…
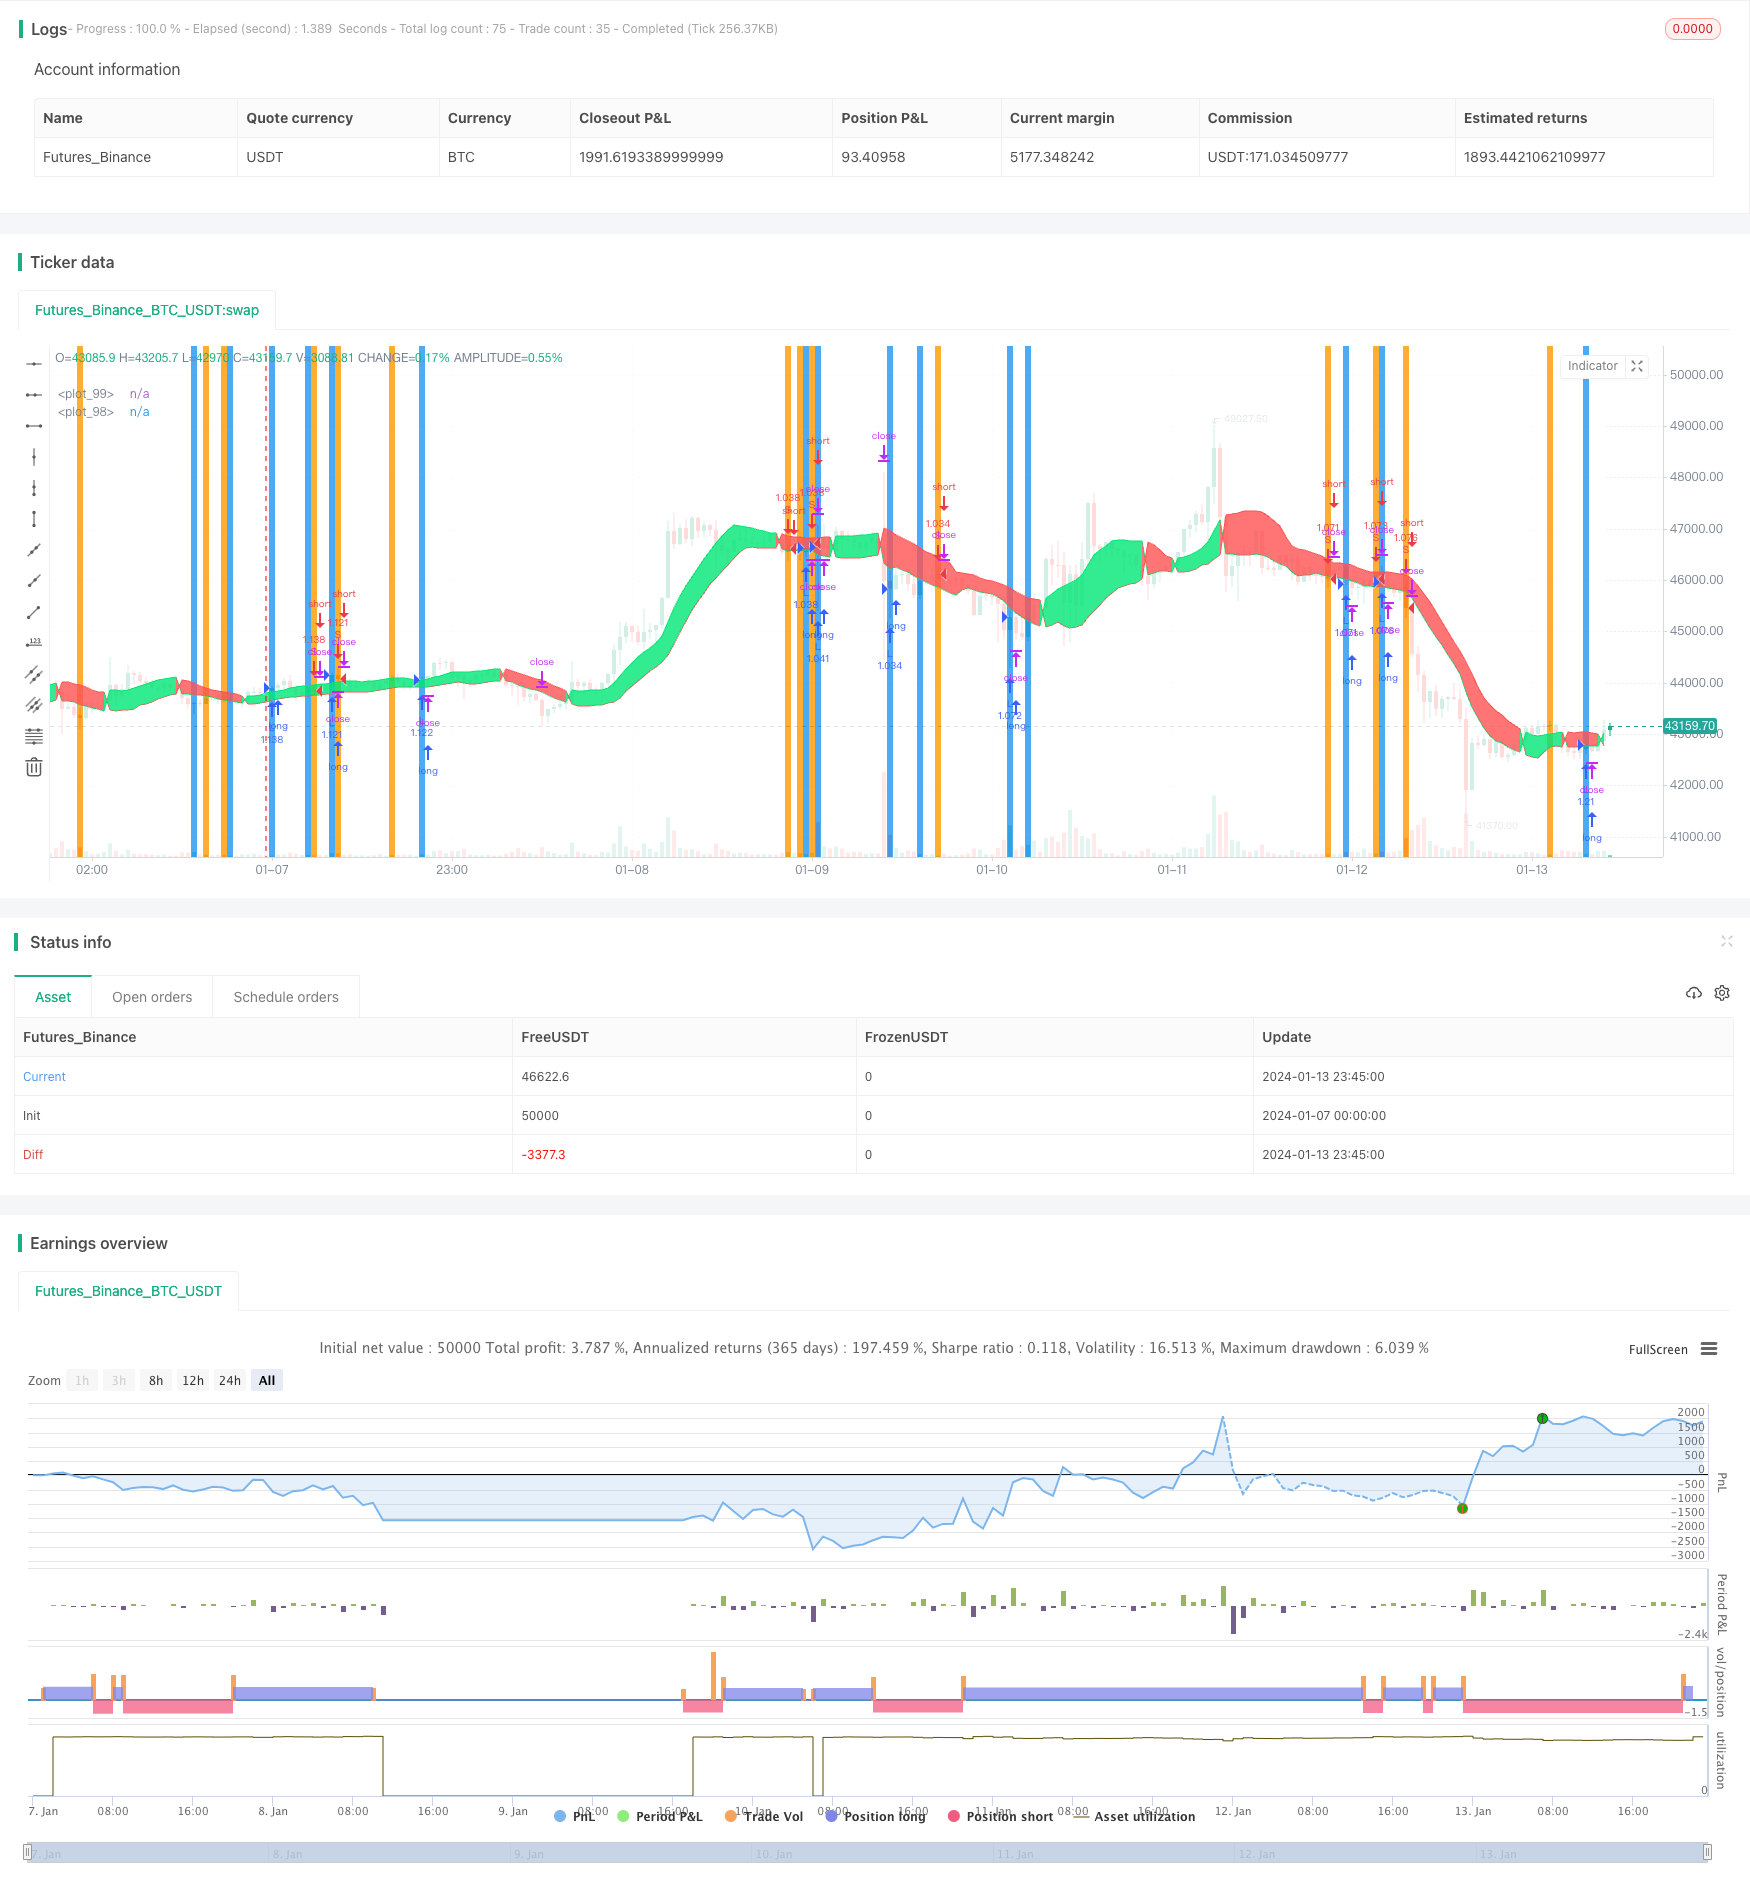
Overview
This strategy combines the Spiral Channel indicator and the Rate of Change (ROC) indicator. It generates buy signals when the price breaks through the upper band and moving average, and sell signals when the price breaks through the lower band and moving average. The Spiral Channel determines the trend direction while the ROC detects price momentum. By requiring agreement between both indicators, the strategy aims at improving the reliability of trading signals and win rate.
Strategy Logic
The strategy is based on two key indicators:
Spiral Channels: Plot upper and lower bands to determine trend direction. Price breaking above upper band indicates upward trend, while breaking below lower band signals downward trend.
Rate of Change (ROC): Detect price acceleration. ROC above a positive threshold suggests accelerating upward price move, while ROC below a negative threshold points to accelerating downward move.
Buy signals are generated when both Spiral Channel and ROC give bullish indications, namely price breaking above upper band coupled with accelerating upward momentum. Sell signals are triggered when both indicators turn bearish.
The combined signals help avoid trading against the trend and improve reliability.
Advantages
Reliable signals with higher win rate by requiring agreement between trend and momentum.
Customizable trading frequency through parameter tuning, e.g. adjust ROC parameters.
Stop loss to limit downside risk on individual trades.
Re-enter mechanism to ride trends and further boost profitability.
Risks
Missing some trading opportunities and limiting profit potential due to signal reliability requirement.
Vulnerable to being trapped when trend reverses, potentially leading to large losses.
Poor parameter tuning can result in too few or too many signals.
Fixed stop loss percentage unable to prevent severe losses on huge adverse price swings.
Enhancement Opportunities
Optimize ROC parameters for best performance.
Test different stop loss levels to balance risk and reward.
Add other filters like volume, volatility indicators to refine signals.
Evaluate performance across different markets to find best fit.
Introduce dynamic position sizing for varying market conditions.
Conclusion
The strategy combines Spiral Channel and ROC to assess trend direction and momentum. It aims at signal reliability while maintaining profitability through re-entry and parameter tuning. Risk is mainly controlled by fixed percentage stop loss. Overall it is a relatively complete framework worthy as a baseline quantitative trading strategy.
Parameters
| Name | Default | What it controls |
|---|---|---|
| v_input_1 | false | ════════ Test Period ═══════ |
| v_input_2 | 2017 | Backtest Start Year |
| v_input_3 | true | Backtest Start Month |
| v_input_4 | true | Backtest Start Day |
| v_input_5 | 2019 | Backtest Stop Year |
| v_input_6 | 12 | Backtest Stop Month |
| v_input_7 | 31 | Backtest Stop Day |
| v_input_8 | false | ═══════ Chaikin MF ═══════ |
| v_input_9 | 20 | Chaikin SMA Length |
| v_input_10 | 0.04 | Upper Threshold |
| v_input_11 | 0.02 | Lower Threshold |
| v_input_12 | false | ═════════ SSL ══════════ |
| v_input_13 | 12 | SMA Length 1 |
| v_input_14 | 13 | SMA Length 2 |
| v_input_15 | false | ══════ Rate of Change ══════ |
| v_input_16 | 13 | ROC Length |
| v_input_17 | 4 | ROC % Change |
| v_input_18 | false | ════════ Stop Loss ═══════ |
| v_input_19 | 2 | Stop Loss % |
Source Pine Script
/*backtest
start: 2024-01-07 00:00:00
end: 2024-01-14 00:00:00
period: 45m
basePeriod: 5m
exchanges: [{"eid":"Futures_Binance","currency":"BTC_USDT"}]
*/

//@version=4
strategy("SSL Chaikin BF ?", overlay=true, precision=2, initial_capital=10000, default_qty_type=strategy.percent_of_equity, default_qty_value=100, commission_type=strategy.commission.percent, commission_value=0.075)

/////////////// Time Frame ///////////////
_0 = input(false,  "════════ Test Period ═══════")
testStartYear = input(2017, "Backtest Start Year")
testStartMonth = input(1, "Backtest Start Month")
testStartDay = input(1, "Backtest Start Day")
testPeriodStart = timestamp(testStartYear,testStartMonth,testStartDay, 0, 0)

testStopYear = input(2019, "Backtest Stop Year")
testStopMonth = input(12, "Backtest Stop Month")
testStopDay = input(31, "Backtest Stop Day")
testPeriodStop = timestamp(testStopYear,testStopMonth,testStopDay, 0, 0)

testPeriod() => true

/////////////// Chaikin MF ///////////////
_1 = input(false,  "═══════ Chaikin MF ═══════")
length = input(20, minval=1, title = "Chaikin SMA Length")
upperThreshold = input(0.04, step=0.01, title="Upper Threshold")
lowerThreshold = input(0.02, step=0.01, title="Lower Threshold")
ad = close==high and close==low or high==low ? 0 : ((2*close-low-high)/(high-low))*volume
mf = sum(ad, length) / sum(volume, length)

/////////////// SSL Channels ///////////////
_2 = input(false,  "═════════ SSL ══════════")
len1=input(title="SMA Length 1", defval=12)
len2=input(title="SMA Length 2", defval=13)

smaHigh = sma(high, len1)
smaLow = sma(low, len2)

Hlv = 0
Hlv := close > smaHigh ? 1 : close < smaLow ? -1 : Hlv[1]
sslDown = Hlv < 0 ? smaHigh : smaLow
sslUp = Hlv < 0 ? smaLow : smaHigh

///////////// Rate Of Change /////////////
_3 = input(false,  "══════ Rate of Change ══════")
source = close
roclength = input(13, "ROC Length",  minval=1)
pcntChange = input(4, "ROC % Change", minval=1)
roc = 100 * (source - source[roclength]) / source[roclength]
emaroc = ema(roc, roclength / 2)
isMoving() => emaroc > (pcntChange / 2) or emaroc < (0 - (pcntChange / 2))

///////////////  Strategy  ///////////////
long = sslUp > sslDown and isMoving() or crossover(mf, upperThreshold)
short = sslUp < sslDown and isMoving() or crossunder(mf, lowerThreshold)

last_long = 0.0
last_short = 0.0
last_long := long ? time : nz(last_long[1])
last_short := short ? time : nz(last_short[1])

long_signal = crossover(last_long, last_short)
short_signal = crossover(last_short, last_long)

last_open_long_signal = 0.0
last_open_short_signal = 0.0
last_open_long_signal := long_signal ? open : nz(last_open_long_signal[1])
last_open_short_signal := short_signal ? open : nz(last_open_short_signal[1])

last_long_signal = 0.0
last_short_signal = 0.0
last_long_signal := long_signal ? time : nz(last_long_signal[1])
last_short_signal := short_signal ? time : nz(last_short_signal[1])

in_long_signal = last_long_signal > last_short_signal
in_short_signal = last_short_signal > last_long_signal

last_high = 0.0
last_low = 0.0
last_high := not in_long_signal ? na : in_long_signal and (na(last_high[1]) or high > nz(last_high[1])) ? high : nz(last_high[1])
last_low := not in_short_signal ? na : in_short_signal and (na(last_low[1]) or low < nz(last_low[1])) ? low : nz(last_low[1])

since_longEntry = barssince(last_open_long_signal != last_open_long_signal[1])
since_shortEntry = barssince(last_open_short_signal != last_open_short_signal[1])

//////////////// Stop loss ///////////////
_4 = input(false,  "════════ Stop Loss ═══════")
sl_inp = input(2.0, title='Stop Loss %') / 100

slLong = in_long_signal ? strategy.position_avg_price * (1 - sl_inp) : na
slShort = strategy.position_avg_price * (1 + sl_inp)
long_sl = in_long_signal ? slLong : na
short_sl = in_short_signal ? slShort : na

/////////////// Execution ///////////////
if testPeriod()
    strategy.entry("L", strategy.long, when=long)
    strategy.entry("S", strategy.short, when=short)
    strategy.exit("L SL", "L", stop=long_sl, when=since_longEntry > 0)
    strategy.exit("S SL", "S", stop=short_sl, when=since_shortEntry > 0)

/////////////// Plotting ///////////////
p1 = plot(sslDown, linewidth = 1, color=color.red)
p2 = plot(sslUp, linewidth = 1, color=color.lime)
fill(p1, p2,  color = sslDown < sslUp ? color.lime : color.red, transp=80)
bgcolor(isMoving() ? long ? color.green : short ? color.red : na : color.white, transp=80)
bgcolor(long_signal ? color.lime : short_signal ? color.red : na, transp=30)
bgcolor(crossover(mf, upperThreshold) ? color.blue : crossunder(mf, lowerThreshold) ? color.orange : na, transp=30)Published by ChaoZhang on the FMZ strategy square · last modified 2024-01-15. Collected in the Quant Trading Vault. Unvalidated research: re-test with your own data and costs before trusting it.
Build this with AgenKit
A spec is not a trading system. Paste this into your coding agent and AgenKit runs a specialist team — architecture, test-first build, risk gates, review — with paper trading on by default.
/agenkit build a production-grade trading bot with a backtest engine, risk controls and paper trading by default from strategies/Spiral-Breakout-Moving-Average-Strategy.md- npx agenkit install engineering-kit in your project
- Paste the command into your agent and approve each phase
- Get tests, backtest, risk controls and a paper-trading switch
Understand it first
Before you run this, read the lesson behind the idea and how to backtest it honestly. Specs like this one are the survivors of an unknown number of trials; deflate their results accordingly.
Related specs
- Adaptive Multi Period Trading Strategy Based on Wave Trend Momentum BreakoutPine Script · Breakout · 2h
- BB Breakout StrategyPine Script · Breakout · 1d
- BMSB Breakout Strategy BMSBPine Script · Breakout · 1h
- Bollinger Band T3 Moving Average StrategyPine Script · Breakout · 10m
- Bollinger Bands Dual track Breakthrough StrategyPine Script · Breakout · 30m
- Bollinger Breakout StrategyPine Script · Breakout · 30m