StochRSI Based Quantitative Trading Strategy
This strategy is developed based on the StochRSI indicator. The strategy mainly uses the StochRSI indicator to judge overbought and oversold situations. Combined with the RSI indicator to filter out some false…
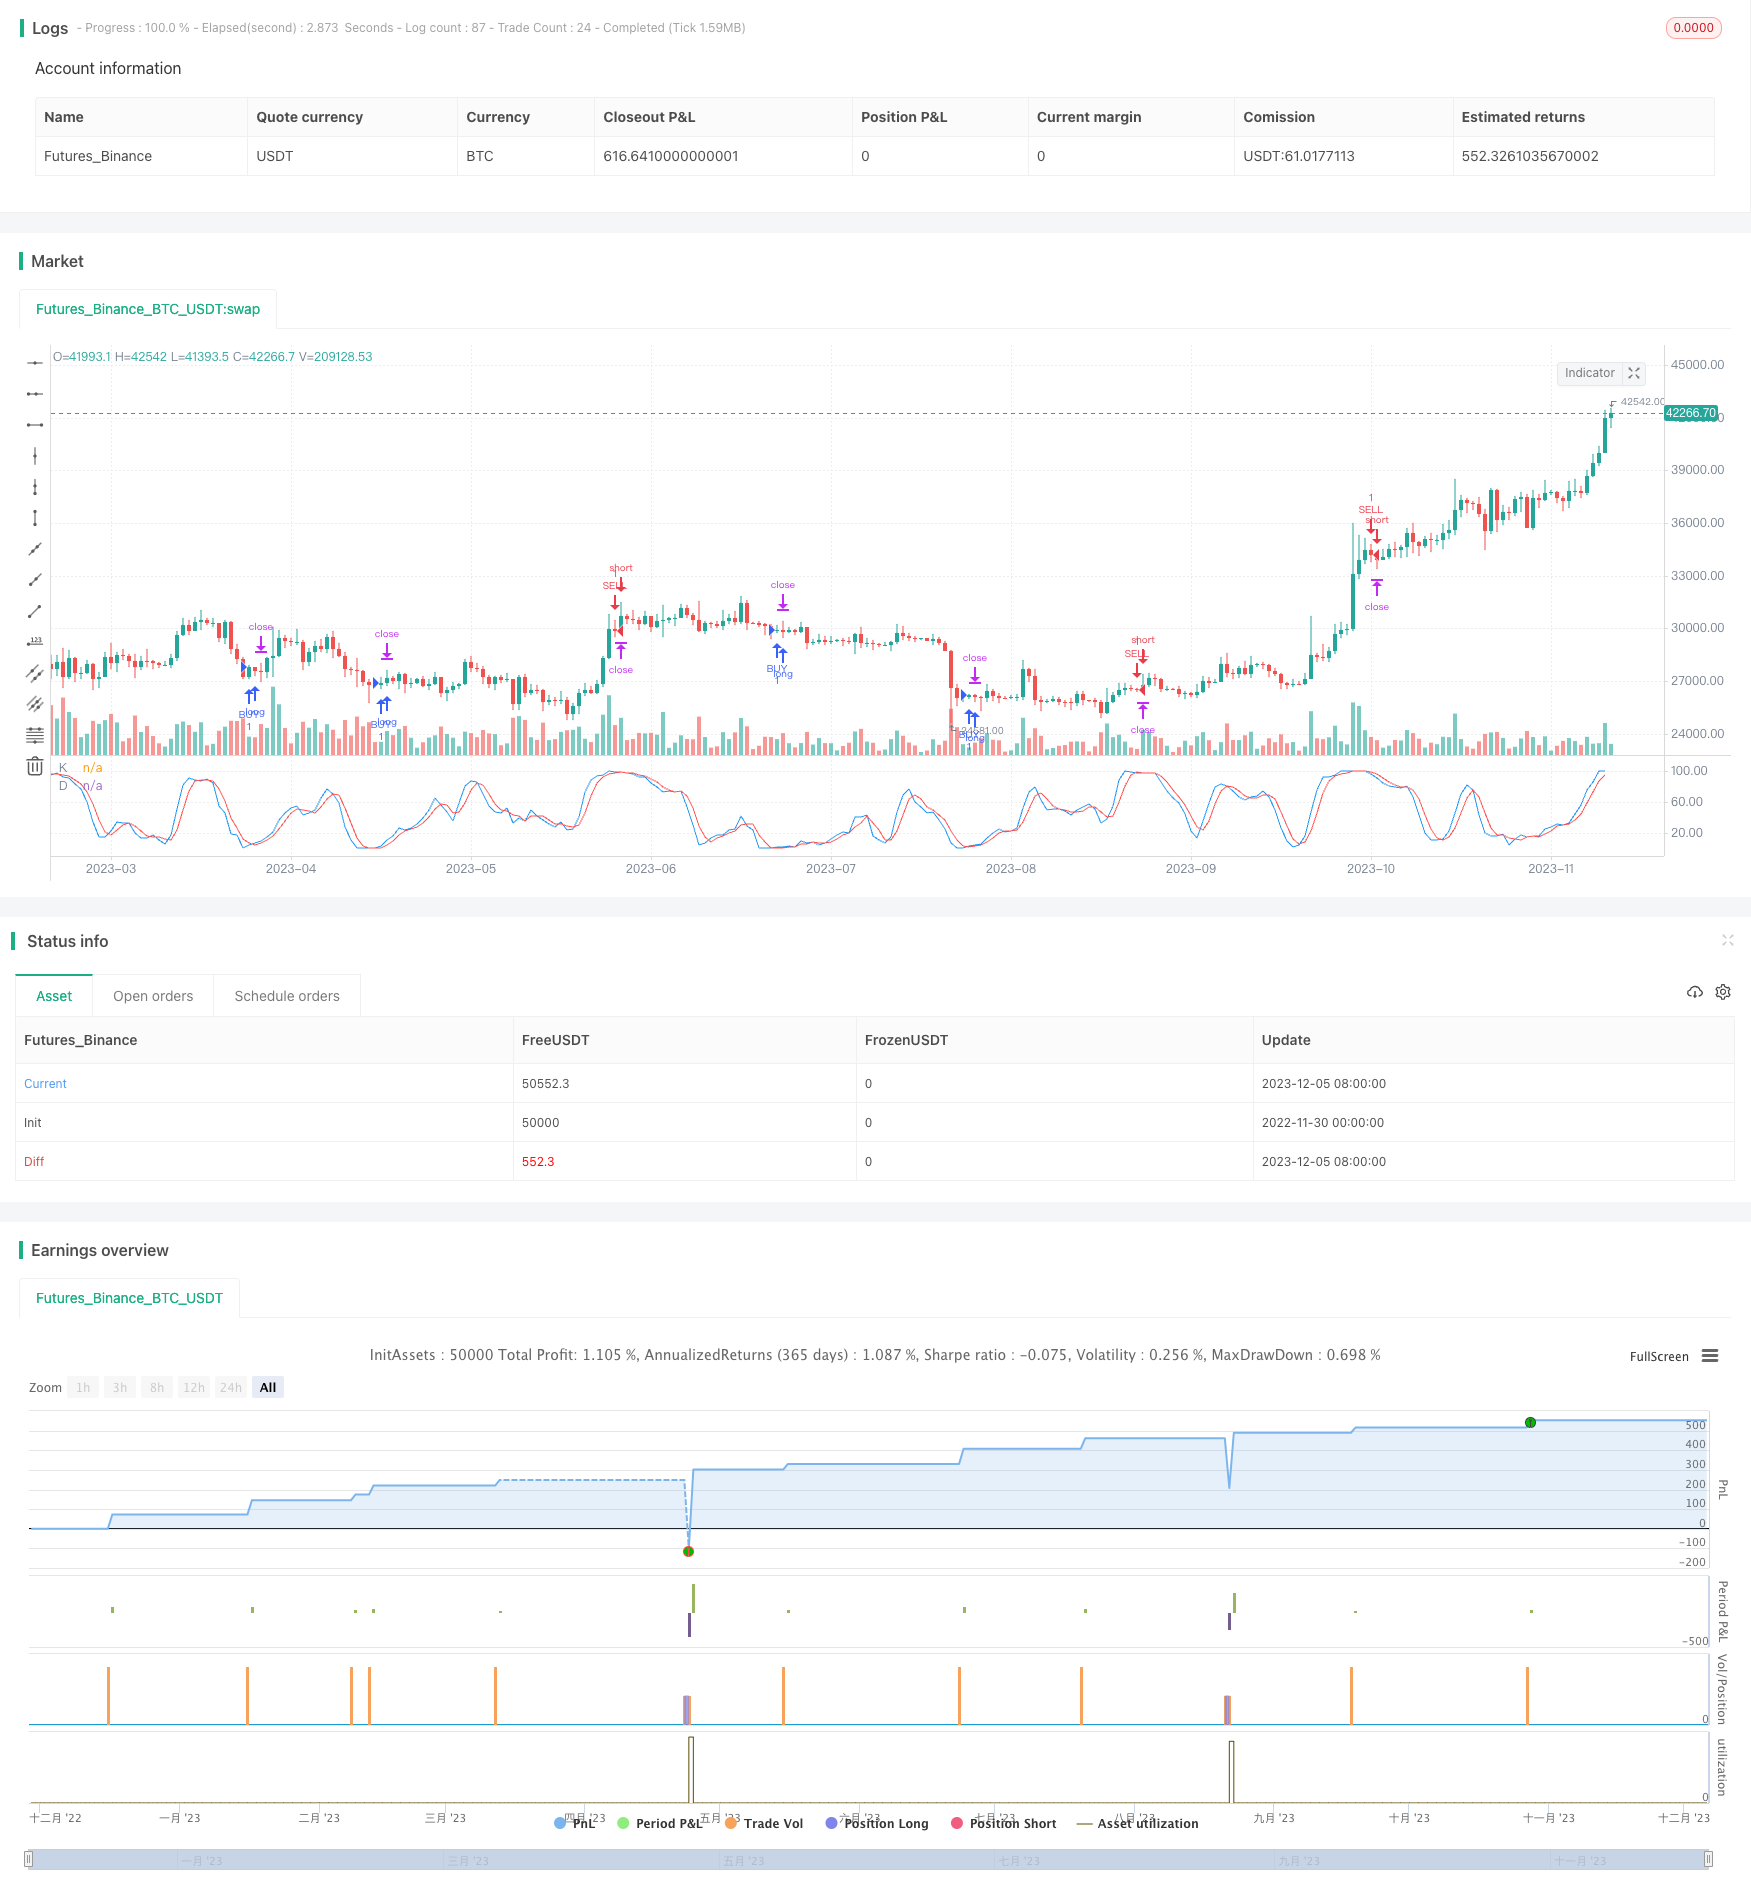
Overview
This strategy is developed based on the StochRSI indicator. The strategy mainly uses the StochRSI indicator to judge overbought and oversold situations. Combined with the RSI indicator to filter out some false signals, go short when the StochRSI indicator shows overbought area and go long when it shows oversold area to make profits.
Strategy Principle
This strategy mainly applies the StochRSI indicator to judge overbought and oversold areas in the market. The StochRSI indicator consists of the K line and the D line. The K line reflects the position of the current RSI value in the RSI price range over a recent period. The D line is the moving average of the K line. When the K line crosses above the D line, it is an overbought area and long positions can be taken. When the K line falls below the D line, it is an oversold area and short positions can be taken.
Specifically, the strategy first calculates the value of the 14-period RSI indicator, and then applies the StochRSI indicator on the RSI indicator. The StochRSI indicator parameters are set with a length of 14, smoothed K line period of 3 and smoothed D line period of 3. When the K line crosses above the user-defined oversold area (default is 1), long position will be taken. When the K line falls below the user-defined overbought area (default is 99), short position will be taken.
In addition, stop loss and take profit parameters are set in the strategy. The stop loss is default to 10000. The take profit uses trailing stop with default trailing points of 300 and offset of 0.
Advantage Analysis
- Using StochRSI indicator to determine overbought and oversold areas is more reliable than single RSI indicator
- Filtering signals with RSI avoids false breakouts
- Setting stop loss and take profit mechanisms to control risks
Risk Analysis
- StochRSI indicator may have false signals
- Need to set overbought and oversold parameters reasonably, otherwise it will cause misoperation
- If stop loss point is too small, it's easy to be trapped. If take profit point is too large, the profit gaining may be limited.
For the above risks, longer cycle parameters can be set or consider using in combination with other indicators to filter out signals, adjust overbought and oversold parameters to adapt to different markets, and test different stop loss and take profit parameters.
Optimization Directions
- Consider using in combination with other indicators such as MACD, Bollinger Bands etc to filter out false signals
- Test different parameter cycle settings to adapt to more market conditions
- Optimize stop loss and take profit points by multiple backtestings to find the optimal parameters
Summary
This strategy trades based on overbought and oversold areas judged by the StochRSI indicator. Compared with single RSI indicator, StochRSI combines the idea of KDJ and can judge turning points more accurately. At the same time, false signals are filtered out by RSI and risks are controlled by stop loss and take profit. There is still large room for optimization, it can be combined with other indicators or optimized parameter settings.
Parameters
| Name | Default | What it controls |
|---|---|---|
| v_input_1 | 10 | lengthrsi |
| v_input_2 | true | overSold |
| v_input_3 | 99 | overBought |
| v_input_4 | 300 | call_trail_stop |
| v_input_5 | false | call_trail_offset |
| v_input_6 | 10000 | call_sl |
| v_input_7 | 3 | smoothK |
| v_input_8 | 3 | smoothD |
| v_input_9 | 14 | lengthRSI |
| v_input_10 | 14 | lengthStoch |
| v_input_11_close | 0 | RSI Source: close | high | low | open | hl2 | hlc3 | hlcc4 | ohlc4 |
Source Pine Script
/*backtest
start: 2023-11-06 00:00:00
end: 2023-12-06 00:00:00
period: 1h
basePeriod: 15m
exchanges: [{"eid":"Futures_Binance","currency":"BTC_USDT"}]
*/

//@version= 2
strategy("STOCHRSI JURE", overlay=false)
lengthrsi = input(10)
overSold = input( 1 )
overBought = input(99)

call_trail_stop = input(300)
call_trail_offset = input(0)
call_sl = input(10000)

price = ohlc4
vrsi = rsi(price, lengthrsi)

smoothK = input(3, minval=1)
smoothD = input(3, minval=1)
lengthRSI = input(14, minval=1)
lengthStoch = input(14, minval=1)
src = input(close, title="RSI Source")

rsi1 = rsi(src, lengthRSI)
k = sma(stoch(rsi1, rsi1, rsi1, lengthStoch), smoothK)
d = sma(k, smoothD)


plot( k, color=blue, linewidth=1, title="K")
plot( d, color=red, linewidth=1, title="D")

if (crossover(k, overSold) )
    strategy.entry("BUY", strategy.long, stop=close, oca_name="TREND",  comment="BUY")
    strategy.exit("BUY EXIT", "BUY", trail_points=call_trail_stop, trail_offset=call_trail_offset, loss = call_sl)


if (crossunder(k, overBought) )
    strategy.entry("SELL", strategy.short,stop=close, oca_name="TREND", comment="SELL")
    strategy.exit("SELL EXIT", "SELL", trail_points=call_trail_stop, trail_offset=call_trail_offset, loss = call_sl)


//if (  ( crossover(k,d)) and ( (vrsi<overSold) or crossover(vrsi,overSold) )  and   year >= yearfrom and year <= yearuntil and month>=monthfrom and month <=monthuntil and dayofmonth>=dayfrom and dayofmonth < dayuntil)
//    strategy.entry("BUY", strategy.long, stop=close, oca_name="TREND", oca_type=strategy.oca.cancel, comment="BUY")
//else
//    strategy.cancel(id="BUY")

//if ( ( crossunder(k,d) ) and ( (vrsi >overBought) or crossunder(vrsi,overBought) ) and   year >= yearfrom and year <= yearuntil and month>=monthfrom and month <=monthuntil and dayofmonth>=dayfrom and dayofmonth < dayuntil )
//    strategy.entry("SELL", strategy.short,stop=close, oca_name="TREND", oca_type=strategy.oca.cancel, comment="SELL")
//else
//    strategy.cancel(id="SELL")
Published by ChaoZhang on the FMZ strategy square · last modified 2023-12-07. Collected in the Quant Trading Vault. Unvalidated research: re-test with your own data and costs before trusting it.
Build this with AgenKit
A spec is not a trading system. Paste this into your coding agent and AgenKit runs a specialist team — architecture, test-first build, risk gates, review — with paper trading on by default.
/agenkit build a production-grade trading bot with a backtest engine, risk controls and paper trading by default from strategies/StochRSI-Based-Quantitative-Trading-Strategy.md- npx agenkit install engineering-kit in your project
- Paste the command into your agent and approve each phase
- Get tests, backtest, risk controls and a paper-trading switch
Understand it first
Before you run this, read the lesson behind the idea and how to backtest it honestly. Specs like this one are the survivors of an unknown number of trials; deflate their results accordingly.
Related specs
- Bollinger Band and Stoch RSI Trading StrategyPine Script · Breakout · 2d
- MACD Bollinger Turtle Trading StrategyPine Script · Breakout · 1d
- multiple technical indicators Momentum Breakout StrategyPine Script · Breakout · 1d
- Bollinger Bands Dynamic Breakout StrategyPine Script · Breakout · 1h
- Bull Market Tracking SystemPine Script · Breakout · 1h
- Cross boundary Dynamic Range Quantitative Trading Strategy Based on Bollinger BandsPine Script · Breakout · 3h