Strategy of Indicators Combination Breakthrough Trend Tracking
The strategy is named "Strategy of Indicators Combination Breakthrough Trend Tracking". It combines various indicators to identify market trend directions and carry out trend tracking operations. The main components…
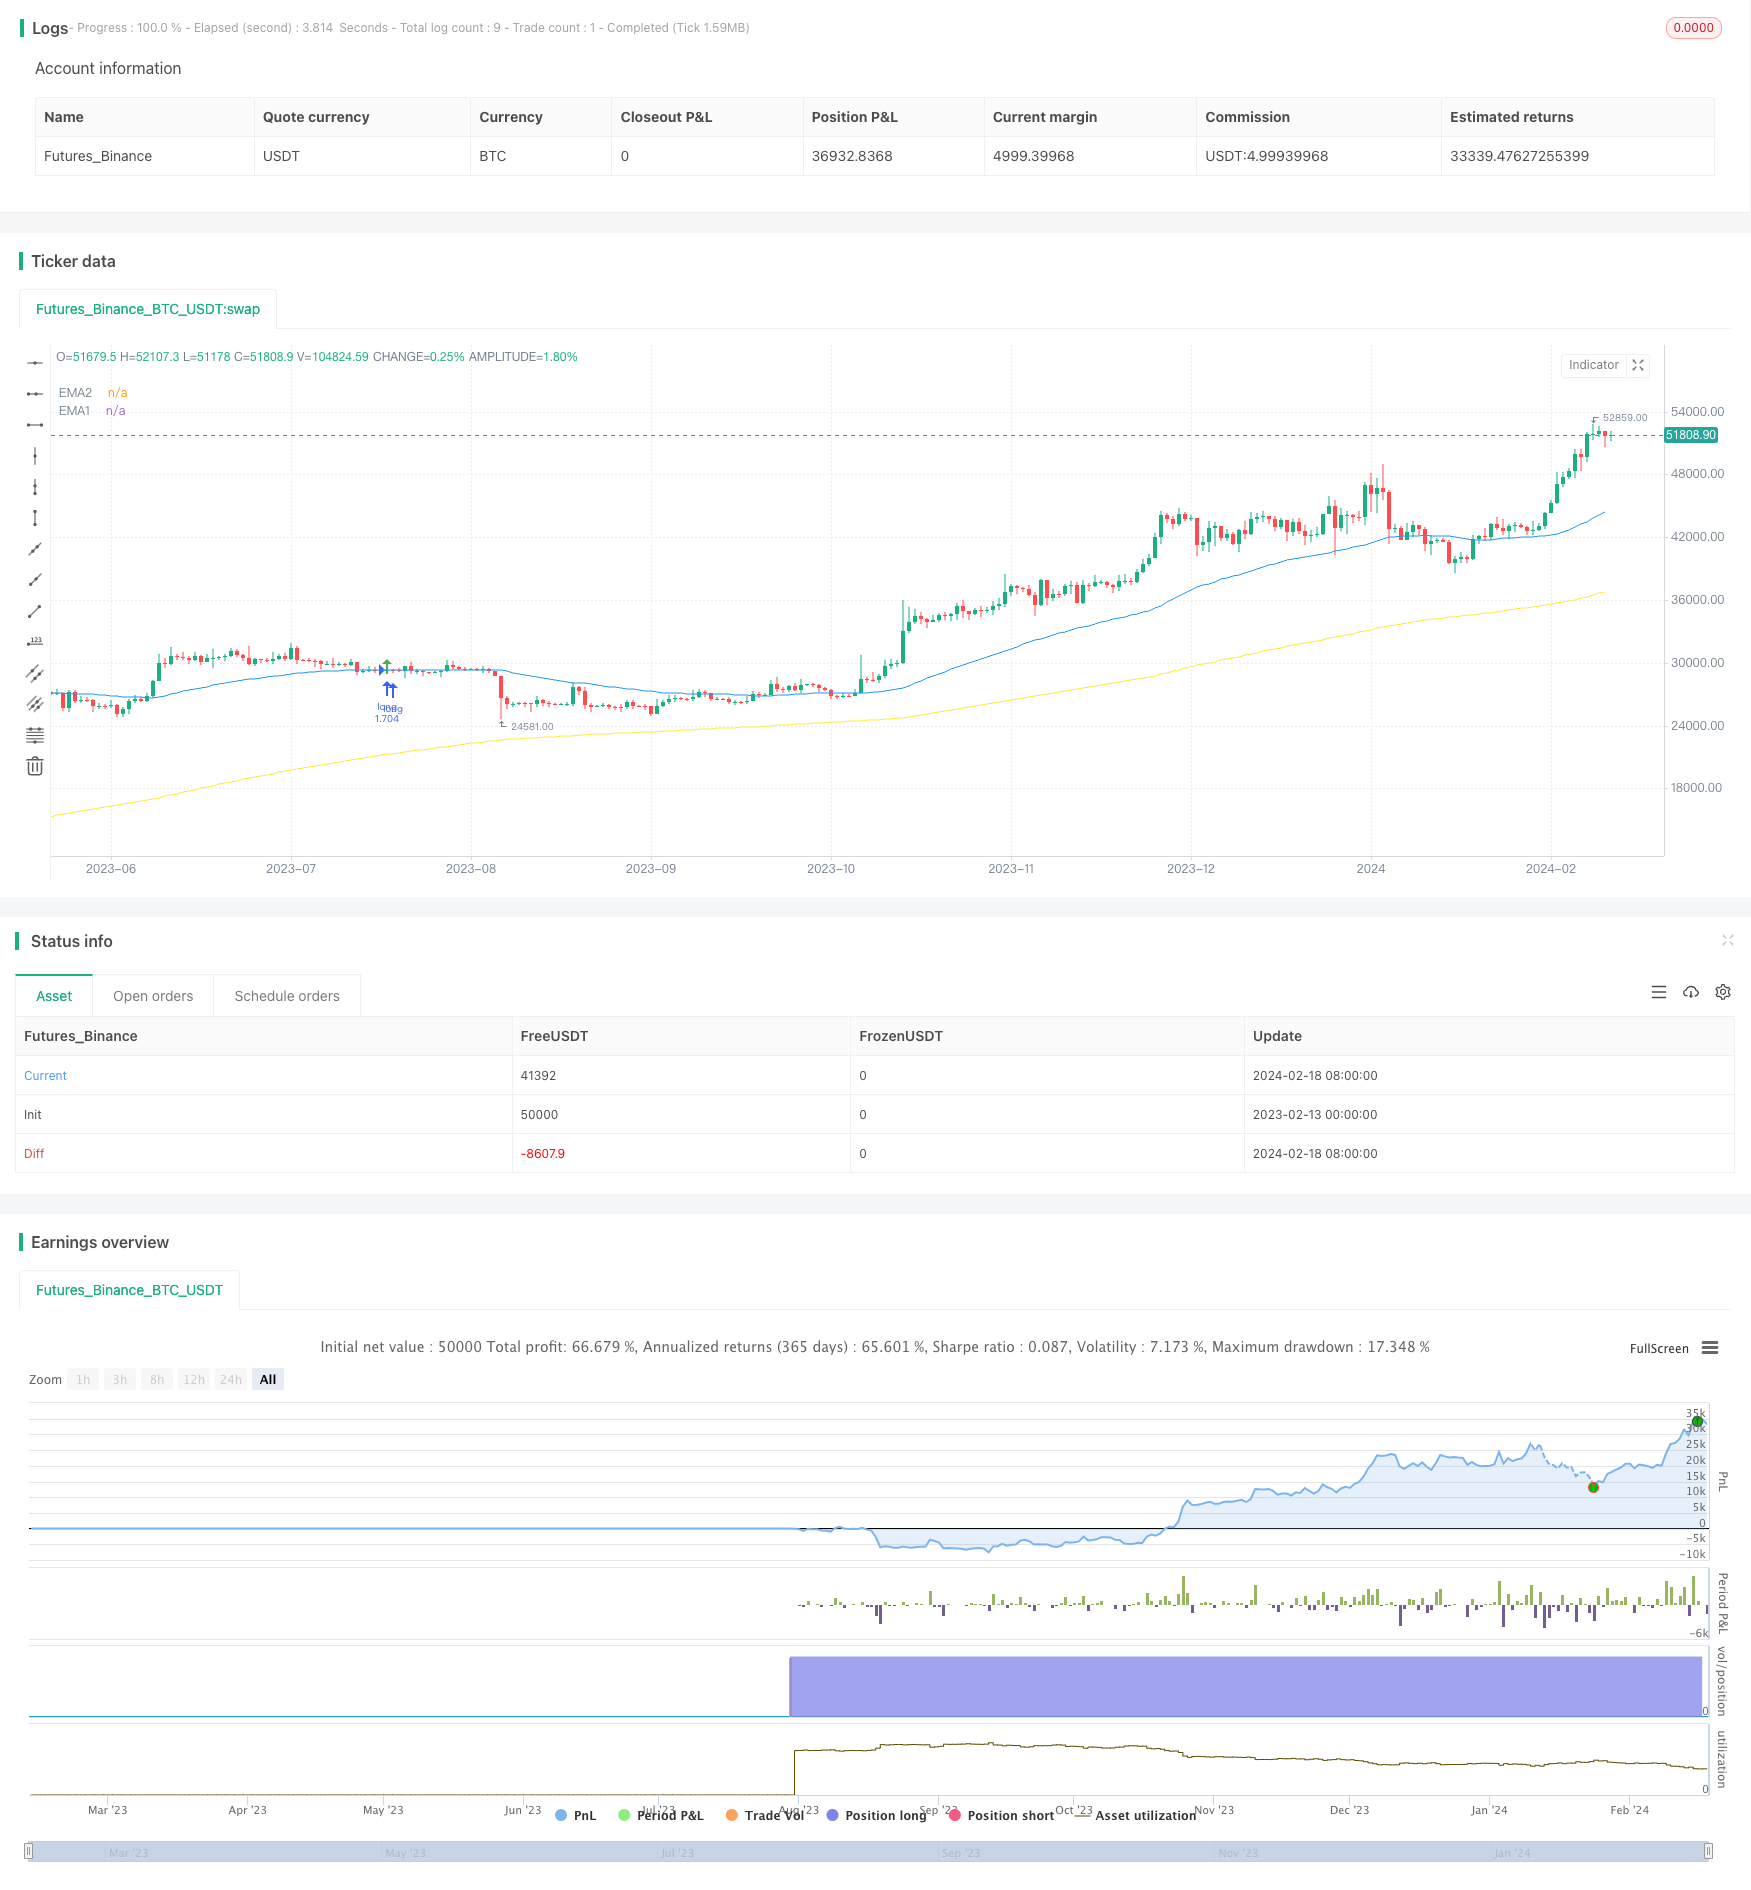
Overview
The strategy is named "Strategy of Indicators Combination Breakthrough Trend Tracking". It combines various indicators to identify market trend directions and carry out trend tracking operations. The main components include:
- Using Wave Trend indicator to judge the main trend of the market
- Filtering out some false signals with RSI and MFI indicators
- Determining specific operational directions with EMA indicator
- Entering the market with breakthrough tracking method to ensure following the trend
Strategy Principle
The strategy mainly judges the direction and strength of the major trend, and sets bidirectional trading of long and short. The specific operating principles are as follows:
Long signal:
- Price is above 200-day EMA, indicating a bull market
- Price pulls back to around 50-day EMA forming support
- Wave Trend reverses to upward trend and a buy signal appears
- Both RSI and MFI show overbought
- 3 consecutive K-lines break through 50-day EMA successively, indicating a breakthrough upwards
Short signal: Opposite of long signal
Profit taking and stop loss: Two options provided: lowest price/highest price stop loss, ATR stop loss
Advantage Analysis
The strategy has the following advantages:
- Integrates multiple indicators to determine the major trend and avoid false breakouts
- Adopts EMA to determine operational direction, easy to follow trends
- Trailing stop loss method achieves sustained profits
- Capable of going both long and short, following the market in either direction
Risk Analysis
The strategy also has some risks:
- Probability of wrong signals from the indicators
- Stop loss point set too small, increasing stop loss risk
- High trading frequency leads to hidden loss from trading fees
To reduce the above risks, optimization can be done in the following aspects:
- Adjust indicator parameters to filter wrong signals
- Appropriately loosen the stop loss point
- Optimize indicator parameters to reduce trading frequency
Optimization Directions
From the code level, the main optimizable directions of this strategy include:
- Adjusting parameters of Wave Trend, RSI and MFI to find the best parameter combination
- Testing the performance of different EMA cycle parameters
- Adjusting risk-reward ratio factors of profit taking and stop loss to obtain optimal configuration
Through parameter adjustment and testing, the strategy can maximize returns while reducing drawdowns and risks.
Conclusion
The strategy integrates multiple indicators to determine the major trend direction, uses EMA indicator as specific operation signal, and uses trailing stop loss to lock in profits. Through parameter optimization, relatively good steady profits can be obtained. But the certain system risks should also be noted, the effectiveness of indicators and changes in market environment need to be continuously monitored.
Parameters
| Name | Default | What it controls |
|---|---|---|
| v_input_1 | true | FromMonth |
| v_input_2 | true | FromDay |
| v_input_3 | 2020 | FromYear |
| v_input_4 | true | ToMonth |
| v_input_5 | true | ToDay |
| v_input_6 | 9999 | ToYear |
| v_input_7 | 12 | Channel Length |
| v_input_8 | 12 | Average Length |
| v_input_9 | 53 | WT Overbought Level 1 |
| v_input_10 | -53 | WT Oversold Level 1 |
| v_input_11 | 2 | MFI Area Y Pos |
| v_input_12 | 80 | MFI Period |
| v_input_13 | 200 | MFI Area multiplier |
| v_input_14 | 30 | EMA Timeframe |
| v_input_15 | 200 | EMA1 Length |
| v_input_16 | 50 | EMA2 Length |
| v_input_17 | true | Enable long? |
| v_input_18 | true | Enable short? |
| v_input_19 | false | SL Buffer |
| v_input_20 | false | Enable lowest low/ highest high exit? |
| v_input_21 | 2 | ProfitfactorLong |
| v_input_22 | 50 | Lowest Low Lookback |
| v_input_23 | 2 | ProfitfactorShort |
| v_input_24 | 50 | highest high lookback |
| v_input_25 | true | Enable ATR exit? |
| v_input_26 | 6 | ATR Profitfactor Long |
| v_input_27 | 5 | ATR Stopfactor Long |
| v_input_28 | 3 | ATR Profitfactor Short |
| v_input_29 | 5 | ATR Stopfactor Short |
| v_input_30 | 11 | ATR Length |
Source Pine Script
/*backtest
start: 2023-02-13 00:00:00
end: 2024-02-19 00:00:00
period: 1d
basePeriod: 1h
exchanges: [{"eid":"Futures_Binance","currency":"BTC_USDT"}]
*/

//@version=4
//Lowest Low/ Highest High & ATR Stop Loss/ Take Profit
//Optimized for the 30 minutes chart

strategy(title="TradePro's Trading Idea Cipher B+ Divergence EMA Pullback Strategy", shorttitle="WT MFI RSI EMA PB STRAT", overlay = true, pyramiding = 0, max_bars_back=5000, calc_on_order_fills = false, commission_type =  strategy.commission.percent, commission_value = 0, default_qty_type = strategy.percent_of_equity, default_qty_value = 100, initial_capital=5000, currency=currency.USD)

// { Time Range
FromMonth=input(defval=1,title="FromMonth",minval=1,maxval=12)
FromDay=input(defval=1,title="FromDay",minval=1,maxval=31)
FromYear=input(defval=2020,title="FromYear",minval=2016)
ToMonth=input(defval=1,title="ToMonth",minval=1,maxval=12)
ToDay=input(defval=1,title="ToDay",minval=1,maxval=31)
ToYear=input(defval=9999,title="ToYear",minval=2017)
start=timestamp(FromYear,FromMonth,FromDay,00,00)
finish=timestamp(ToYear,ToMonth,ToDay,23,59)
window()=>true

// See if this bar's time happened on/after start date
afterStartDate = time >= start and time<=finish?true:false

zeroline = 0

// } Time Range

// { Wavetrend, RSI, MFI

// WaveTrend
cl = input(12, "Channel Length")
al = input(12, "Average Length")
overbought = input(53, title = 'WT Overbought Level 1', type = input.integer)
oversold = input(-53, title = 'WT Oversold Level 1', type = input.integer)
ap = hlc3
esa = ema(ap, cl)
d = ema(abs(ap - esa), cl)
ci = (ap - esa) / (0.015 * d)
tci = ema(ci, al)

wt1 = tci
wt2 = sma(wt1,4)

wtOs = wt2 <= oversold
wtOb = wt2 >= overbought
wtX = cross(wt1, wt2)
wtUp = wt2 - wt1 <= 0
wtDown = wt2 - wt1 >= 0
buySignal = wtX and wtOs and wtUp
sellSignal = wtX and wtOb and wtDown

// RSI & MFI

rsiMFIPosY = input(2, title = 'MFI Area Y Pos', type = input.float)
rsiMFIperiod = input(80,title = 'MFI Period', type = input.integer)
rsiMFIMultiplier = input(200, title = 'MFI Area multiplier', type = input.float)
f_rsimfi(_period, _multiplier, _tf) => security(syminfo.tickerid, _tf, sma(((close - open) / (high - low)) * _multiplier, _period) - rsiMFIPosY)
rsiMFI = f_rsimfi(rsiMFIperiod, rsiMFIMultiplier, timeframe.period)

// } Wavetrend, RSI, MFI

// { EMA
emasrc = close
res = input(title="EMA Timeframe", type=input.resolution, defval="30")
len1 = input(title="EMA1 Length", type=input.integer, defval=200)
col1 = color.yellow

len2 = input(title="EMA2 Length", type=input.integer, defval=50)
col2 = color.blue

// Calculate EMA
ema1 = ema(emasrc, len1)
emaSmooth1 = security(syminfo.tickerid, res, ema1, barmerge.gaps_off, barmerge.lookahead_off)

ema2 = ema(emasrc, len2)
emaSmooth2 = security(syminfo.tickerid, res, ema2, barmerge.gaps_off, barmerge.lookahead_off)

// Draw EMA
plot(emaSmooth1, title="EMA1", linewidth=1, color=col1)
plot(emaSmooth2, title="EMA2", linewidth=1, color=col2)

// } EMA

// { Long Entry

enablelong = input(true, title="Enable long?")

//Long Signal
upcondition = close > emaSmooth1
wavetrendlong = wt1 and wt2 < zeroline
mfilong = rsiMFI > 0
emapblong1 = (close > emaSmooth2) and (close[1] < emaSmooth2[1])
emapblong2 = ((close[2] > emaSmooth2[2]) and (close[3] > emaSmooth2[3]) and (close[4] > emaSmooth2[4])) or ((close[5] > emaSmooth2[5]) and (close[6] > emaSmooth2[6]) and (close[7] > emaSmooth2[7])) or ((close[8] > emaSmooth2[8]) and (close[9] > emaSmooth2[9]) and (close[10] > emaSmooth2[10]))

longcondition = upcondition and wavetrendlong and buySignal and mfilong and emapblong1 and emapblong2

//strategy buy long
if (longcondition) and (afterStartDate) and strategy.opentrades < 1 and (enablelong == true)
    strategy.entry("long", strategy.long)

plotshape(longcondition, style=shape.arrowup,
                 location=location.abovebar, color=color.green)

// } Long Entry

// { Short Entry

enableshort = input(true, title="Enable short?")

//Short Signal
downcondition = close < emaSmooth1
wavetrendshort = wt1 and wt2 > zeroline
mfishort = rsiMFI < 0
emapbshort1 = (close < emaSmooth2) and (close[1] > emaSmooth2[1])
emapbshort2 = ((close[2] < emaSmooth2[2]) and (close[3] < emaSmooth2[3]) and (close[4] < emaSmooth2[4])) or ((close[5] < emaSmooth2[5]) and (close[6] < emaSmooth2[6]) and (close[7] < emaSmooth2[7])) or ((close[8] < emaSmooth2[8]) and (close[9] < emaSmooth2[9]) and (close[10] < emaSmooth2[10]))

shortcondition = downcondition and wavetrendshort and sellSignal and mfishort and emapbshort1 and emapbshort2

//strategy buy short
if (shortcondition) and (afterStartDate) and strategy.opentrades < 1 and (enableshort == true)
    strategy.entry("short", strategy.short)

plotshape(shortcondition, style=shape.arrowdown,
                 location=location.belowbar, color=color.red)

// } Short Entry

// { Exit Conditions
bought = strategy.position_size[1] < strategy.position_size
sold = strategy.position_size[1] > strategy.position_size
barsbought = barssince(bought)
barssold = barssince(sold)
slbuffer = input(title="SL Buffer", type=input.float, step=0.1, defval=0)

// } Exit Conditions

// { Lowest Low/ Highes High Exit Condition
enablelowhigh = input(false, title="Enable lowest low/ highest high exit?")

//Lowest Low LONG
profitfactorlong = input(title="ProfitfactorLong", type=input.float, step=0.1, defval=2)
loLen = input(title="Lowest Low Lookback", type=input.integer,
  defval=50, minval=2)
stop_level_long = lowest(low, loLen)[1]

if enablelowhigh == true and strategy.position_size>0
    profit_level_long = strategy.position_avg_price + ((strategy.position_avg_price - stop_level_long[barsbought])*profitfactorlong) + slbuffer
    strategy.exit(id="TP/ SL", stop=stop_level_long[barsbought] - slbuffer, limit=profit_level_long)

//Lowest Low SHORT
profitfactorshort = input(title="ProfitfactorShort", type=input.float, step=0.1, defval=2)
highLen = input(title="highest high lookback", type=input.integer,
  defval=50, minval=2)
stop_level_short = highest(high, highLen)[1]

if enablelowhigh == true and strategy.position_size<0
    profit_level_short = strategy.position_avg_price - ((stop_level_short[barssold] - strategy.position_avg_price)*profitfactorshort) - slbuffer
    strategy.exit(id="TP/ SL", stop=stop_level_short[barssold] + slbuffer, limit=profit_level_short)

// } Lowest Low/ Highes High Exit Condition

// { ATR Take Profit/ Stop Loss
enableatr = input(true, title="Enable ATR exit?")
atrprofitfactorlong = input(title="ATR Profitfactor Long", type=input.float, step=0.1, defval=6)
atrstopfactorlong = input(title="ATR Stopfactor Long", type=input.float, step=0.1, defval=5)
atrprofitfactorshort = input(title="ATR Profitfactor Short", type=input.float, step=0.1, defval=3)
atrstopfactorshort = input(title="ATR Stopfactor Short", type=input.float, step=0.1, defval=5)

//ATR
lengthATR = input(title="ATR Length", defval=11, minval=1)
atr = atr(lengthATR)

//LONG EXIT
if (afterStartDate) and ((enableatr == true) and (strategy.opentrades > 0))
    barsbought1 = barssince(bought)
    profit_level = strategy.position_avg_price + (atr*atrprofitfactorlong)
    stop_level = strategy.position_avg_price - (atr*atrstopfactorlong)
    strategy.exit("Take Profit/ Stop Loss", "long", stop=stop_level[barsbought1], limit=profit_level[barsbought1])

//SHORT EXIT
if (afterStartDate) and ((enableatr == true) and (strategy.opentrades > 0))
    barssold1 = barssince(sold)
    profit_level = strategy.position_avg_price - (atr*atrprofitfactorshort)
    stop_level = strategy.position_avg_price + (atr*atrstopfactorshort)
    strategy.exit("Take Profit/ Stop Loss", "short", stop=stop_level[barssold1], limit=profit_level[barssold1])

// } ATR Take Profit/ Stop LossPublished by ChaoZhang on the FMZ strategy square · last modified 2024-02-20. Collected in the Quant Trading Vault. Unvalidated research: re-test with your own data and costs before trusting it.
Build this with AgenKit
A spec is not a trading system. Paste this into your coding agent and AgenKit runs a specialist team — architecture, test-first build, risk gates, review — with paper trading on by default.
/agenkit build a production-grade trading bot with a backtest engine, risk controls and paper trading by default from strategies/Strategy-of-Indicators-Combination-Breakthrough-Trend-Tracking.md- npx agenkit install engineering-kit in your project
- Paste the command into your agent and approve each phase
- Get tests, backtest, risk controls and a paper-trading switch
Understand it first
Before you run this, read the lesson behind the idea and how to backtest it honestly. Specs like this one are the survivors of an unknown number of trials; deflate their results accordingly.
Related specs
- Dual MA Momentum Breakout StrategyPine Script · Breakout · 1h
- EMA and Bollinger Bands Breakout StrategyPine Script · Breakout · 1h
- Momentum Breakout Moving Average StrategyPine Script · Breakout · 1d
- Momentum Breakout Trading Strategy 440964Pine Script · Breakout · 5m
- Moving Average Crossover and Upper Rail Breakthrough Impulse StrategyPine Script · Breakout · 1m
- Multi Filter Trend Breakthrough Smart Moving Average Trading StrategyPine Script · Breakout · 1h