TD Sequential Breakout and Retracement Buy Sell Strategy
This strategy is a TD Sequential-based breakout and retracement buy/sell strategy. It identifies potential trend reversal points by recognizing the 8th and 9th candles in the TD sequence. Additionally, the strategy…
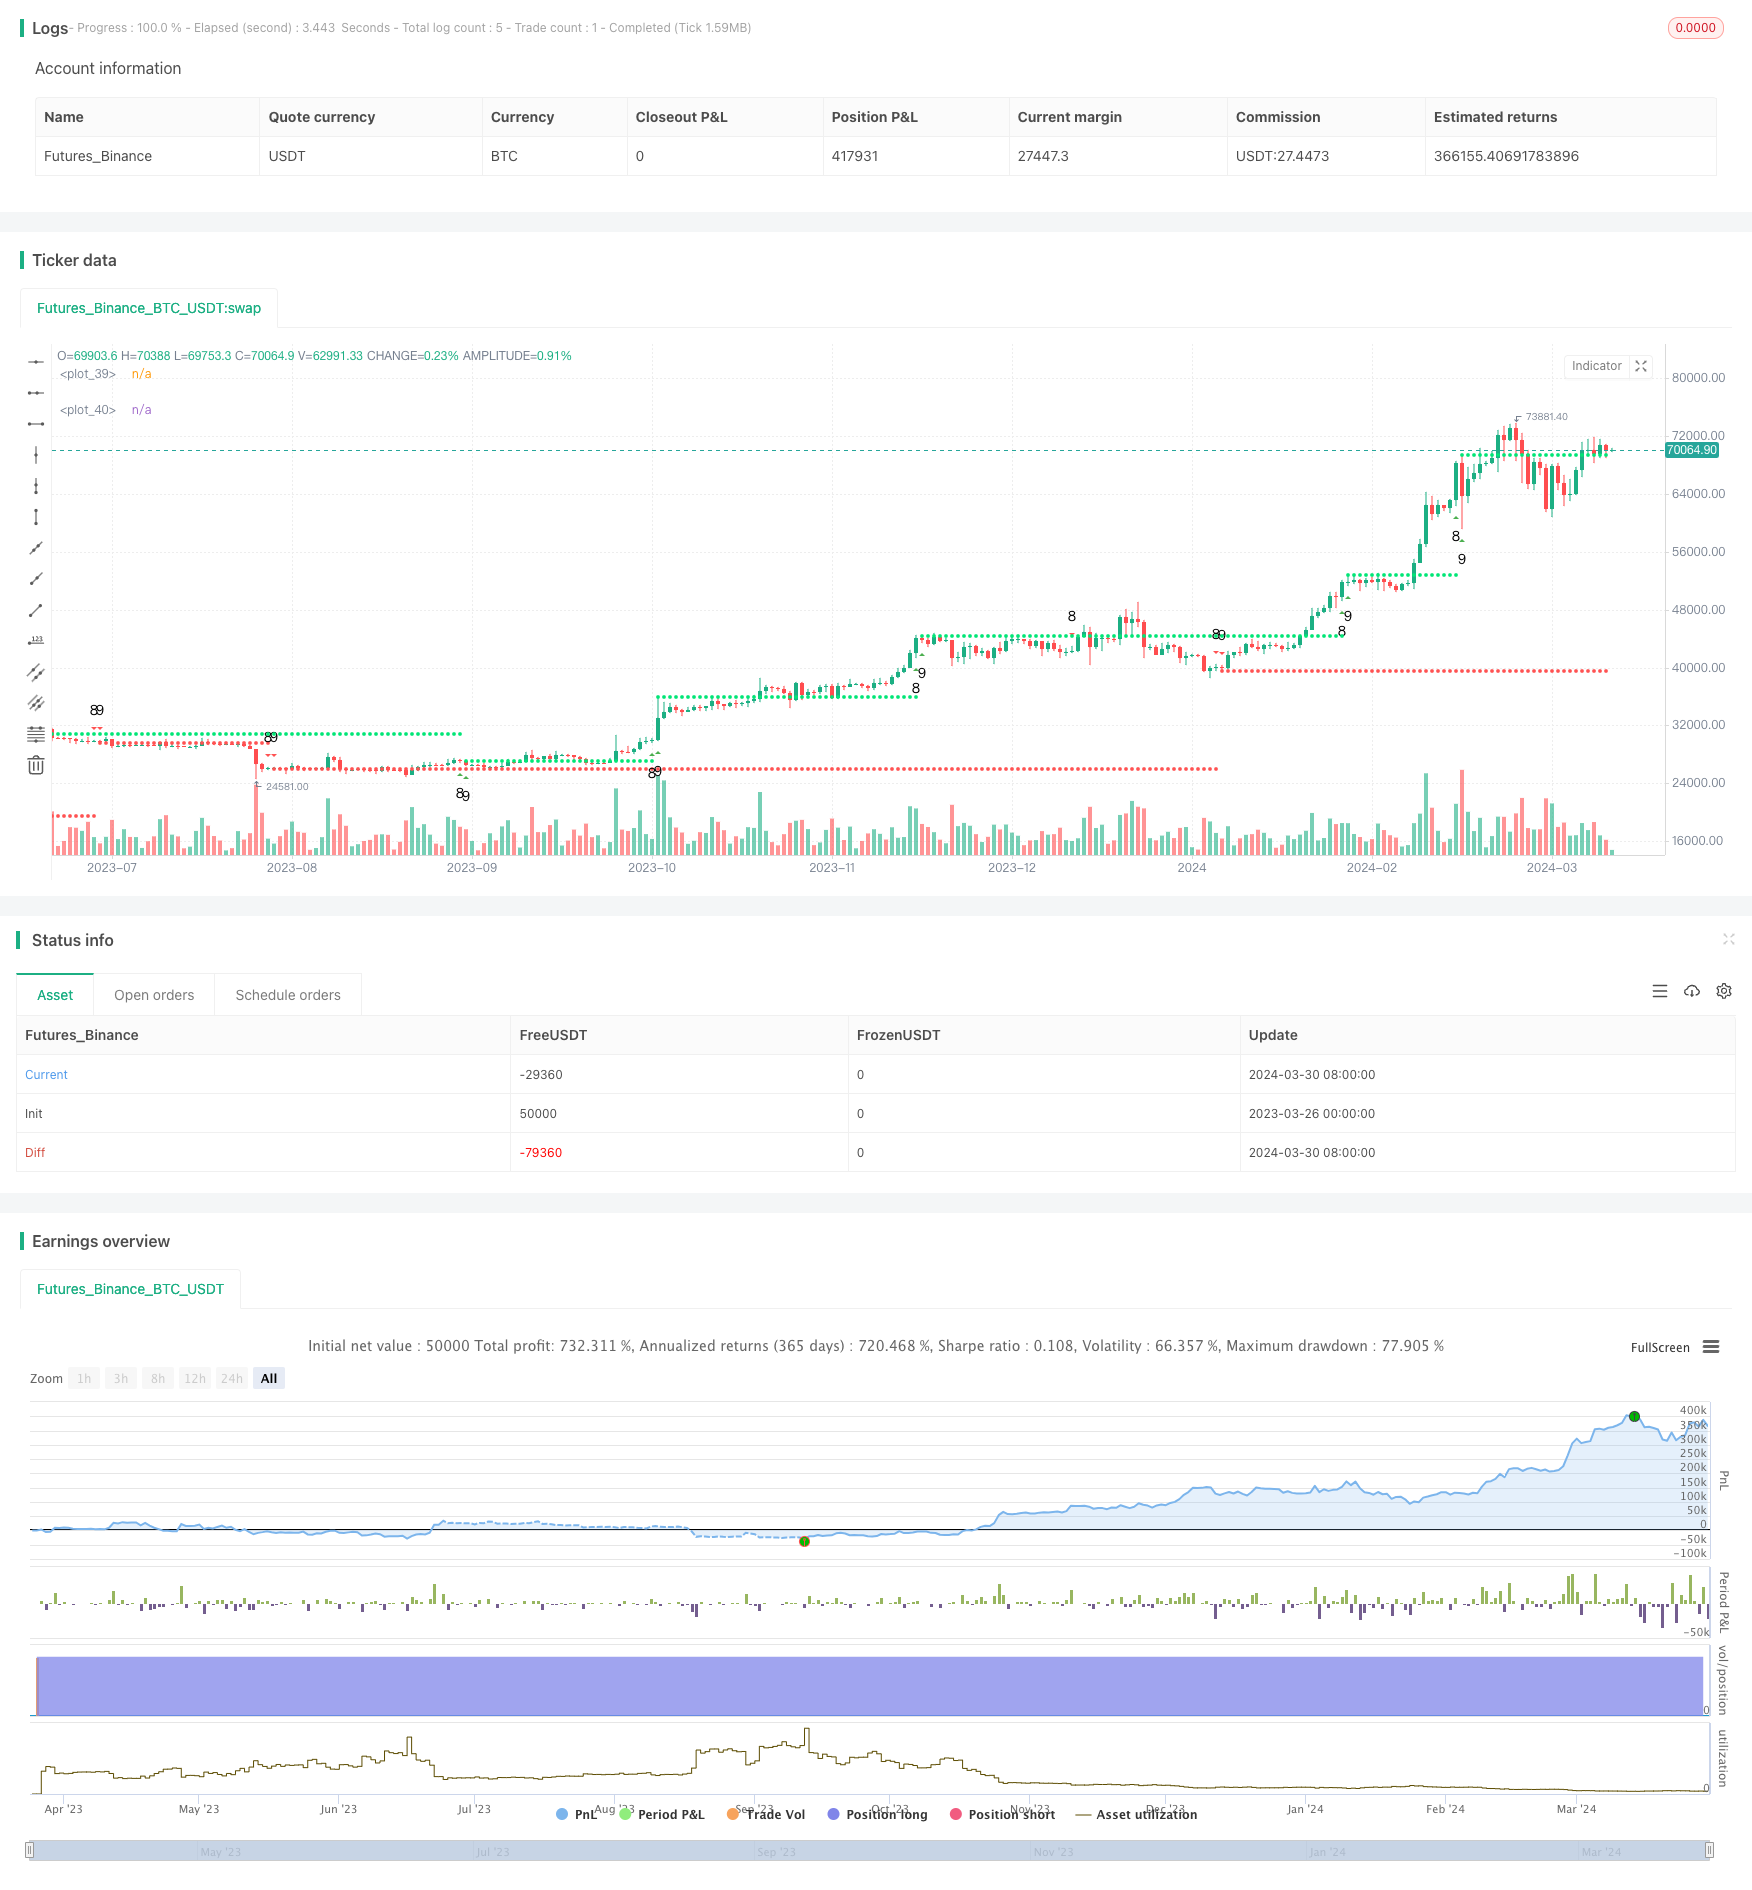
Overview
This strategy is a TD Sequential-based breakout and retracement buy/sell strategy. It identifies potential trend reversal points by recognizing the 8th and 9th candles in the TD sequence. Additionally, the strategy considers the retracement after the TD sequence breakout to improve the accuracy of entry points. Moreover, it utilizes moving averages as an auxiliary tool for trend determination.
Strategy Principles
- Calculate the TD sequence: Determine whether there are 8 or 9 consecutive up (down) candles by comparing the current closing price with the closing price 4 candles ago.
- Determine buy/sell points: When there are 8 or 9 consecutive up (down) candles, mark the potential sell (buy) points at the 8th or 9th candle.
- Consider retracement: After the TD sequence breakout, observe whether the price retraces. If the breakout status is maintained at the 13th, 14th, 15th, or 16th candle, the breakout is considered valid; otherwise, it is deemed invalid.
- Trend determination: Use the relationship between the 10-day and 20-day moving averages to determine the current trend direction, which serves as a reference for buy/sell decisions.
Strategy Advantages
- Effectively identifies potential trend reversal points, especially in strong trends where retracement entry points after TD sequence breakouts often yield good risk-reward ratios.
- By considering the retracement after TD sequence breakouts, the strategy can effectively filter out some false signals and improve the accuracy of entry points.
- The use of moving averages helps determine the current trend direction, making the strategy more effective when trading in the direction of the trend.
Strategy Risks
- In choppy markets, the TD sequence may generate many false signals, leading to frequent trades and capital losses.
- The strategy is sensitive to parameter selection, and different market environments may require parameter optimization and adjustment.
- The strategy lacks a clear stop-loss mechanism and may suffer significant drawdowns when the market experiences violent fluctuations.
Strategy Optimization Directions
- Introduce more technical indicators, such as RSI and MACD, to improve signal reliability and filtering effects.
- For retracements after TD sequence breakouts, consider introducing more flexible judgment criteria, such as using indicators like ATR to dynamically adjust the tolerance for retracements.
- In terms of trend determination, try using more time period combinations, such as the relationship between short-, medium-, and long-term moving averages, to obtain a more comprehensive trend judgment.
- Introduce a clear stop-loss mechanism, such as dynamic stop-loss based on ATR, to control the maximum loss per trade.
Summary
By combining TD sequences and moving averages, this strategy can effectively identify potential trend reversal points and improve the accuracy of entry points by considering retracement situations. Although the strategy has some risks and limitations, it can be further enhanced in terms of robustness and profitability by introducing more technical indicators, optimizing trend determination methods, and setting clear stop-loss mechanisms.
Parameters
| Name | Default | What it controls |
|---|---|---|
| v_input_1 | true | Numbers |
| v_input_2 | true | SR |
Source Pine Script
/*backtest
start: 2023-03-26 00:00:00
end: 2024-03-31 00:00:00
period: 1d
basePeriod: 1h
exchanges: [{"eid":"Futures_Binance","currency":"BTC_USDT"}]
*/

//@version=4
strategy("Dipak Shankarrao Chavhan", shorttitle="Dipak Chavhan", overlay=true, pyramiding=0, default_qty_value=10)
Numbers = input(true)
SR = input(true)

var int TD = 0
var int TS = 0
var int TDUp = 0
var int TDDn = 0

TD := close > close[4] ? TD[1] + 1 : 0
TS := close < close[4] ? TS[1] + 1 : 0
TDUp := TD - valuewhen(TD < TD[1], TD, 1)
TDDn := TS - valuewhen(TS < TS[1], TS, 1)

plotshape(Numbers ? (TDUp == 8 ? true : na) : na, style=shape.triangleup, text="8", color=color.new(color.green, 0), location=location.belowbar)
plotshape(Numbers ? (TDUp == 9 ? true : na) : na, style=shape.triangleup, text="9", color=color.new(color.green, 0), location=location.belowbar)
plotshape(Numbers ? (TDDn == 8 ? true : na) : na, style=shape.triangledown, text="8", color=color.new(color.red, 0), location=location.abovebar)
plotshape(Numbers ? (TDDn == 9 ? true : na) : na, style=shape.triangledown, text="9", color=color.new(color.red, 0), location=location.abovebar)

priceflip = barssince(close < close[4])
sellsetup = close > close[4] and priceflip
sell = sellsetup and barssince(priceflip != 9)
sellovershoot = sellsetup and barssince(priceflip != 13)
sellovershoot1 = sellsetup and barssince(priceflip != 14)
sellovershoot2 = sellsetup and barssince(priceflip != 15)
sellovershoot3 = sellsetup and barssince(priceflip != 16)
priceflip1 = barssince(close > close[4])
buysetup = close < close[4] and priceflip1
buy = buysetup and barssince(priceflip1 != 9)
buyovershoot = buysetup and barssince(priceflip1 != 13)
buyovershoot1 = buysetup and barssince(priceflip1 != 14)
buyovershoot2 = buysetup and barssince(priceflip1 != 15)
buyovershoot3 = buysetup and barssince(priceflip1 != 16)
TDbuyh = valuewhen(buy, high, 0)
TDbuyl = valuewhen(buy, low, 0)
TDsellh = valuewhen(sell, high, 0)
TDselll = valuewhen(sell, low, 0)
plot(SR ? (TDbuyh ? TDbuyl : na) : na, style=plot.style_circles, linewidth=2, color=color.red)
plot(SR ? (TDselll ? TDsellh : na) : na, style=plot.style_circles, linewidth=2, color=color.lime)

sma1 = sma(close, 10)
sma2 = sma(close, 20)


if TDbuyh
    strategy.entry("Enter Long", strategy.long)
else if TDselll
    strategy.entry("Enter Short", strategy.short)
Published by ChaoZhang on the FMZ strategy square · last modified 2024-04-01. Collected in the Quant Trading Vault. Unvalidated research: re-test with your own data and costs before trusting it.
Build this with AgenKit
A spec is not a trading system. Paste this into your coding agent and AgenKit runs a specialist team — architecture, test-first build, risk gates, review — with paper trading on by default.
/agenkit build a production-grade trading bot with a backtest engine, risk controls and paper trading by default from strategies/TD-Sequential-Breakout-and-Retracement-Buy-Sell-Strategy.md- npx agenkit install engineering-kit in your project
- Paste the command into your agent and approve each phase
- Get tests, backtest, risk controls and a paper-trading switch
Understand it first
Before you run this, read the lesson behind the idea and how to backtest it honestly. Specs like this one are the survivors of an unknown number of trials; deflate their results accordingly.
Related specs
- Momentum Breakout Moving Average StrategyPine Script · Breakout · 1d
- Momentum Breakout Trading Strategy 440964Pine Script · Breakout · 5m
- Moving Average Crossover and Upper Rail Breakthrough Impulse StrategyPine Script · Breakout · 1m
- Quantitative Trading Strategy Based on Ichimoku with Multiple SignalsPine Script · Breakout · 1h
- Advanced Long Only Dynamic Trendline Breakout StrategyPine Script · Breakout · 1d
- Bollinger Bands Breakout Strategy 448080Pine Script · Breakout · 1h