The Momentum Burst Tracking Strategy
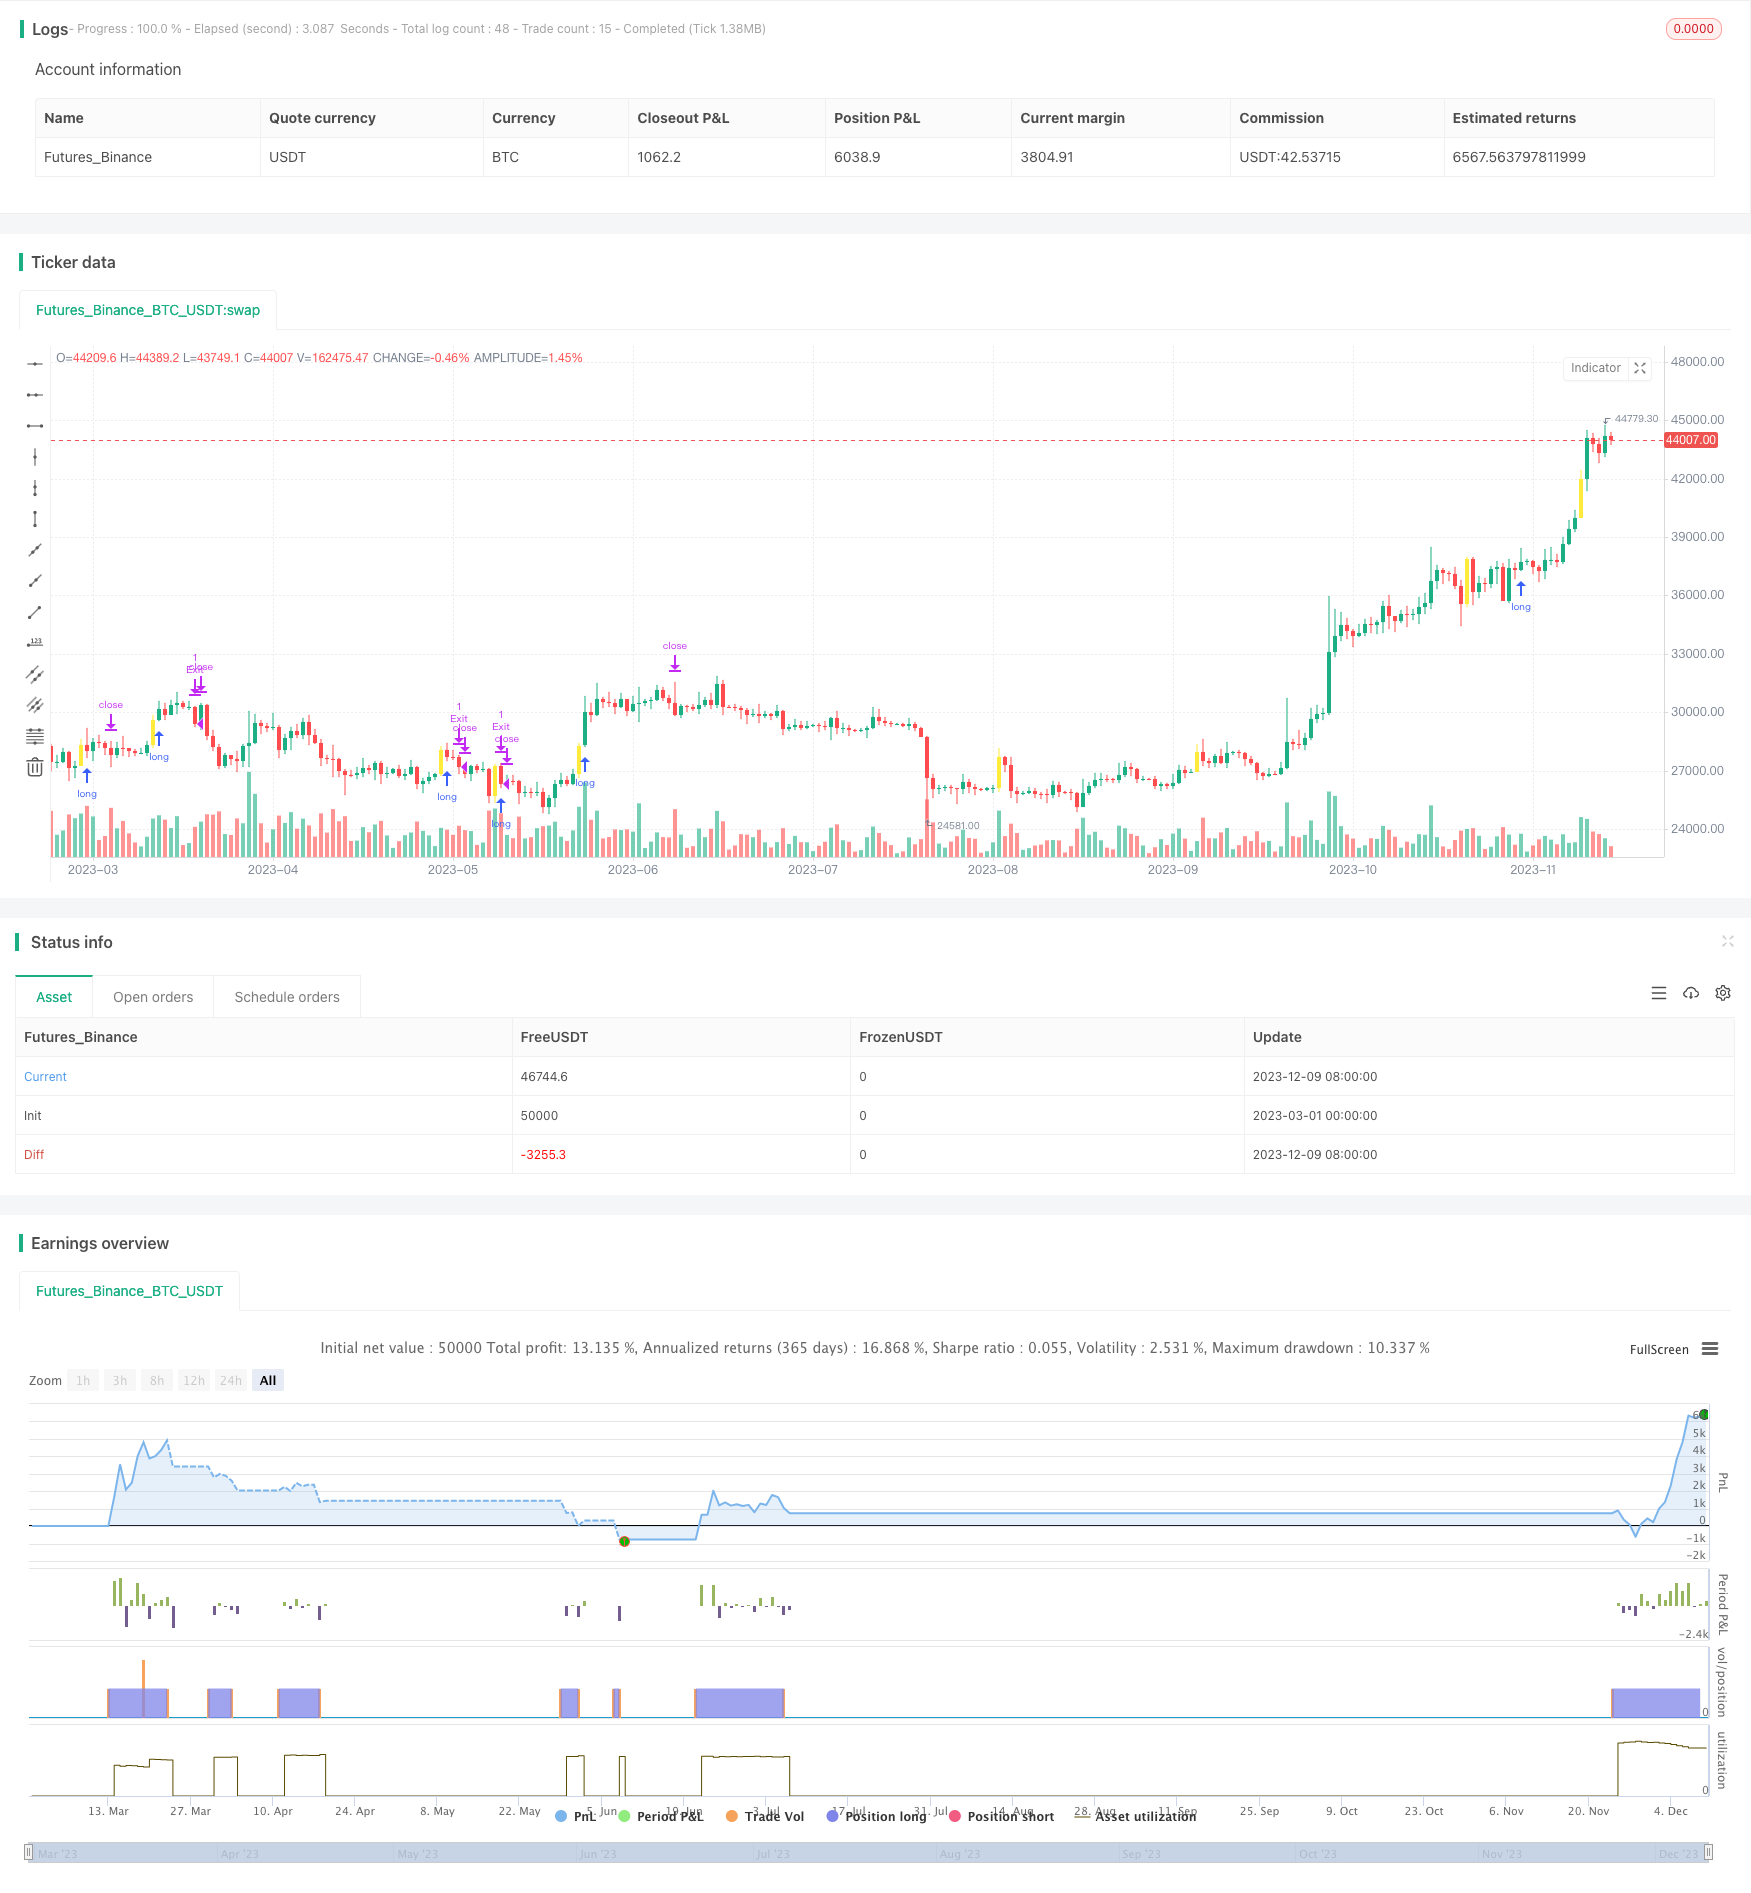
The Momentum Burst Tracking strategy judges price breakthroughs by calculating percentage price changes and filters signals with trading volume to implement high probability capturing of trend breakthrough points…
Overview
The Momentum Burst Tracking strategy judges price breakthroughs by calculating percentage price changes and filters signals with trading volume to implement high probability capturing of trend breakthrough points. After triggering a buy signal, this strategy uses price tracking stop loss to lock in profits and avoid excessive drawdowns.
Strategy Principle
The main indicators this strategy uses to determine entry signals are:
Percentage price change (isFourPercentBull) - Calculate the percentage change of the closing price relative to the previous day's closing price to determine if the price has effectively broken through.
Ratio of closing price to highest price (HighCloseRatio) - Calculate the ratio of the closing price to the highest price to determine the strength of the price breakthrough.
Trading volume (volume) - Require the trading volume to be greater than the previous day to ensure valid breakthrough.
200-day simple moving average (SMA) - Require the closing price and opening price to be higher than the 200-day line to determine the trend direction.
When the above multiple conditions are met at the same time, a buy signal is issued. Afterwards, the strategy uses price tracking stop loss to actively stop loss and lock in profits. Specifically, the calculation formula for the trailing stop loss line is:
trailPrice = close * (100 - trailPercent) / 100
Where trailPercent is the configurable trailing stop loss percentage. This ensures that as long as prices rise, the stop loss line will also rise to lock in profits. When prices fall back to the stop loss line, close positions to stop losses.
Advantages of the Strategy
As a typical breakout strategy, it has the following advantages:
Multi-condition filtering ensures the validity of the breakout and avoids false breakouts.
Adopt price tracking stop loss, which can actively cut losses and lock in profits to maximize avoiding drawdowns.
The strategy logic is simple and clear, easy to understand and optimize.
Risks of the Strategy
The strategy also has some risks:
There is still a probability of failed breakouts that cannot completely avoid losses.
Overly aggressive tracking stops may cause frequent stops.
Improper parameter settings can lead to excessive trading frequencies or missed signals.
The solutions to the corresponding risks are:
Optimize parameters and reduce stop loss magnitude to ensure sufficient room.
Reasonably relax the breakout conditions to ensure clear trends are not missed.
Test different varieties to evaluate strategy stability.
Optimization Directions
Considering the high frequency of stops in this strategy, the following directions can be further optimized:
Try other tracking stop loss methods, such as moving average tracking, ATR and volatility tracking.
Increase machine learning algorithms to train judgments of better performing parameter combinations based on historical data.
Add auxiliary judgment conditions based on volume breakouts to ensure effectiveness.
Evaluate differences in parameter settings across different varieties to find the best fit.
Conclusion
The Momentum Burst Tracking Strategy is a very practical trend tracking strategy overall. It solves the problem of inability to effectively stop loss and profit taking in breakout strategies, while still controlling risks well when capturing trends. With room for further improvement by introducing optimizations and machine learning, it is worth in-depth research and application.
Parameters
| Name | Default | What it controls |
|---|---|---|
| v_input_bool_1 | false | IncludeAvgVolume? |
| v_input_1 | 50 | VolumeLength |
| v_input_float_1 | 3 | Trail% |
| v_input_float_2 | 3.8 | BreakoutPercent |
| v_input_float_3 | 10 | Max Breakout |
| v_input_float_4 | 70 | Close to High Ratio |
| v_input_bool_3 | false | Plot MA? |
| v_input_bool_2 | true | (?Strategy)Custom Date Range? |
| v_input_2 | timestamp(1 Jan 2019 00:00) | FromDate |
| v_input_3 | timestamp(31 Dec 2023 00:00) | ToDate |
| v_input_string_1 | 0 | Select Position Size: Contract | Percent of Equity |
| v_input_int_1 | true | No of Contract |
Source Pine Script
/*backtest
start: 2023-03-01 00:00:00
end: 2023-12-10 05:20:00
period: 1d
basePeriod: 1h
exchanges: [{"eid":"Futures_Binance","currency":"BTC_USDT"}]
*/

// This source code is subject to the terms of the Mozilla Public License 2.0 at https://mozilla.org/MPL/2.0/
// © doks23

//@version=5
strategy(title = "SD:Momentum Burst", overlay=true, initial_capital=1000,commission_value = 0,slippage = 0,process_orders_on_close=true)

//Check Vol
checkVol = input.bool(defval=false,title="IncludeAvgVolume?")
volSMAlength = input(50, title="VolumeLength")
volumeSma = ta.sma(volume, volSMAlength)
highvolume = volume >= volumeSma
volumeCond=checkVol?highvolume:true

// Profit and Loss
trailPercent    = input.float(title="Trail%", defval=3, step=0.1)

//longCondition
PercentThreshold=input.float(3.8,'BreakoutPercent', step=0.1)
MaxThreshold=input.float(10,'Max Breakout', step=0.1)
HighCloseRatio=input.float(70,'Close to High Ratio', step=1)
float candleCloseBull = ((close[0] - open[0]) / (high[0] - open[0]) * 100)
float isFourPercentBull = (((close[0] - close[1]) / close[1]) * 100)
LongCond=volume > volume[1] and isFourPercentBull > PercentThreshold and candleCloseBull > HighCloseRatio and isFourPercentBull<MaxThreshold
barcolor(color=(LongCond?color.yellow: na),title='BObar')
longCondition= LongCond and volumeCond and close>ta.sma(close,200) and open>ta.sma(close,200)

//Input Strategy
DateCheck=  input.bool(title = 'Custom Date Range?', defval=true,group = 'Strategy')
FromDate=   input(defval = timestamp("1 Jan 2019 00:00"),group = 'Strategy')
ToDate      =input(defval = timestamp("31 Dec 2023 00:00"),group = 'Strategy')
PostionSize =input.string('Contract','Select Position Size',options = ['Percent of Equity','Contract'],group = 'Strategy')
ContractQty =input.int(1,'No of Contract',group = 'Strategy')

//Backtesting Date Range
TimeWindow=true
// Number of Contract
var int trade_qty=na
if(PostionSize=='Contract')
    trade_qty:=ContractQty
else
    trade_qty:= (strategy.equity>strategy.initial_capital)?math.floor(strategy.equity/strategy.initial_capital):ContractQty


//Position Buy
BuyTriggerPrice = ta.valuewhen(longCondition,high,0)
//Trailing price
var float trailPrice    = na
float percentMulti = (100 - trailPercent) / 100
longCondition2=longCondition and TimeWindow
if longCondition2
    strategy.entry("Long", strategy.long,qty=trade_qty,stop = BuyTriggerPrice)
    trailPrice := close*percentMulti
if strategy.position_size>0
    trailPrice := math.max(close*percentMulti,trailPrice[1])
    if low <= trailPrice
        strategy.exit('Exit','Long',stop = trailPrice)
        if strategy.position_size==0
            trailPrice:=na
// Plot Strategy
var float trail_long_SL=na
if strategy.position_size>0
    trail_long_SL:=trailPrice
else
    trail_long_SL:=na
//Strategy Plot
PlotMA=input.bool(title="Plot MA?", defval=false)
plot(PlotMA?ta.sma(close,10):na,color = color.red,title = '10MA')
plot(PlotMA?ta.sma(close,21):na,color = color.white,title = '21MA')
plot(PlotMA?ta.sma(close,200):na,color = color.orange,title = '200MA')
// plot(trail_long_SL,color = color.gray,style = plot.style_steplinebr,linewidth = 1)Published by ChaoZhang on the FMZ strategy square · last modified 2024-03-01. Collected in the Quant Trading Vault. Unvalidated research: re-test with your own data and costs before trusting it.
Build this with AgenKit
A spec is not a trading system. Paste this into your coding agent and AgenKit runs a specialist team — architecture, test-first build, risk gates, review — with paper trading on by default.
/agenkit build a production-grade trading bot with a backtest engine, risk controls and paper trading by default from strategies/The-Momentum-Burst-Tracking-Strategy.md- npx agenkit install engineering-kit in your project
- Paste the command into your agent and approve each phase
- Get tests, backtest, risk controls and a paper-trading switch
Understand it first
Before you run this, read the lesson behind the idea and how to backtest it honestly. Specs like this one are the survivors of an unknown number of trials; deflate their results accordingly.
Related specs
- ADX Momentum Trend StrategyPine Script · Momentum · 10m
- Adaptive Trend Following Strategy Based on Momentum OscillatorPine Script · Momentum · 1d
- Bollinger Bands Momentum Trend Following Quantitative StrategyPine Script · Momentum · 1d
- Confirmed SMA Crossover Momentum StrategyPine Script · Momentum · 1d
- Cross Momentum Trend Following Strategy SMA RSI Cross Momentum SystemPine Script · Momentum · 1h
- Dual Moving Average Momentum Trading Strategy Time Optimized Trend Following SystemPine Script · Momentum · 2m