Three Week High Low Momentum Trading Strategy
This strategy is a momentum trading strategy based on highs and lows over three periods. It uses price data from the past three weeks to identify potential buying and selling opportunities. The strategy primarily…
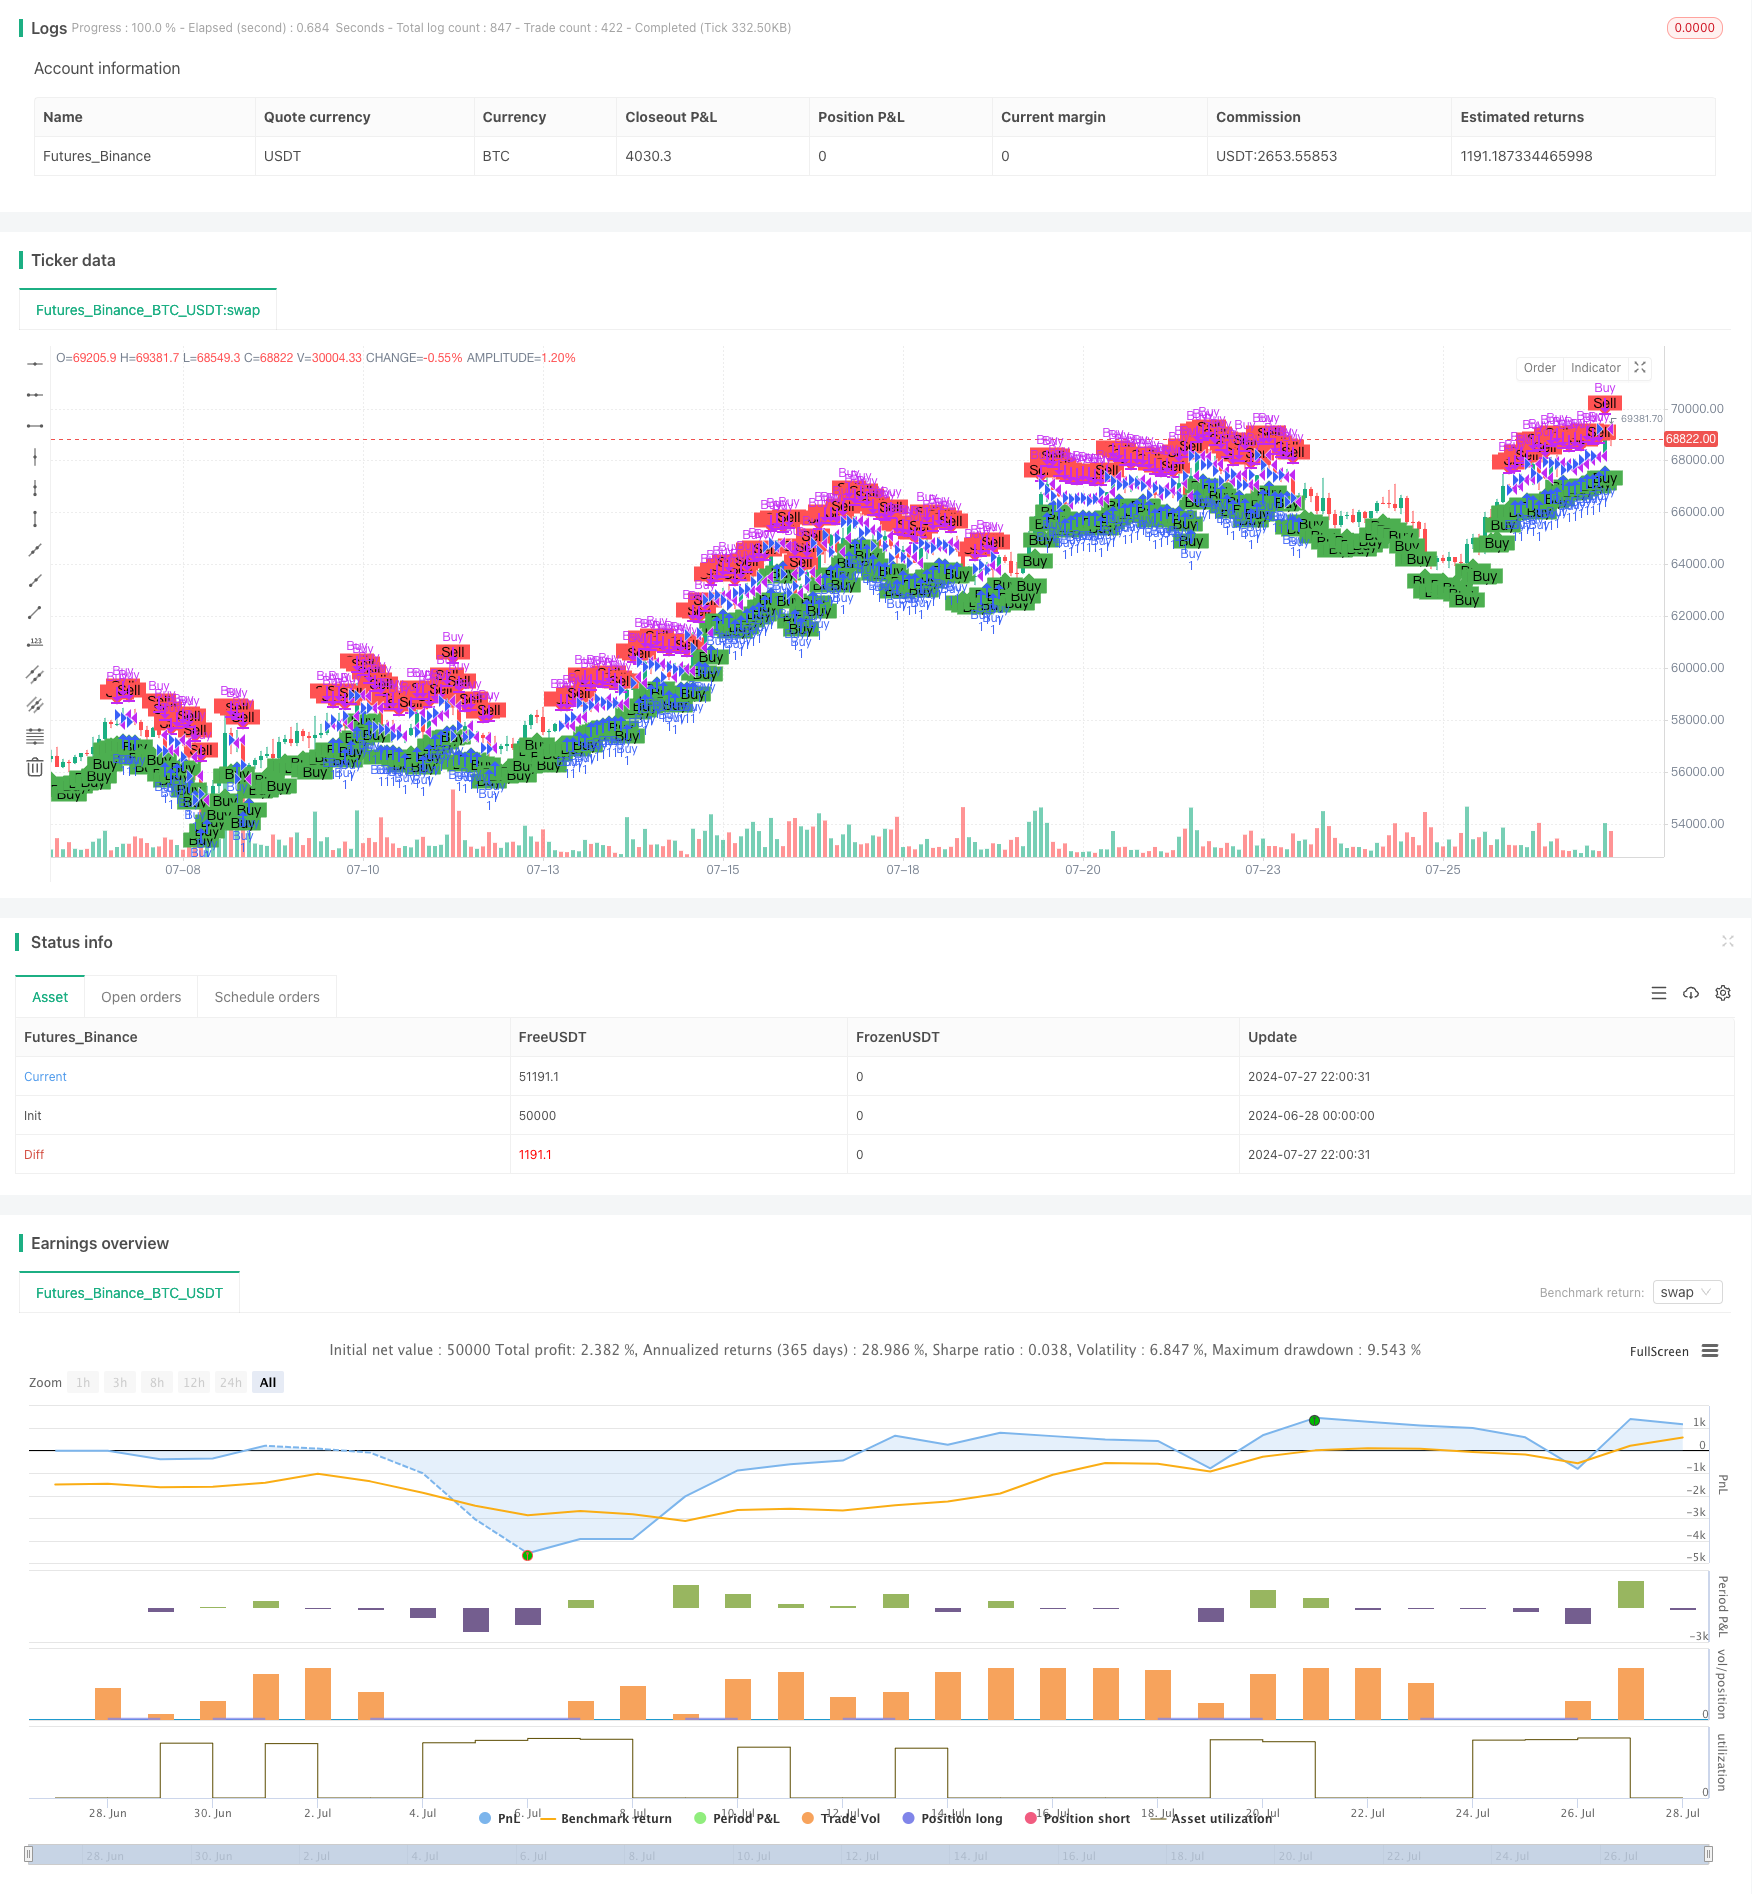
Overview
This strategy is a momentum trading strategy based on highs and lows over three periods. It uses price data from the past three weeks to identify potential buying and selling opportunities. The strategy primarily focuses on the relationship between the most recent high, the latest closing price, and the closing price from three weeks ago, generating trading signals by comparing these price levels. This approach aims to capture medium-term price trends while avoiding the impact of short-term market noise.
Strategy Principle
The core principle of this strategy includes the following key elements:
Calculate indicator:
- Latest high: Use the ta.highest() function to calculate the highest price in the last 30 trading days (about 4 weeks).
- Latest closing price: use close[1] to get the previous day's closing price.
- Closing price three weeks ago: Use close[30] to get the closing price 30 trading days ago.
Buying conditions:
- Condition 1: The latest high point is greater than or equal to the closing price from three weeks ago.
- Condition 2: The latest closing price is higher than the closing price three weeks ago.
Selling conditions:
- Trigger a sell signal when the latest closing price is higher than the closing price three weeks ago.
Transaction Execution:
- When a buy signal is triggered, execute a long entry.
- When the sell signal is triggered, close the position to end the current long position.
Visualization:
- Use the plotshape() function to mark buy and sell signals on the chart.
This design is designed to capture the upward momentum when the price breaks through the levels of three weeks ago, while promptly closing the position to protect profits when the price falls back.
Strategy Advantages
Medium-term trend capture: By comparing the current price with the price level three weeks ago, the strategy can effectively identify the formation and continuation of medium-term trends.
Noise filtering: using a three-period timeframe helps filter out short-term market fluctuations and improve signal reliability.
Dynamic adaptation: the strategy continuously updates judgment criteria based on the latest price data, able to dynamically adapt to market changes.
Risk management: By setting explicit sell conditions, the strategy can close positions in time when the market reverses, effectively controlling risk.
Simple and easy to understand: the strategy logic is intuitive, easy to understand and implement, suitable for novices and experienced traders.
Visualization Support: Clearly mark buy and sell signals on the chart for traders to easily judge and backtest.
Strategy Risks
Risk of false breakthroughs: In sideways markets, frequent false breakthroughs may occur, leading to excessive transactions and unnecessary fee losses.
Hysteresis: Using three-period historical data may lead to signal lag and miss the best entry opportunity in a rapidly changing market.
Single timeframe limitation: relying solely on three-period data may overlook important market information from other timeframes.
Lack of stop-loss mechanism: The current strategy does not have a clear stop-loss mechanism and may face large losses when the market fluctuates violently.
Over-reliance on closing price: the strategy mainly judges based on closing price, which may ignore important intraday price movements.
Lack of volume confirmation: Not considering the volume factor may lead to false signals during periods of low trading volume.
Strategy optimization direction
Multi-time frame analysis: Integrate data from multiple time frames, such as daily, weekly and monthly, to provide a more comprehensive market perspective.
Introducing trading volume indicators: combined with trading volume analysis, the reliability of signals can be improved, especially in terms of breakthrough confirmation.
Dynamic stop-loss mechanism: implements an adaptive stop-loss strategy, such as trailing stop or ATR-based stop, to better manage risk.
Signal Filter: Add additional technical indicators or market sentiment indicators, such as RSI or MACD, to reduce false signals.
Entry Optimization: Consider using limit orders or observation ranges instead of direct market orders to enter the market to achieve better transaction prices.
Position Management: Implement dynamic position management strategies that adjust the size of each trade based on market volatility and account risk.
Market status identification: Add the identification logic of market status (trend, consolidation, high volatility), and use different trading parameters in different market environments.
Backtesting and optimization: perform large-scale historical data backtests, optimize strategy parameters such as time periods, condition thresholds, etc.
Summary
The three-week high and low momentum trading strategy is a simple and effective medium-term trend-following method. By comparing the latest highs, the most recent closing prices, and the closing prices from three weeks ago, the strategy can capture price breakouts and momentum changes. Its advantage lies in its ability to filter out short-term noise, capture medium-term trends, and its simple and easy-to-understand logic. However, the strategy also faces challenges such as false breakouts, delayed signals, and insufficient risk management.
Future optimization directions should focus on multi-time frame analysis, trading volume confirmation, dynamic risk management, and market status identification. Through these improvements, the strategy is expected to perform more robustly in different market environments and provide traders with more reliable decision-making support.
Overall, this strategy provides a good starting point for quantitative trading, and through continued optimization and improvement, has the potential to become a powerful trading tool. However, investors should be cautious in actual application, fully understand market risks, and use this strategy in conjunction with their own risk tolerance and investment objectives.
Overview
This strategy is a momentum trading approach based on three-week high and low points. It utilizes price data from the recent three weeks to identify potential buying and selling opportunities. The strategy primarily focuses on the relationship between the latest high, the latest closing price, and the closing price from three weeks ago, generating trading signals by comparing these price levels. This method aims to capture medium-term price trends while avoiding the impact of short-term market noise.
Strategy Principle
The core principles of this strategy include the following key elements:
Indicator Calculations:
- Latest High: Uses the ta.highest() function to calculate the highest price over the last 30 trading days (approximately 4 weeks).
- Latest Close: Uses close[1] to get the closing price of the previous day.
- Three Weeks Ago Close: Uses close[30] to get the closing price from 30 trading days ago.
Buy Conditions:
- Condition 1: The latest high is greater than or equal to the closing price from three weeks ago.
- Condition 2: The latest closing price is greater than the closing price from three weeks ago.
Sell Condition:
- Triggers a sell signal when the latest closing price is greater than the closing price from three weeks ago.
Trade Execution:
- Enters a long position when the buy signal is triggered.
- Closes the current long position when the sell signal is triggered.
Visualization:
- Uses the plotshape() function to mark buy and sell signals on the chart.
This design aims to capture upward momentum when the price breaks above the level from three weeks ago, while promptly closing positions to protect profits when the price falls back.
Strategy Advantages
Medium-Term Trend Capture: By comparing current prices with levels from three weeks ago, the strategy effectively identifies the formation and continuation of medium-term trends.
Noise Filtering: Using a three-week time frame helps filter out short-term market fluctuations, improving the reliability of signals.
Dynamic Adaptation: The strategy continuously updates its decision criteria based on the latest price data, allowing it to dynamically adapt to market changes.
Risk Management: Through clear sell conditions, the strategy can close positions promptly when the market turns, effectively controlling risk.
Simple and Understandable: The strategy logic is intuitive, easy to understand and implement, suitable for both novice and experienced traders.
Visual Support: Buy and sell signals are clearly marked on the chart, facilitating intuitive judgment and backtesting analysis for traders.
Strategy Risks
False Breakout Risk: In sideways markets, frequent false breakouts may occur, leading to excessive trading and unnecessary transaction fee losses.
Lagging Nature: Using historical data from three weeks may result in lagging signals, potentially missing optimal entry points in rapidly changing markets.
Single Time Frame Limitation: Relying solely on three-week data may overlook important market information from other time frames.
Lack of Stop-Loss Mechanism: The current strategy lacks a clear stop-loss mechanism, potentially facing significant losses during severe market fluctuations.
Over-reliance on Closing Prices: The strategy mainly bases its judgments on closing prices, potentially ignoring important intraday price movements.
Lack of Volume Confirmation: Not considering volume factors may lead to false signals during periods of low trading volume.
Strategy Optimization Directions
Multi-Time Frame Analysis: Integrate data from multiple time frames, such as daily, weekly, and monthly, to provide a more comprehensive market perspective.
Incorporate Volume Indicators: Combining volume analysis can improve signal reliability, especially in breakout confirmation.
Dynamic Stop-Loss Mechanism: Implement adaptive stop-loss strategies, such as trailing stops or ATR-based stops, for better risk management.
Signal Filters: Add additional technical or market sentiment indicators, like RSI or MACD, to reduce false signals.
Entry Optimization: Consider using limit orders or observation zones instead of direct market orders for entry to obtain better execution prices.
Position Management: Implement dynamic position sizing strategies, adjusting the size of each trade based on market volatility and account risk.
Market State Recognition: Add logic to identify market states (trending, ranging, high volatility) and adopt different trading parameters for different market environments.
Backtesting and Optimization: Conduct extensive historical data backtesting to optimize strategy parameters such as time periods and condition thresholds.
Summary
The Three-Week High-Low Momentum Trading Strategy is a simple yet effective method for medium-term trend following. By comparing the latest high, latest close, and the closing price from three weeks ago, the strategy can capture price breakouts and momentum changes. Its strengths lie in filtering short-term noise, capturing medium-term trends, and its simple, easy-to-understand logic. However, the strategy also faces challenges such as false breakouts, signal lag, and insufficient risk management.
Future optimization directions should focus on multi-time frame analysis, volume confirmation, dynamic risk management, and market state recognition. Through these improvements, the strategy has the potential to perform more robustly in different market environments, providing traders with more reliable decision support.
Overall, this strategy provides a good starting point for quantitative trading. With continuous optimization and refinement, it has the potential to become a powerful trading tool. However, investors should be cautious when applying it in practice, fully recognizing market risks and using the strategy in conjunction with their own risk tolerance and investment objectives.
Source Pine Script
/*backtest
start: 2024-06-28 00:00:00
end: 2024-07-28 00:00:00
period: 2h
basePeriod: 15m
exchanges: [{"eid":"Futures_Binance","currency":"BTC_USDT"}]
*/

//@version=5
strategy("Buy and Sell Strategy", overlay=true)

// Calculate the latest high, close, and volume
latestHigh = ta.highest(high, 30) // 4 weeks = 30 trading days
latestClose = close[1]


// Calculate the high, close,
threeWeeksAgoClose = close[30] // 4 weeks = 30 trading days + 1 current day


// Condition 1: Buy if latest high >= 4 weeks ago close
condition1 = latestHigh >= threeWeeksAgoClose

// Condition 2: Buy if latest close > 4 weeks ago close
condition2 = latestClose > threeWeeksAgoClose


// Generate buy and sell signals
buySignal = condition1
sellSignal = condition2

// Entry and exit logic using if statements
if buySignal
    strategy.entry("Buy", strategy.long)

if sellSignal
    strategy.close("Buy")

// Plotting buy and sell signals on the chart
plotshape(buySignal, color=color.green, style=shape.labelup, location=location.belowbar, text="Buy")
plotshape(sellSignal, color=color.red, style=shape.labeldown, location=location.abovebar, text="Sell")
Published by ChaoZhang on the FMZ strategy square · last modified 2024-07-30. Collected in the Quant Trading Vault. Unvalidated research: re-test with your own data and costs before trusting it.
Build this with AgenKit
A spec is not a trading system. Paste this into your coding agent and AgenKit runs a specialist team — architecture, test-first build, risk gates, review — with paper trading on by default.
/agenkit build a production-grade trading bot with a backtest engine, risk controls and paper trading by default from strategies/Three-Week-High-Low-Momentum-Trading-Strategy.md- npx agenkit install engineering-kit in your project
- Paste the command into your agent and approve each phase
- Get tests, backtest, risk controls and a paper-trading switch
Understand it first
Before you run this, read the lesson behind the idea and how to backtest it honestly. Specs like this one are the survivors of an unknown number of trials; deflate their results accordingly.
Related specs
- ADX Momentum Trend StrategyPine Script · Momentum · 10m
- Adaptive Trend Following Strategy Based on Momentum OscillatorPine Script · Momentum · 1d
- Advanced Composite Moving Average and Market Momentum Trend Capture StrategyPine Script · Momentum
- Advanced Multi Indicator Trend Following and Momentum Quantitative Trading StrategyPine Script · Momentum · 1h
- Bollinger Bands Momentum Trend Following Quantitative StrategyPine Script · Momentum · 1d
- Confirmed SMA Crossover Momentum StrategyPine Script · Momentum · 1d