Strategy vault / Trend following
Trend Catcher Strategy
The Trend Catcher Strategy is a strategy that detects trend formations using its own unique method and opens positions in the direction of the trend. It calculates a percentage value called the "limit" by dividing…
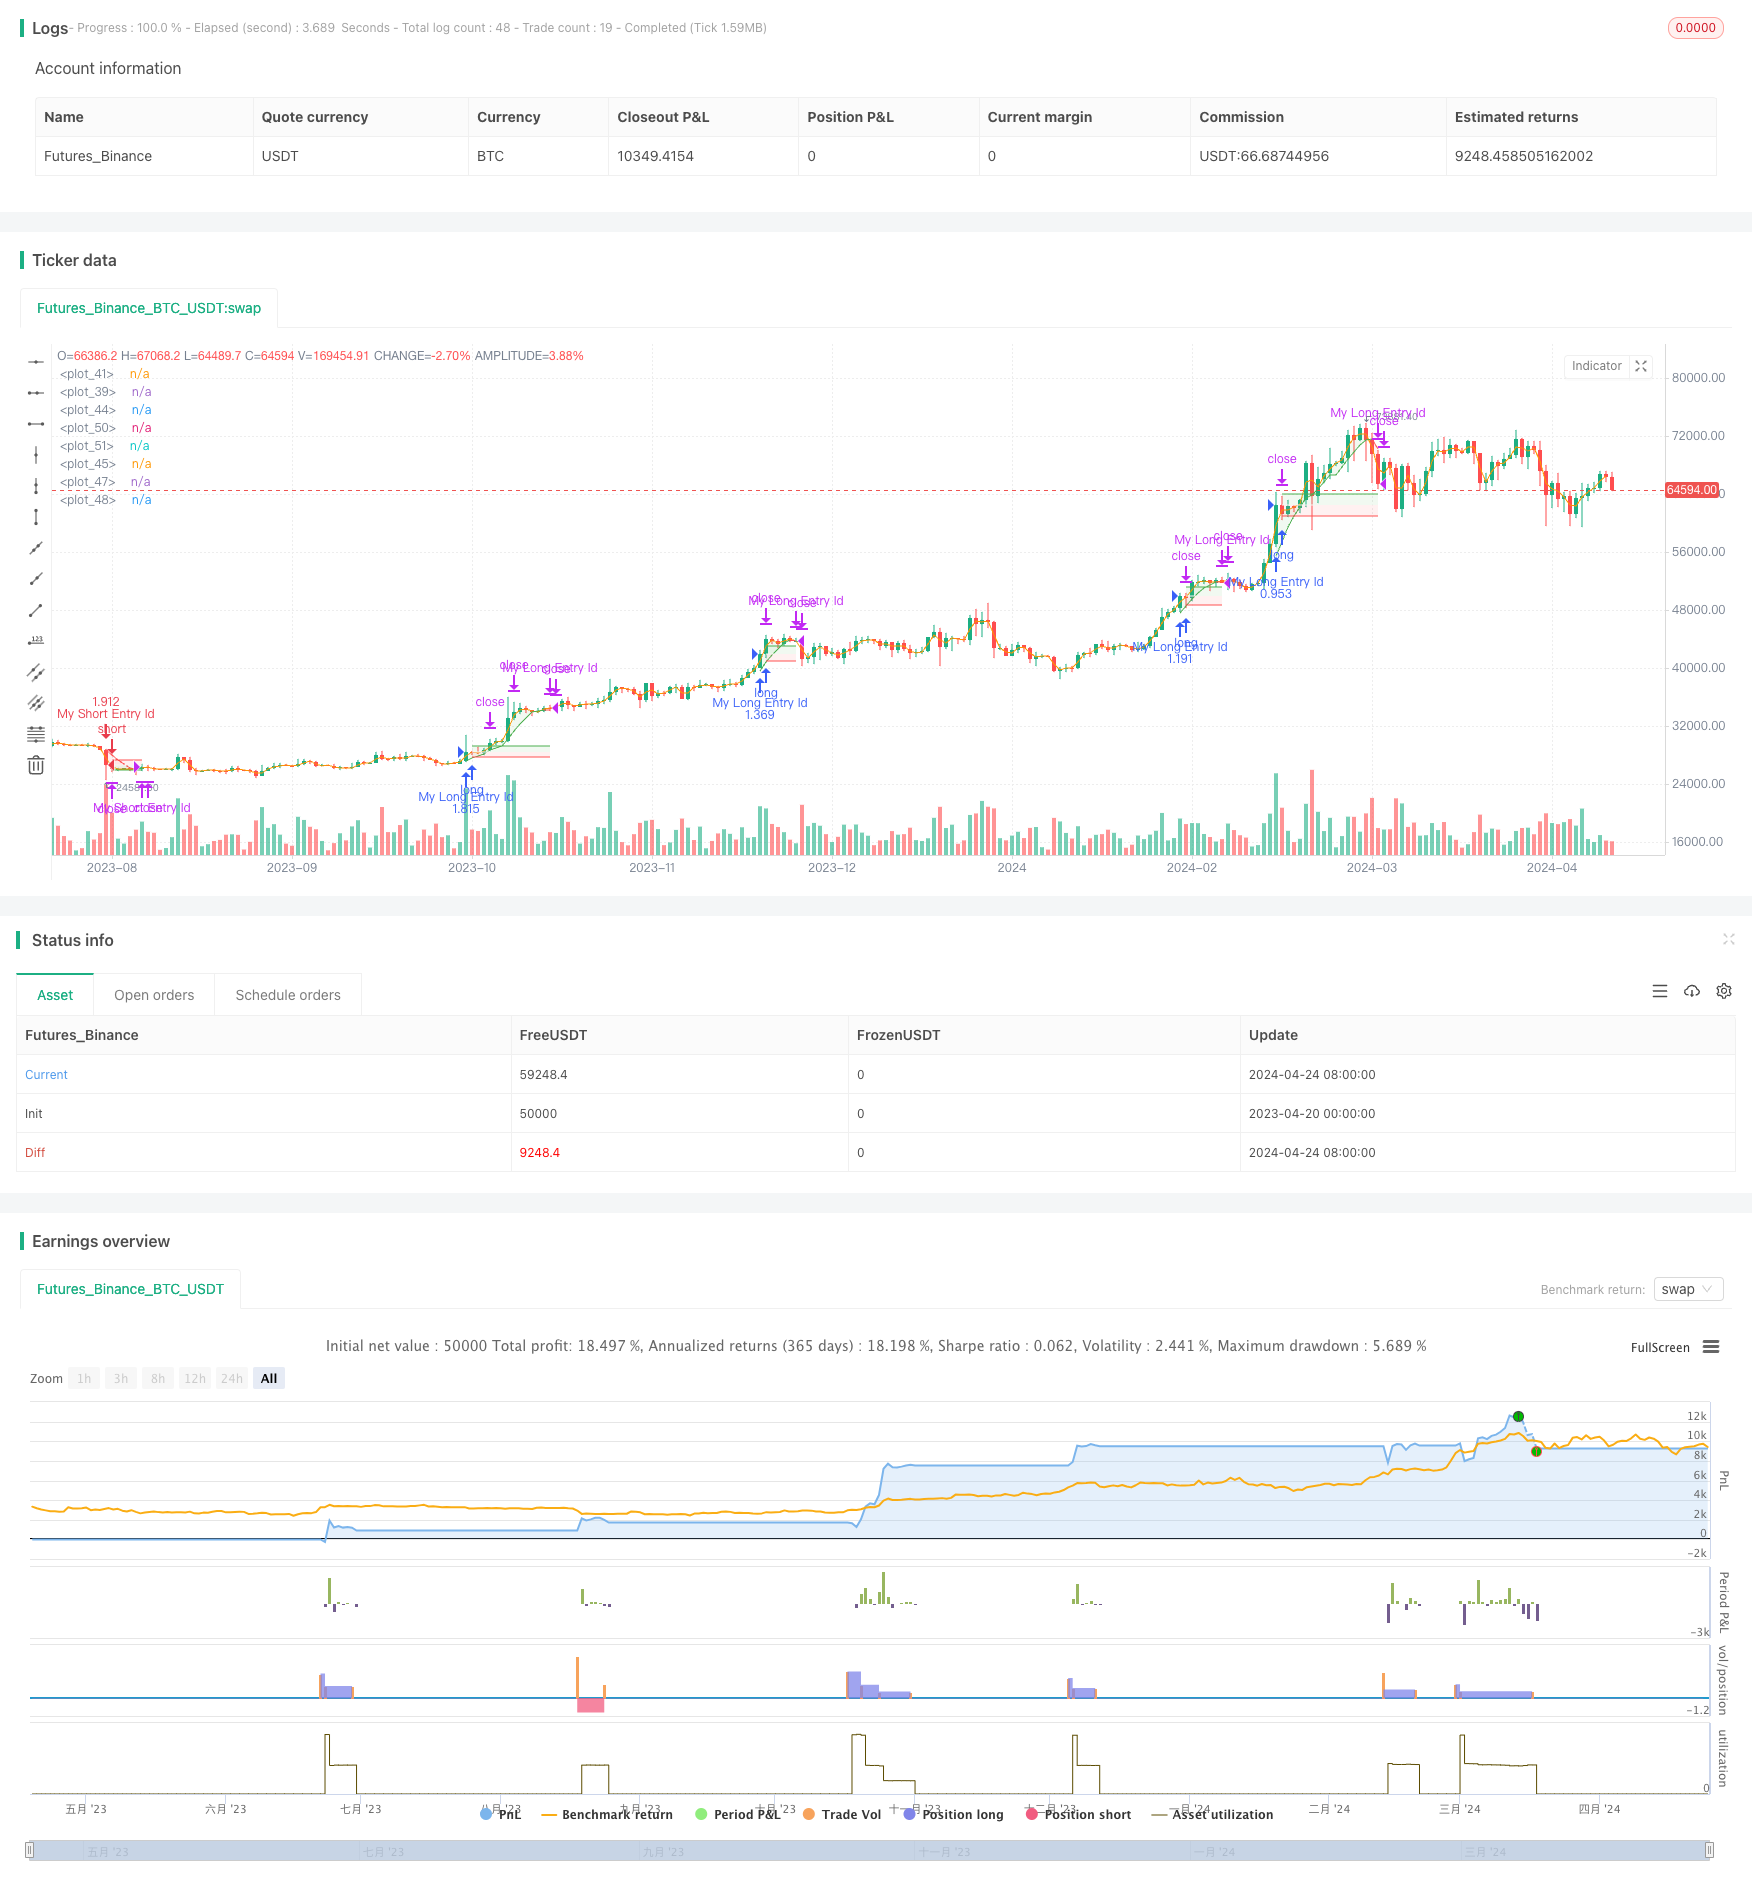
Overview
The Trend Catcher Strategy is a strategy that detects trend formations using its own unique method and opens positions in the direction of the trend. It calculates a percentage value called the "limit" by dividing the difference between the highest and lowest prices in a certain range by the sum of the lengths of the candles in that range. The closer this value is to 100, the stronger the trend. When this value exceeds a set limit and the moving average is rising, the strategy opens a long position; when this value exceeds a set limit and the moving average is falling, the strategy opens a short position. After opening a position, the strategy closes a part of the position when the price reaches a certain level and moves the remaining position to a point where it believes the trend is over.
Strategy Principle
- Calculate the difference between the highest and lowest prices in a certain range, as well as the sum of the lengths of all candles in that range.
- Divide the difference by the sum of the candle lengths and multiply by 100 to get a percentage value called the "limit".
- When the limit exceeds a set value and the moving average is rising, open a long position; when the limit exceeds a set value and the moving average is falling, open a short position.
- After opening a position, close a part of the position when the price reaches the take profit level and move the remaining position to the stop loss level.
- When the moving average crosses downward, close the long position; when the moving average crosses upward, close the short position.
Strategy Advantages
- The strategy uses a unique method to detect trend formations. By calculating the limit value to determine the strength of the trend, it helps to open positions at the beginning of the trend.
- After opening a position, the strategy controls risk by closing a part of the position and moving the stop loss level of the remaining position.
- The strategy uses the upward and downward crossings of the moving average to determine the end of the trend, which helps to close positions in a timely manner.
Strategy Risks
- The strategy opens positions at the beginning of the trend. If the trend cannot be sustained, it may cause losses.
- The strategy uses fixed take profit and stop loss levels, which may not be flexible enough in some cases.
- The strategy only uses the moving average to determine trends, which may miss some trend opportunities.
Strategy Optimization Direction
- Consider using other indicators such as MACD and RSI to assist in determining trends and improve the accuracy of opening positions.
- Dynamically adjust take profit and stop loss levels based on market volatility to better control risk.
- Consider opening positions only after the trend is confirmed to reduce risks at the beginning of the trend.
Summary
The Trend Catcher Strategy uses a unique method to detect trend formations and opens positions in the direction of the trend. It calculates the limit value to determine the strength of the trend and uses the crossing of the moving average to determine the end of the trend. The strategy controls risk by closing a part of the position and moving the stop loss level after opening a position. However, the strategy may face certain risks when opening positions at the beginning of the trend, using fixed take profit and stop loss levels may not be flexible enough, and only using the moving average to determine trends may miss some opportunities. In the future, we can consider introducing other indicators, dynamically adjusting take profit and stop loss levels, and opening positions only after the trend is confirmed to optimize the strategy.
Parameters
| Name | Default | What it controls |
|---|---|---|
| v_input_int_1 | 10 | len |
| v_input_float_1 | 2.5 | tp |
| v_input_float_2 | 2.5 | sl |
| v_input_int_2 | 5 | malen |
| v_input_int_3 | 50 | limit |
| v_input_int_4 | 50 | qty_balance |
Source Pine Script
/*backtest
start: 2023-04-20 00:00:00
end: 2024-04-25 00:00:00
period: 1d
basePeriod: 1h
exchanges: [{"eid":"Futures_Binance","currency":"BTC_USDT"}]
*/

// This source code is subject to the terms of the Mozilla Public License 2.0 at https://mozilla.org/MPL/2.0/
// © faytterro

//@version=5
strategy("Trend Catcher Strategy", overlay=true, default_qty_type = strategy.percent_of_equity, default_qty_value = 100)
len = input.int(10)
tp = input.float(2.5, step = 0.1)
sl = input.float(2.5, step = 0.1)
malen = input.int(5)
limit = input.int(50)
ma = ta.sma(close,malen)
sum = 0.0
for i = 0 to len-1
    sum := sum + high[i]-low[i]
frs = 100*(ta.highest(high,len)-ta.lowest(low,len))/sum
//hline(50)
//plot(frs, color = color.white)
l = ta.crossover(frs,limit) and ma>ma[1]
s = ta.crossover(frs,limit) and ma<ma[1]
cl = ma<ma[1]
cs = ma>ma[1]
qty_balance=input.int(50, maxval = 100)
if (l)
    strategy.entry("My Long Entry Id", strategy.long)
    strategy.exit("exit long", "My Long Entry Id", qty_percent = qty_balance, limit = close*(100+tp)/100, stop = close*(100-sl)/100)

if (s)
    strategy.entry("My Short Entry Id", strategy.short)
    strategy.exit("exit short", "My Short Entry Id", qty_percent = qty_balance, limit = close*(100-tp)/100, stop = close*(100+sl)/100)

if (cl)
    strategy.close("My Long Entry Id")
if (cs)
    strategy.close("My Short Entry Id")

l:= l and strategy.opentrades<1
s:= s and strategy.opentrades<1
transp = strategy.opentrades>0? 0 : 100
pma=plot(ma, color = ma<ma[1]? color.rgb(255, 82, 82, transp) : color.rgb(76, 175, 79, transp))
price = open/2+close/2
pprice = plot(price, display = display.none)
fill(pma,pprice, color = ma<ma[1]? color.rgb(255, 82, 82, transp+90) : color.rgb(76, 175, 79, transp+90))

spm=plot(ta.valuewhen(s,close,0), color = (strategy.opentrades>0 and ma<ma[1] and ma[1]<ma[2])? color.white : color.rgb(1,1,1,100), offset=1)
lpm=plot(ta.valuewhen(l,close,0), color = (strategy.opentrades>0 and ma>ma[1] and ma[1]>ma[2])? color.white : color.rgb(1,1,1,100), offset=1)

ltp=plot(ta.valuewhen(l,close,0)*(100+ta.valuewhen(l,tp,0))/100,  color = (strategy.opentrades>0 and ma>ma[1] and ma[1]>ma[2])? color.green : color.rgb(1,1,1,100), offset=1)
lsl=plot(ta.valuewhen(l,close,0)*(100-ta.valuewhen(l,sl,0))/100,  color = (strategy.opentrades>0 and ma>ma[1] and ma[1]>ma[2])? color.red : color.rgb(1,1,1,100), offset=1)

stp=plot(ta.valuewhen(s,close,0)*(100-ta.valuewhen(s,tp,0))/100, color = (strategy.opentrades>0 and ma<ma[1] and ma[1]<ma[2])? color.green : color.rgb(1,1,1,100), offset=1)
ssl=plot(ta.valuewhen(s,close,0)*(100+ta.valuewhen(s,sl,0))/100, color = (strategy.opentrades>0 and ma<ma[1] and ma[1]<ma[2])? color.red : color.rgb(1,1,1,100), offset=1)
fill(stp,spm, color = (strategy.opentrades>0 and ma<ma[1] and ma[1]<ma[2])? color.rgb(76, 175, 79, 90) : color.rgb(1,1,1,100))
fill(ssl,spm, color = (strategy.opentrades>0 and ma<ma[1] and ma[1]<ma[2])? color.rgb(255, 82, 82, 90) : color.rgb(1,1,1,100))
fill(ltp,lpm, color = (strategy.opentrades>0 and ma>ma[1] and ma[1]>ma[2])? color.rgb(76, 175, 79, 90) : color.rgb(1,1,1,100))
fill(lsl,lpm, color = (strategy.opentrades>0 and ma>ma[1] and ma[1]>ma[2])? color.rgb(255, 82, 82, 90) : color.rgb(1,1,1,100))Published by ChaoZhang on the FMZ strategy square · last modified 2024-04-26. Collected in the Quant Trading Vault. Unvalidated research: re-test with your own data and costs before trusting it.
Build this with AgenKit
A spec is not a trading system. Paste this into your coding agent and AgenKit runs a specialist team — architecture, test-first build, risk gates, review — with paper trading on by default.
/agenkit build a production-grade trading bot with a backtest engine, risk controls and paper trading by default from strategies/Trend-Catcher-Strategy.md- npx agenkit install engineering-kit in your project
- Paste the command into your agent and approve each phase
- Get tests, backtest, risk controls and a paper-trading switch
Understand it first
Before you run this, read the lesson behind the idea and how to backtest it honestly. Specs like this one are the survivors of an unknown number of trials; deflate their results accordingly.
Related specs
- Bollinger Bands and RSI Trend Following StrategyPine Script · Trend following · 1h
- Dual ATR Channel Trend Following StrategyPine Script · Trend following · 15m
- Dual SMA Crossover StrategyPine Script · Trend following · 5m
- Dynamic Dual EMA Crossover Strategy with Adaptive Profit Loss ControlPine Script · Trend following · 1d
- EMA SMA Multi Indicator Comprehensive Trend Following StrategyPine Script · Trend following · 1h
- EMA and RSI Trend Trading StrategyPine Script · Trend following · 1d