Trend Following Strategy Based on Moving Average Breakout
The core idea of this strategy is to follow the trend by detecting breakouts of moving averages across higher timeframes. When the price breaks out above or breaks down below the moving average on a higher timeframe…
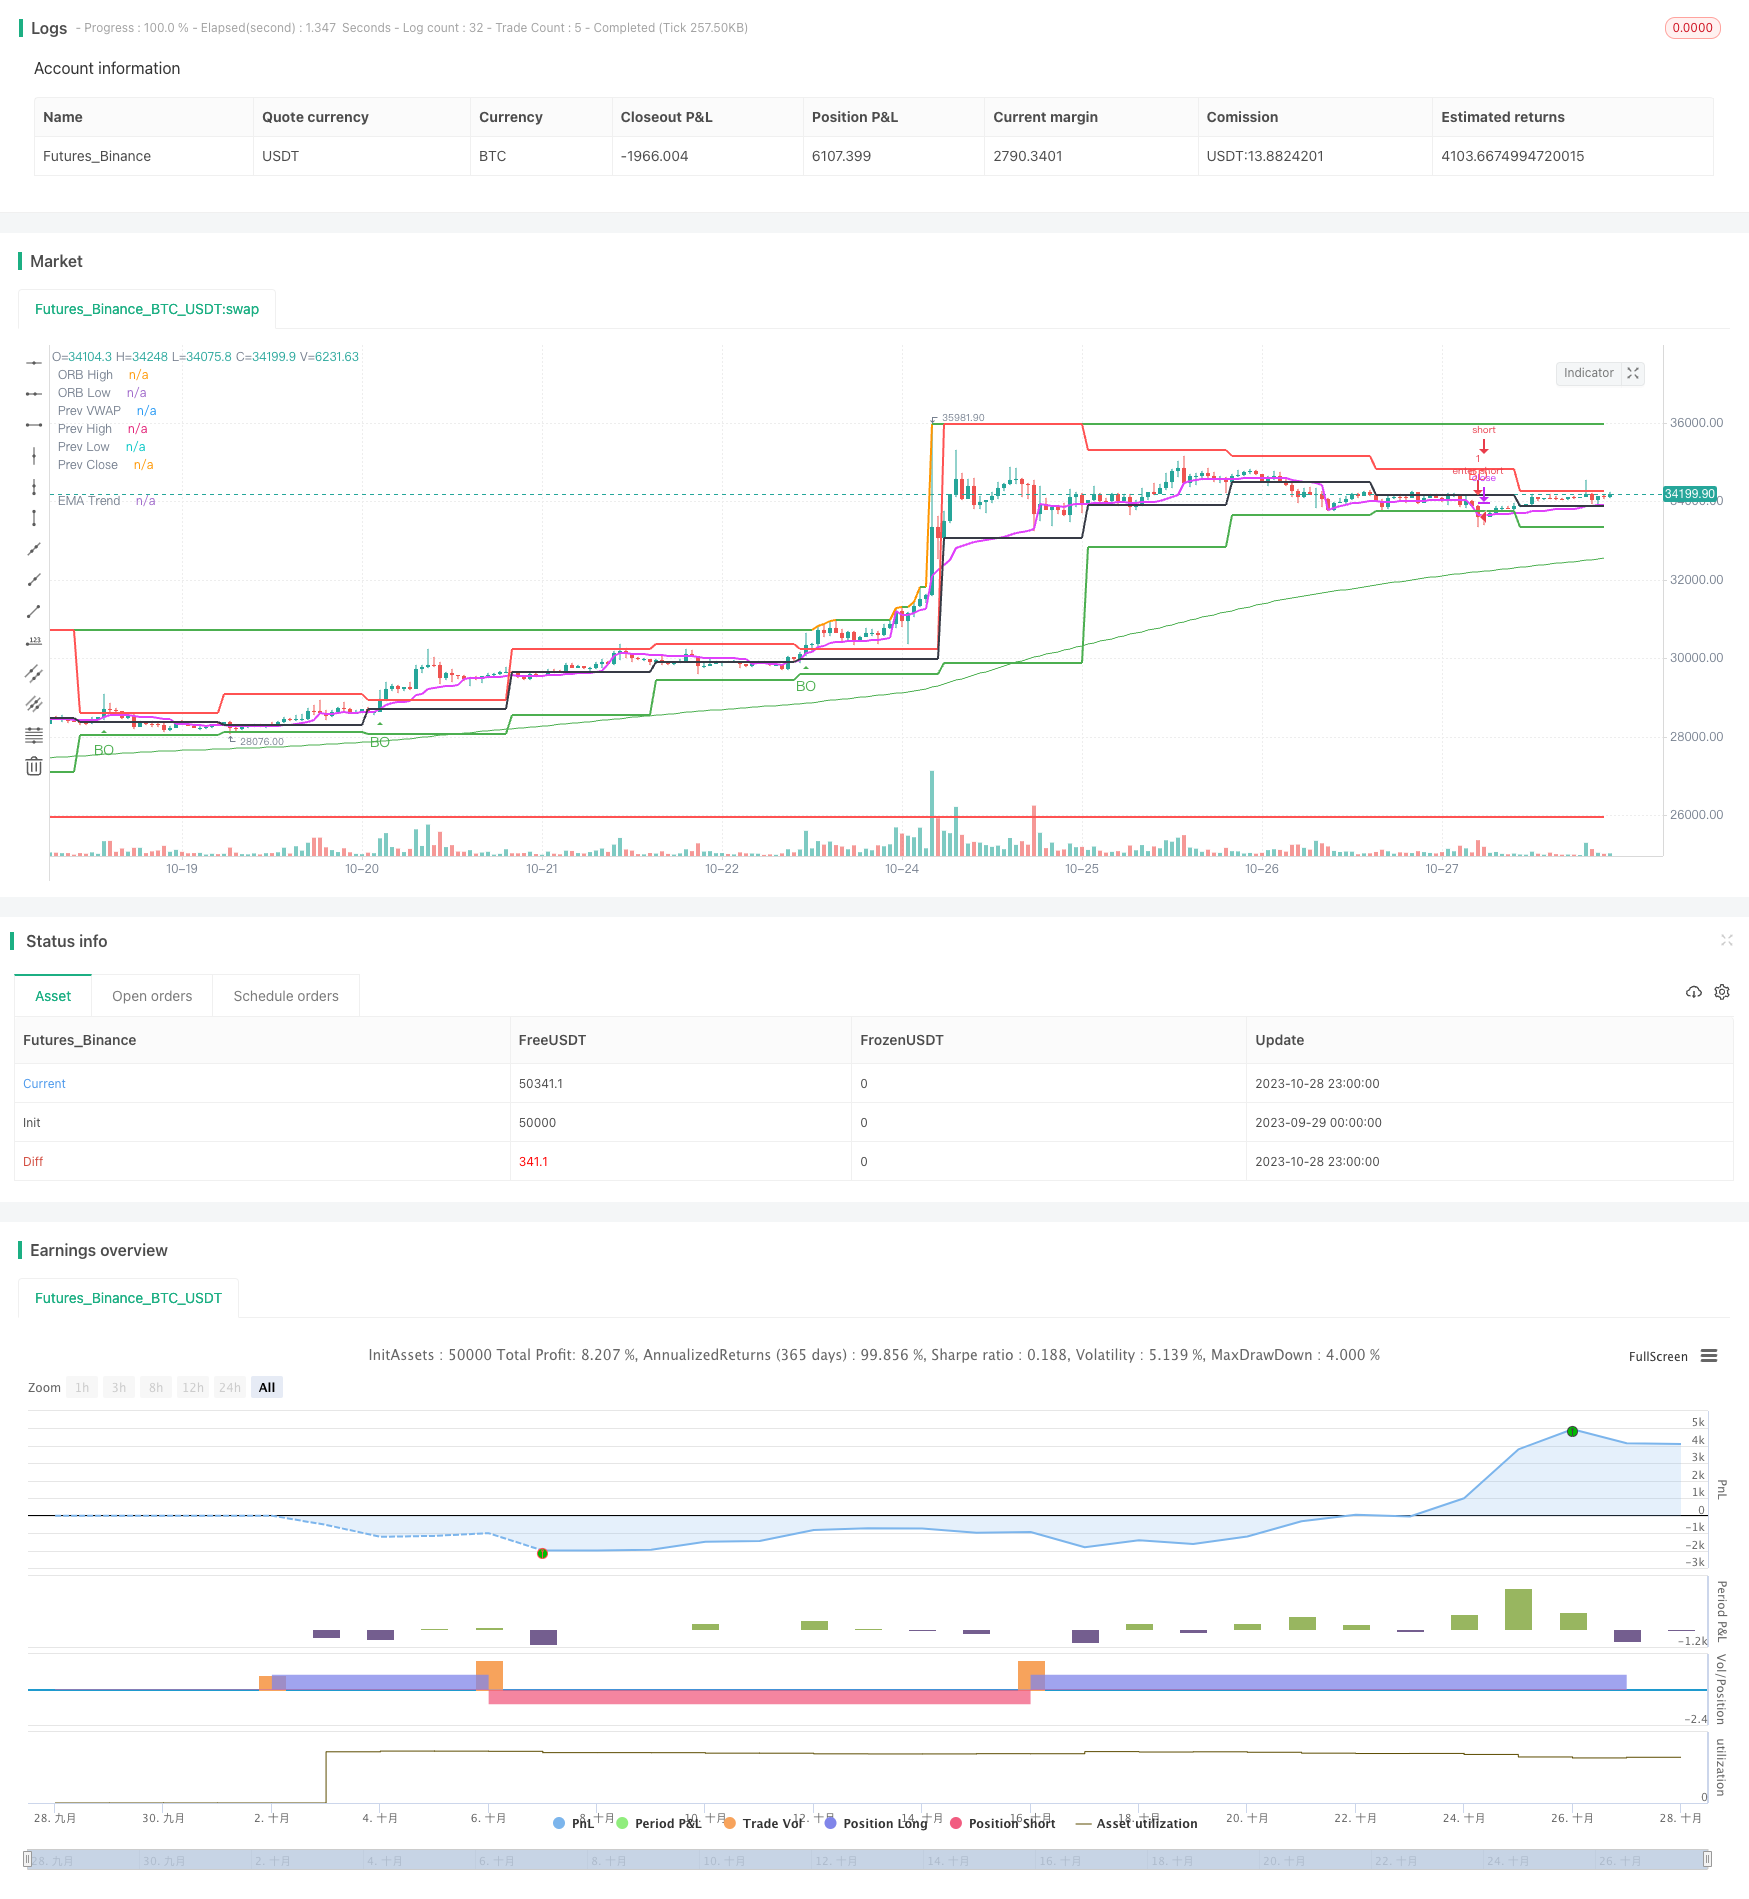
Overview
The core idea of this strategy is to follow the trend by detecting breakouts of moving averages across higher timeframes. When the price breaks out above or breaks down below the moving average on a higher timeframe, it signals the potential start of a new trend, allowing traders to take positions accordingly.
Strategy Logic
The strategy is developed in Pine Script and consists of the following main components:
Inputs
Defines input parameters period as the moving average period, default to 200; and timeframe as the bar timeframe, default to D (daily bars).
Moving Average
Calculates exponential moving average (EMA) using ta.ema function.
Breakout Detection
Identifies breakouts and breakdowns using ta.crossover and ta.crossunder functions.
Signal Plotting
Plots up and down arrows on bars when breakouts occur.
Trade Entries and Exits
Enters trade on breakout signals and exits when price reaches 2x stop loss distance.
The strategy mainly leverages the trend-following capacity of moving averages across higher timeframes. It implements simple breakout logic for trend trading, making it a conventional breakout strategy.
Advantage Analysis
The main advantages of this strategy include:
Simple logic, easy to understand and master.
Depends on only one indicator, with minimal parameter tuning.
Breakout signals tend to align with trend, avoiding excessive trading.
Higher timeframes clearly depict major trends without noise.
Flexible timeframe combinations cater to different products.
Easily scalable across products, avoiding simultaneous drawdowns.
Risk Analysis
The potential risks are:
Breakout signals may turn out to be false signals, unable to filter market noise effectively.
Unable to capitalize on short-term opportunities.
Massive losses if major trend direction is wrong.
Timeframe mismatch between moving average and trading timeframe may lead to over-trading or missed profit.
Lack of real-time stop loss may result in magnified losses.
Possible solutions include combining with trend-following indicators, adding filters, shortening holding period, implementing dynamic stop loss etc.
Enhancement Opportunities
The strategy can be improved in the following aspects:
Add trend-following indicators like MACD, KD to increase breakout reliability.
Add filters based on volume or Bollinger Bands to avoid false breakouts.
Optimize parameter tuning to match holding period with trend cycle.
Incorporate real-time stop loss to control single trade loss.
Explore machine learning techniques for dynamic parameter optimization.
Test various asset allocation combinations to enhance overall stability.
Conclusion
In summary, this is a simple and practical strategy for trend-following via moving average breakouts. It is easy to understand and implement, serving as a good introductory strategy for algo trading. But it also has some flaws that need to be addressed through combinations of indicators, parameter tuning, dynamic stop loss etc. Much room remains for enhancements and extensions.
Parameters
| Name | Default | What it controls |
|---|---|---|
| v_input_int_1 | 15 | TimeRange |
| v_input_bool_5 | false | Hide the PDHCL (prev day High Close Low range) |
| v_input_bool_6 | false | Hide the Summary Table |
| v_input_1 | 0915-0930 | (?ORB settings)Time Range |
| v_input_bool_1 | false | (?ORB setting)Hide ORB Range |
| v_input_int_2 | 14 | (?StopLoss settings)ATR Period for placing SL |
| v_input_bool_2 | false | Show SL lines in chart |
| v_input_bool_3 | false | (?Strengh Settings)Ignore Momentum & Volume |
| v_input_int_3 | 14 | Momentum Period |
| v_input_int_4 | 50 | Bullish Momentum |
| v_input_int_5 | 50 | Bearish Momentum |
| v_input_int_6 | 20 | Volume Average Period |
| v_input_float_1 | true | Volume Strengh |
| v_input_int_7 | 200 | (?Trend Settings)Trend Period |
| v_input_bool_4 | false | Hide the trend line |
| v_input_float_2 | 2 | (?Trade settings)Risk:Reward |
| v_input_int_8 | 1500 | Close all trades, default is 3:00 PM, 1500 hours (integer) |
| v_input_bool_7 | true | Markets that never closed (Crypto, Forex, Commodity) |
| v_input_int_9 | true | Lot Size |
Source Pine Script
/*backtest
start: 2023-09-29 00:00:00
end: 2023-10-29 00:00:00
period: 1h
basePeriod: 15m
exchanges: [{"eid":"Futures_Binance","currency":"BTC_USDT"}]
*/

// @version=5
// Open-Range-Breakout strategy
// No license. Free and Open Source.

strategy('Strategy: ORB', shorttitle="ORB", overlay=true , currency=currency.NONE, initial_capital=100000)

// Inputs
period = input.int(defval=15, title="TimeRange", tooltip="The range in minutes (default: 15m)")
sessionInput = input(defval="0915-0930", title="Time Range", group="ORB settings", tooltip='What is the timeperiod (default 9:15AM to 9:30AM, exchange timezone')
hide = input.bool(defval = false, title="Hide ORB Range", group="ORB setting", tooltip = 'Hide the ORB range drawing')

// SL Related
slAtrLen = input.int(defval=14, title="ATR Period for placing SL", group="StopLoss settings")
showSLLines = input.bool(defval=false, title="Show SL lines in chart", tooltip="Show SL lines also as dotted lines in chart. Note: chart may look untidy.", group="StopLoss settings")

// Further Filtering
ignoreMementumVolume = input.bool(defval=false, title="Ignore Momentum & Volume", tooltip="Ignore Momentum & Volume to find out trades", group="Strengh Settings")
rsiLen = input.int(defval=14, title="Momentum Period", group="Strengh Settings", tooltip = 'To determine the momentum, RSI period is set default to 100')
rsiBullish = input.int(defval=50, step=1, title="Bullish Momentum", group="Strengh Settings", tooltip = 'Bullish Momentum, default set to RSI as 50')
rsiBearish = input.int(defval=50, step=1, title="Bearish Momentum", group="Strengh Settings", tooltip = 'Bearish Momentum, default set to RSI as 50')
volAvg = input.int(defval=20, step=1, title="Volume Average Period", group="Strengh Settings", tooltip = 'To calculate average volume, how many historical bars are considered. Default: 20.')
volThreshold = input.float(defval=1, step=0.1, title="Volume Strengh", group="Strengh Settings", tooltip = 'Multiplier: How big the current bar volume compared to average of last 20')

trendPeriod = input.int(defval=200, step=1, title="Trend Period", group="Trend Settings", tooltip = 'To calculate trend, what period is considered. Default: 200.')
hideTrend = input.bool(defval = false, title="Hide the trend line", group="Trend Settings", tooltip = 'Hide the trend')

hidePDHCL = input.bool(defval = false, title="Hide the PDHCL (prev day High Close Low range)", tooltip = 'Hide the Previous Day High, Close, Low lines')

hideTable = input.bool(defval = false, title="Hide the Summary Table", tooltip = 'Hide the summary table.')

// Trade related
rrRatio = input.float(title='Risk:Reward', step=0.1, defval=2.0, group="Trade settings")
endOfDay = input.int(defval=1500, title="Close all trades, default is 3:00 PM, 1500 hours (integer)", group="Trade settings")
mktAlwaysOn = input.bool(defval=true, title="Markets that never closed (Crypto, Forex, Commodity)", tooltip="Some markers never closes. For those cases, make this checked.", group="Trade settings")
lotSize = input.int(title='Lot Size', step=1, defval=1, group="Trade settings")

// Util method

is_newbar(res) =>
	timeframe.change(time(res)) != 0

// print table
printTable(txt) =>
    var table t = table.new(position.bottom_right, 1, 1)
    table.cell(t, 0, 0, txt, text_halign = text.align_left, bgcolor = color.lime)

// globals
t = time(timeframe.period, sessionInput + ":1234567") // everyday
in_session = not na(t)
is_first = in_session and not in_session[1]
is_end_session = in_session[1] and not in_session
green(open, close) => close > open ? true : false
red(open, close) => close < open ? true : false

var float orb_high = na
var float orb_low = na
if is_first
    orb_high := high
    orb_low := low
else
    orb_high := orb_high[1]
    orb_low := orb_low[1]
if high > orb_high and in_session
    orb_high := high
if low < orb_low and in_session
    orb_low := low

plot(hide ? na : orb_high, style=plot.style_line, color=orb_high[1] != orb_high ? na : color.green, title="ORB High", linewidth=2)
plot(hide ? na : orb_low, style=plot.style_line, color=orb_low[1] != orb_low ? na : color.red, title="ORB Low", linewidth=2)


// PDHCL (Previous Day High Close Low)
[dh,dl,dc] = request.security(syminfo.ticker, "D", [high[1],low[1], close[1]], lookahead=barmerge.lookahead_on)
plot(hidePDHCL ? na : dh, title="Prev High",  color=color.red,  linewidth=2, trackprice=true, show_last = 1)
plot(hidePDHCL ? na : dl, title="Prev Low",  color=color.green,  linewidth=2, trackprice=true, show_last = 1)
plot(hidePDHCL ? na : dc, title="Prev Close",  color=color.black,  linewidth=2, trackprice=true, show_last = 1)
plot(hidePDHCL ? na : ta.vwap(close), title="Prev VWAP",  color=color.fuchsia,  linewidth=2, trackprice=true, show_last = 1)

var l1 = label.new(bar_index, hidePDHCL ? na : dh, 'PDH', style=label.style_label_right)

// Previous Day WWAP


// For SL calculation
atr = ta.atr(slAtrLen)
highestHigh = ta.highest(high, 7)
lowestLow = ta.lowest(low, 7)
longStop = showSLLines ? lowestLow - (atr * 1) : na
shortStop = showSLLines ? highestHigh + (atr * 1) : na
plot(longStop, title="Buy SL", color=color.green, style=plot.style_cross)
plot(shortStop, title="Sell SL", color=color.red, style=plot.style_cross)

// Momentum: rsi
rsi = ta.rsi(close, rsiLen)

// trend: EMA200
ema = ta.ema(close, trendPeriod)
plot(hideTrend ? na : ema, "EMA Trend", color=close > ema ? color.green : color.red, linewidth = 1)

// Volume-Weighed Moving Average calculation
vwmaAvg = ta.vwma(close, volAvg)
vwma_latest = volume
// plotshape((barstate.isconfirmed and (vwma_latest > (vwmaAvg * volThreshold))), title='VolumeData', text='', location=location.abovebar, style=shape.diamond, color=color.gray, textcolor=color.gray, size=size.tiny)

// Trade signals

longCond = barstate.isconfirmed and (ta.crossover(close, orb_high) or ta.crossover(close, dh)) and green(open, close) and (ignoreMementumVolume ? true : rsi > rsiBullish and (vwma_latest > (vwmaAvg * volThreshold)))
shortCond = barstate.isconfirmed and (ta.crossunder(close, orb_low) or ta.crossunder(close, dl)) and red(open, close) and (ignoreMementumVolume ? true : rsi < rsiBearish and (vwma_latest > (vwmaAvg * volThreshold)))

plotshape(longCond, title='Breakout', text='BO', location=location.belowbar, style=shape.triangleup, color=color.green, textcolor=color.green)
plotshape(shortCond, title='Breakout', text='BD', location=location.abovebar, style=shape.triangledown, color=color.red, textcolor=color.red)


// Trade execute
h = hour(time('1'), syminfo.timezone)
m = minute(time('1'), syminfo.timezone)
hourVal = h * 100 + m
totalTrades = strategy.opentrades + strategy.closedtrades
if (mktAlwaysOn or (hourVal < endOfDay))
    // Entry
    var float sl = na
    var float target = na
    if (longCond)
        strategy.entry("enter long", strategy.long, lotSize, limit=na, stop=na, comment="Enter Long")
        sl := longStop
        target := close + ((close - longStop) * rrRatio)
        alert('Buy:' + syminfo.ticker + ' ,SL:' + str.tostring(math.floor(sl)) + ', Target:' + str.tostring(target), alert.freq_once_per_bar)
    if (shortCond)
        strategy.entry("enter short", strategy.short, lotSize, limit=na, stop=na, comment="Enter Short")
        sl := shortStop
        target := close - ((shortStop - close) * rrRatio)
        alert('Sell:' + syminfo.ticker + ' ,SL:' + str.tostring(math.floor(sl)) + ', Target:' + str.tostring(target), alert.freq_once_per_bar)

    // Exit: target or SL
    if ((close >= target) or (close <= sl))
        strategy.close("enter long", comment=close < sl ? "Long SL hit" : "Long target hit")
    if ((close <= target) or (close >= sl))
        strategy.close("enter short", comment=close > sl ? "Short SL hit" : "Short target hit")
else if (not mktAlwaysOn)
    // Close all open position at the end if Day
    strategy.close_all(comment = "Close all entries at end of day.")


// Plotting table
if (not hideTable and is_end_session)
    message =  syminfo.ticker + " :\n\nORB Upper: " + str.tostring(math.round(orb_high)) + "\nORB Lower: " + str.tostring(math.round(orb_low)) + "\nPDH: " + str.tostring(math.round(dh)) + "\nPDC: " + str.tostring(math.round(dc)) + "\nPDL: " + str.tostring(math.round(dl)) + "\nVWAP: " + str.tostring(math.round(ta.vwap(close)))
    printTable(message)
    alert(message, alert.freq_once_per_bar_close)
Published by ChaoZhang on the FMZ strategy square · last modified 2023-10-30. Collected in the Quant Trading Vault. Unvalidated research: re-test with your own data and costs before trusting it.
Build this with AgenKit
A spec is not a trading system. Paste this into your coding agent and AgenKit runs a specialist team — architecture, test-first build, risk gates, review — with paper trading on by default.
/agenkit build a production-grade trading bot with a backtest engine, risk controls and paper trading by default from strategies/Trend-Following-Strategy-Based-on-Moving-Average-Breakout.md- npx agenkit install engineering-kit in your project
- Paste the command into your agent and approve each phase
- Get tests, backtest, risk controls and a paper-trading switch
Understand it first
Before you run this, read the lesson behind the idea and how to backtest it honestly. Specs like this one are the survivors of an unknown number of trials; deflate their results accordingly.
Related specs
- Cross Timeframe SuperTrend Breakout StrategyPine Script · Breakout · 1h
- Momentum Breakout Moving Average StrategyPine Script · Breakout · 1d
- Momentum Breakout Trading Strategy 440964Pine Script · Breakout · 5m
- Moving Average Crossover and Upper Rail Breakthrough Impulse StrategyPine Script · Breakout · 1m
- MACD RSI Short Term Breakout StrategyPine Script · Breakout · 1h
- Volatility Squeeze Breakout StrategyPine Script · Breakout · 1h