Strategy vault / Trend following
Trending Darvas Box Quantitative Trading Strategy
The Trending Darvas Box strategy is a short-term trading strategy that uses Darvas box channel to capture market trends. The core mechanism relies on the Darvas Box indicator to determine market momentum and locate…
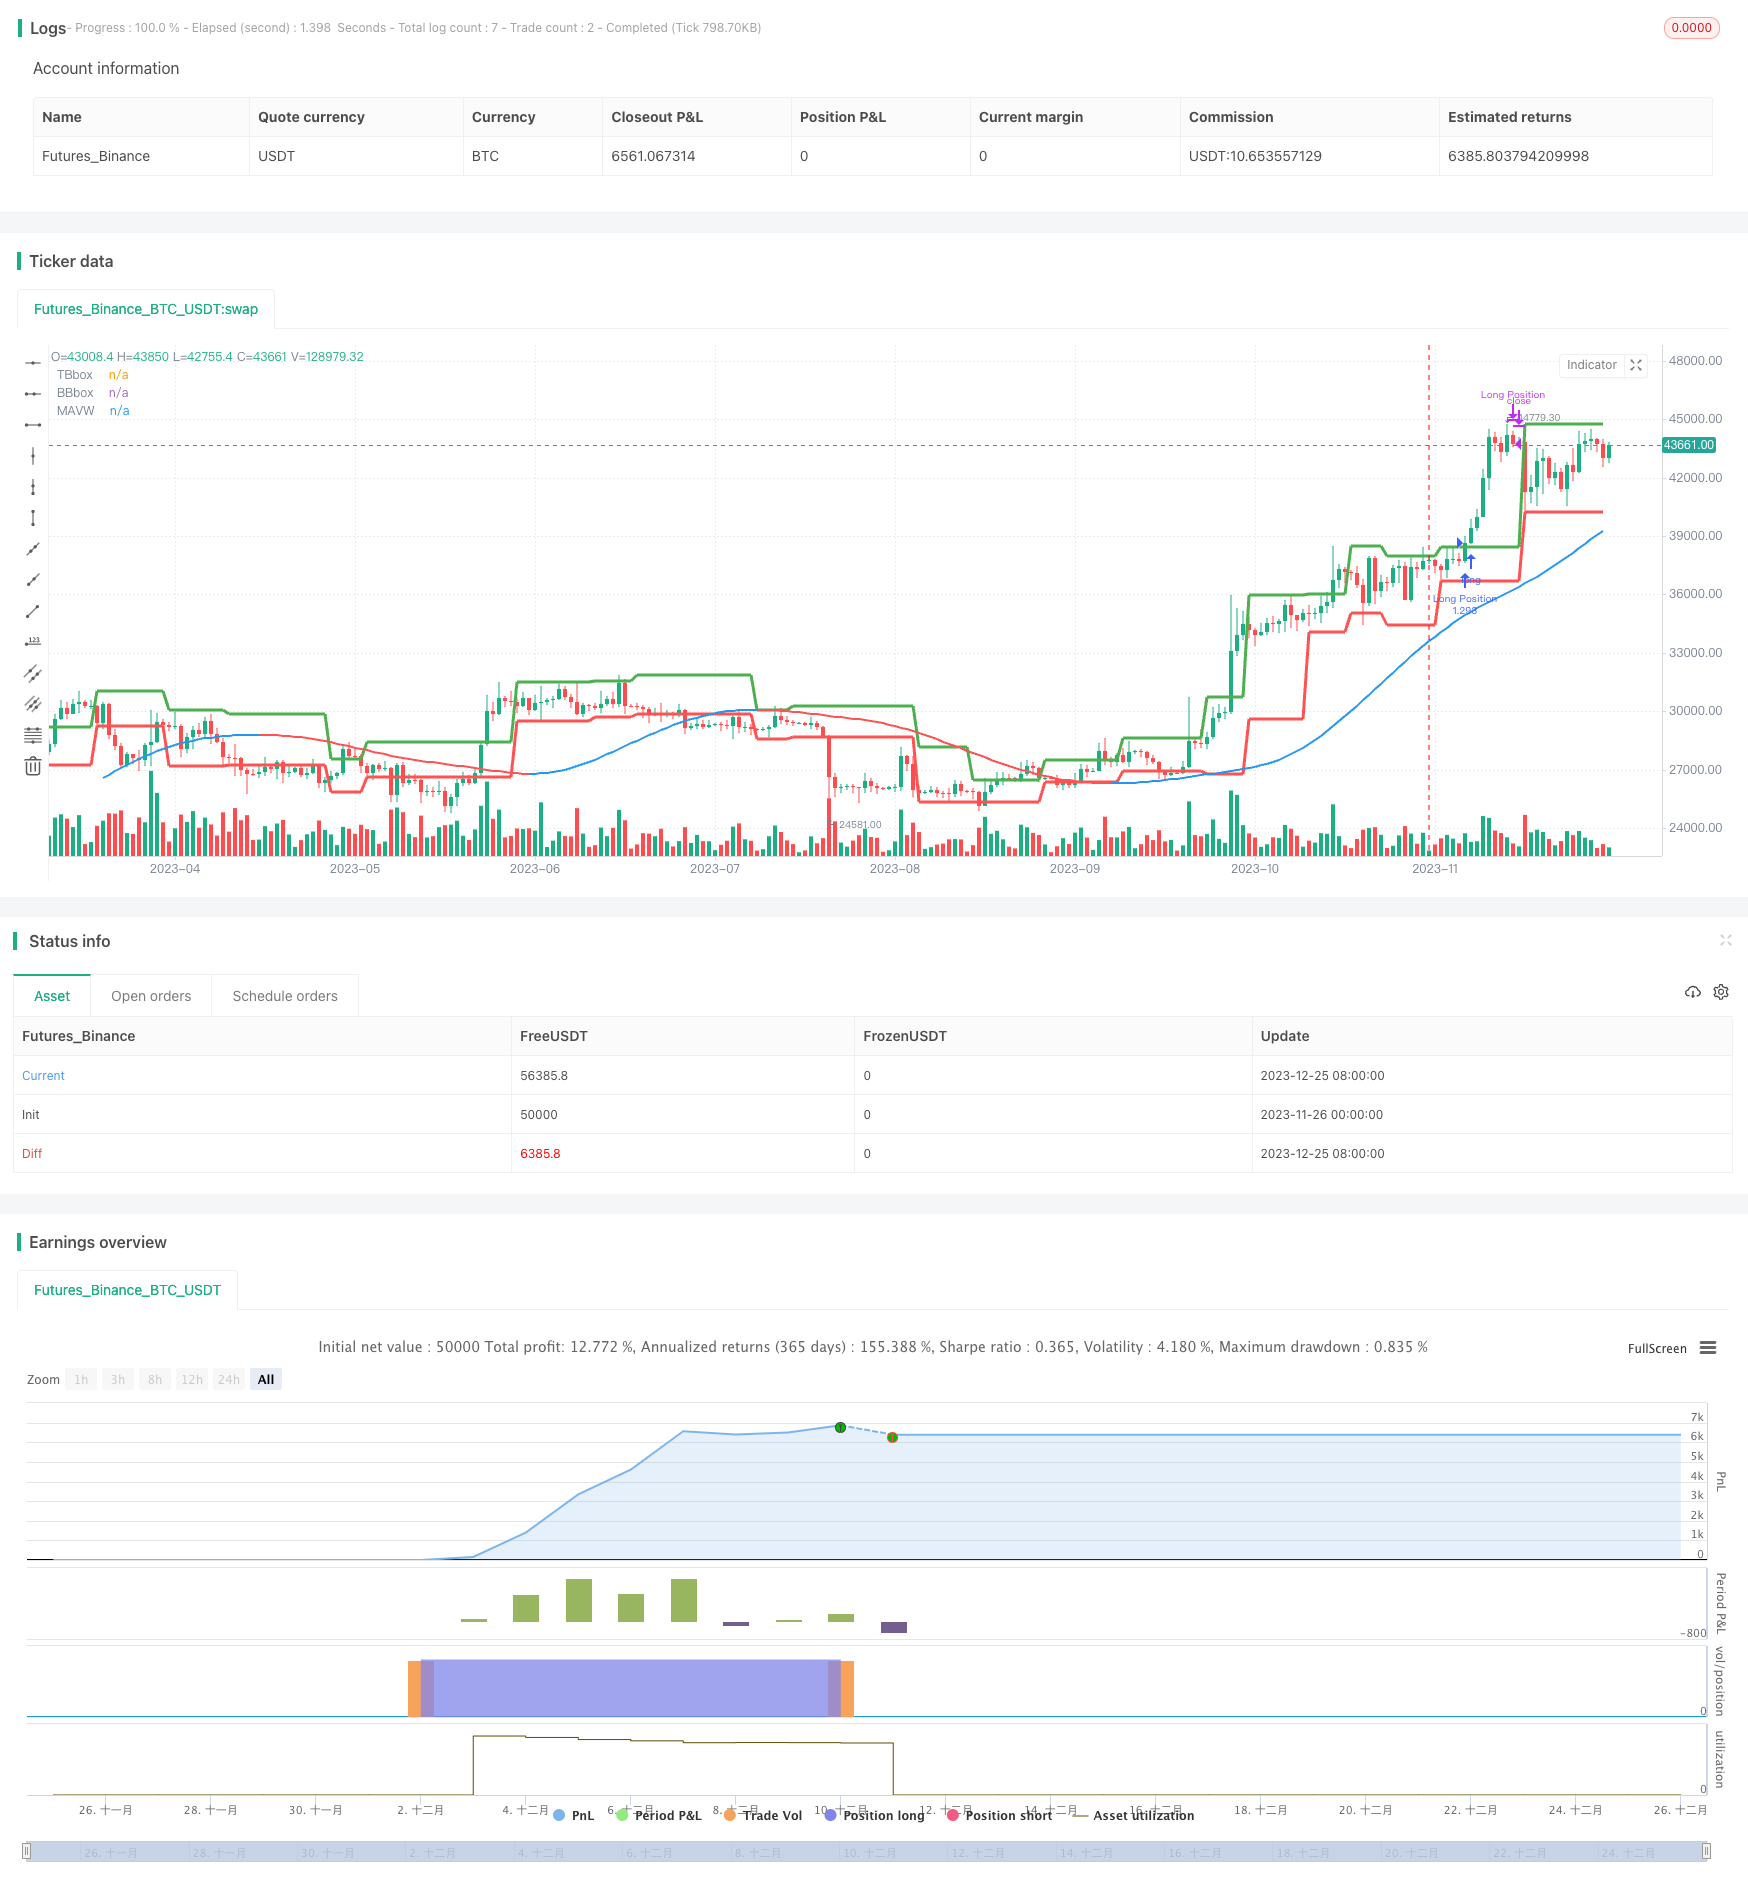
Overview
The Trending Darvas Box strategy is a short-term trading strategy that uses Darvas box channel to capture market trends. The core mechanism relies on the Darvas Box indicator to determine market momentum and locate trading opportunities. It goes long when price breaks above box top, and goes short when price breaks below box bottom. In addition, this strategy also utilizes other auxiliary indicators to enhance stability.
Strategy Logic
- Use length parameter to set the size of the Darvas box, which is 5 bars by default in this strategy.
- Determine trend direction based on high/low breakouts, and take corresponding long/short positions.
- When price breaks above box top, a green TopBox line is plotted. This is the long signal.
- When price breaks below box bottom, a red BottomBox line is plotted. This is the short signal.
- Use Moving Average system as auxiliary indicator. Go long when price is above MAs, and go short when below MAs.
- Use RVI to identify overbought/oversold zone. RVI above Signal line suggests overbought; RVI below suggests oversold.
Entries are taken when all above indicators give consent. The stop loss is set at the opposite band of the Darvas box. Exits are managed with RVI directionality.
Advantage Analysis
- Darvas box channel effectively captures market trend. Reduces missed opportunities.
- Frequent box breakout signals. Good frequency of entries.
- Reasonable box stops loss setting. Well controls single trade risk.
- Auxiliary indicators enhance accuracy.
Risk Analysis
- Wide stop loss range of the box. Larger risk per trade.
- Long trades may be stopped out during minor pullbacks.
- Box directionality not always correct. Potential bad signals.
- Fine tuning needed for auxiliary indicators to align with box.
Can tighten stop loss to reduce risk. Auxiliary parameters also need optimization to screen signals effectively.
Optimization Directions
- Test box lengths to find optimum size.
- Optimize auxiliary parameters to best fit the box.
- Try other auxiliary indicators for further signal verification, e.g. KDJ, MACD.
- Test stop loss and take profit settings for higher stability.
Conclusion
In summary, the Trending Darvas Box strategy is an aggressively trading strategy targeting short-term trends. It captures trend changes swiftly with the Darvas box channel, while auxiliary indicators helps improving accuracy. The risk/reward profile is positive for this strategy, worth adopting and continuous optimizations.
Parameters
| Name | Default | What it controls |
|---|---|---|
| v_input_1 | timestamp(7 Mar 2022 00:00 +0000) | (?Backtest Range)From |
| v_input_2 | timestamp(19 Mar 2022 23:59 +0000) | To |
| v_input_3 | 5 | (?Darvas Box)Box Length |
| v_input_4 | 3 | (?MavilimW)First Moving Average length |
| v_input_5 | 5 | Second Moving Average length |
| v_input_int_1 | 10 | (?Relative Vigor Index)Length |
| v_input_int_2 | false | Offset |
Source Pine Script
/*backtest
start: 2023-11-26 00:00:00
end: 2023-12-26 00:00:00
period: 1d
basePeriod: 1h
exchanges: [{"eid":"Futures_Binance","currency":"BTC_USDT"}]
*/

// This source code is subject to the terms of the Mozilla Public License 2.0 at https://mozilla.org/MPL/2.0/
// © xxy_theone
// https://www.youtube.com/watch?v=YYxlnFOX9sQ
// This strategy script has been made to backtest the strategy explained in the video above


//@version=5
strategy(shorttitle = "Darvas Box Test", title="TradeIQ Darvas Box Test", overlay=true, pyramiding=0, default_qty_type=strategy.percent_of_equity, default_qty_value=100, initial_capital=100, currency=currency.USD)

// === INPUT BACKTEST RANGE ===
var GRP1 = "Backtest Range"
fromDate = input(timestamp("7 Mar 2022 00:00 +0000"), "From", group=GRP1)
toDate = input(timestamp("19 Mar 2022 23:59 +0000"), "To", group=GRP1)
window() =>  true


var GRP3 = "Darvas Box"
boxp=input(5, "Box Length", group=GRP3)

LL = ta.lowest(low,boxp)
k1=ta.highest(high,boxp)
k2=ta.highest(high,boxp-1)
k3=ta.highest(high,boxp-2)

NH =  ta.valuewhen(high>k1[1],high,0)
box1 =k3<k2
TopBox = ta.valuewhen(ta.barssince(high>k1[1])==boxp-2 and box1, NH, 0)
BottomBox = ta.valuewhen(ta.barssince(high>k1[1])==boxp-2 and box1, LL, 0)


plot(TopBox, linewidth=3, color=color.green, title="TBbox")
plot(BottomBox, linewidth=3, color=color.red, title="BBbox")


var GRP4 = "MavilimW"

fmal=input(3,"First Moving Average length", group=GRP4)
smal=input(5,"Second Moving Average length", group=GRP4)
tmal=fmal+smal
Fmal=smal+tmal
Ftmal=tmal+Fmal
Smal=Fmal+Ftmal

M1= ta.wma(close, fmal)
M2= ta.wma(M1, smal)
M3= ta.wma(M2, tmal)
M4= ta.wma(M3, Fmal)
M5= ta.wma(M4, Ftmal)
MAVW= ta.wma(M5, Smal)
col1= MAVW>MAVW[1]
col3= MAVW<MAVW[1]
colorM = col1 ? color.blue : col3 ? color.red : color.yellow

plot(MAVW, color=colorM, linewidth=2, title="MAVW")


var GRP5 = "Relative Vigor Index"
len = input.int(10, title="Length", minval=1, group=GRP5)
rvi = math.sum(ta.swma(close-open), len)/math.sum(ta.swma(high-low),len)
sig = ta.swma(rvi)
offset = input.int(0, "Offset", minval = -500, maxval = 500, group=GRP5)
//plot(rvi, color=#008000, title="RVGI", offset = offset)
//plot(sig, color=#FF0000, title="Signal", offset = offset)


var longStopSet = false

long = ta.crossover(close,TopBox) and close > MAVW ? true : false
longClose = strategy.opentrades.profit(strategy.opentrades-1)>0 and ta.crossunder(rvi,sig) ? true : false
strategy.entry("Long Position", strategy.long, when = long and window() and strategy.position_size==0 and strategy.closedtrades<100)
if(longStopSet==false and strategy.position_size > 0)
    strategy.exit("exit", "Long Position", stop=BottomBox)
    longStopSet := true
if(strategy.position_size==0)
    longStopSet := false
strategy.close("Long Position", when = longClose)

var shortStopSet = false

short = ta.crossunder(close,BottomBox) and close < MAVW ? true : false
shortClose = strategy.opentrades.profit(strategy.opentrades-1)>0 and ta.crossover(rvi,sig) ? true : false
strategy.entry("Short Position", strategy.short, when = short and window() and strategy.position_size==0 and strategy.closedtrades<100)
if(shortStopSet==false and strategy.position_size < 0)
    strategy.exit("exit", "Short Position", stop=TopBox)
    shortStopSet := true
if(strategy.position_size==0)
    shortStopSet := false
strategy.close("Short Position", when = shortClose)
Published by ChaoZhang on the FMZ strategy square · last modified 2023-12-27. Collected in the Quant Trading Vault. Unvalidated research: re-test with your own data and costs before trusting it.
Build this with AgenKit
A spec is not a trading system. Paste this into your coding agent and AgenKit runs a specialist team — architecture, test-first build, risk gates, review — with paper trading on by default.
/agenkit build a production-grade trading bot with a backtest engine, risk controls and paper trading by default from strategies/Trending-Darvas-Box-Quantitative-Trading-Strategy.md- npx agenkit install engineering-kit in your project
- Paste the command into your agent and approve each phase
- Get tests, backtest, risk controls and a paper-trading switch
Understand it first
Before you run this, read the lesson behind the idea and how to backtest it honestly. Specs like this one are the survivors of an unknown number of trials; deflate their results accordingly.
Related specs
- Adaptive ATR and RSI Trend Following Strategy with Trailing Stop LossPine Script · Trend following · 1h
- Adaptive Bollinger Bands Trend Tracking StrategyPine Script · Trend following · 1h
- Adaptive Price Crossing Moving Average Trading StrategyPine Script · Trend following · 1d
- Advanced Multi Indicator Multi Dimensional Trend Cross Quantitative StrategyPine Script · Trend following · 3h
- Advanced Supertrend Indicator Trading Mechanism Optimization StrategyPine Script · Trend following · 1d
- Bollinger Bands and RSI Trend Following StrategyPine Script · Trend following · 1h