Strategy vault / Trend following
TrendSurfing Double Moving Average Crossover Trend Strategy
TrendSurfingThe strategy is a trend following strategy with double moving average crossover as the main trading signal. It also combines the triangle visual indicator, 200-day EMA, ROC indicator and RSI indicator to…
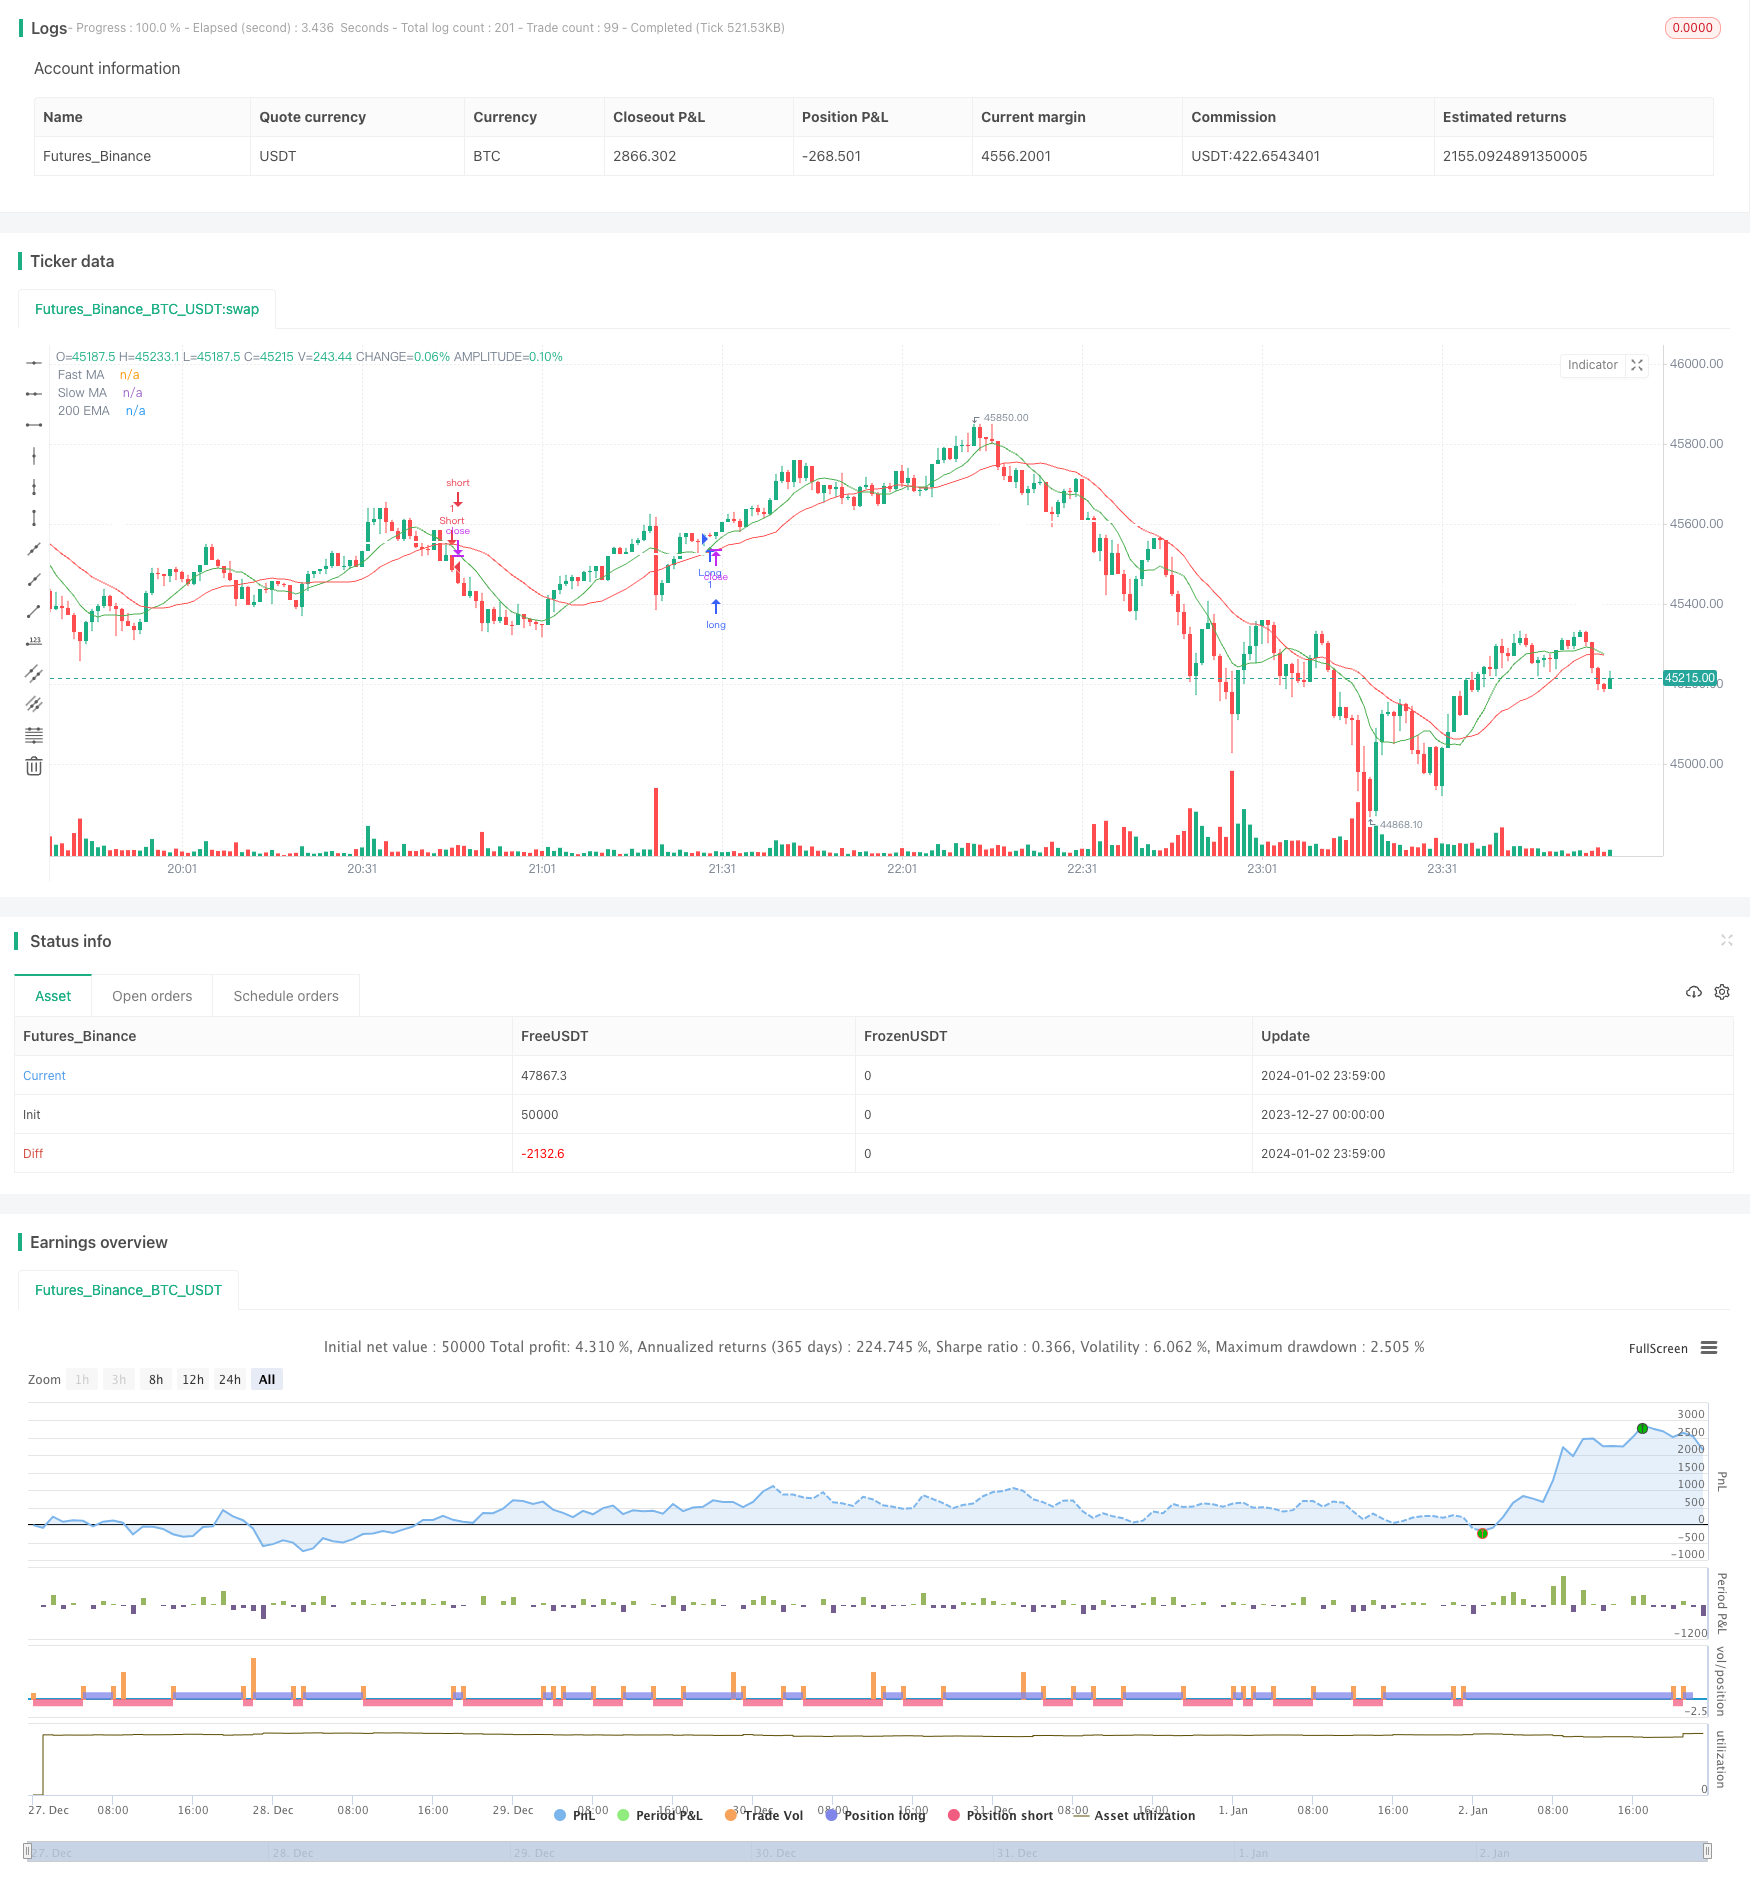
Overview
TrendSurfingThe strategy is a trend following strategy with double moving average crossover as the main trading signal. It also combines the triangle visual indicator, 200-day EMA, ROC indicator and RSI indicator to filter out noise and accurately capture the new trend direction at trend turning points. This strategy is suitable for medium and long-term positions and can achieve stable growth in the bull market.
Strategy Principle
TrendSurfingThe strategy is mainly based on the golden cross of the fast moving average and the slow moving average to form buy and sell signals. A buy signal is generated when the fast moving average crosses the slow moving average; a sell signal is generated when the fast moving average crosses below the slow moving average.
Additionally, the strategy introduces multiple auxiliary indicators to filter false signals or determine trend quality. Specifically:
- ROCIndicator determines price change trend and speed
- RSIWhether an indicator is in the overbought or oversold region
- 200Daily EMA determines the overall trend direction
- Triangle visual indicator marks entry points on the chart
Through the comprehensive judgment of multiple indicators, the TrendSurfing strategy can accurately locate the turning point of the trend, track the clear trend in the medium and long term, and avoid being misled by market noise or short-term adjustments.
Advantage Analysis
1. Capture clear mid-to-long-term trends
This strategy basically determines the turning point of the trend through the crossing of moving averages, filters out short-term noise by combining indicators such as the 200-day EMA, and focuses on grasping the mid- and long-term trends.
2. Combine multiple indicators to confirm high-quality entry timing
In addition to the moving average crossover itself, this strategy also introduces ROC, RSI and other indicators to avoid the shock range at the turning point of the trend to ensure the quality of entry.
3. Intuitive and readable triangle visual indicator
The green downward triangle marks the buying opportunity, and the red upward triangle marks the selling opportunity, which is clear at a glance.
4. Customizable parameters to meet different needs
Users can freely adjust moving average parameters, ROC length, RSI length, etc., to suit their trading style.
5. Take into account stop loss and take profit management This strategy uses ATR multiplied by the risk ratio as the stop-loss and take-profit levels, allowing control of single-trade risk.
Risk Analysis
1. Risk of missed orders
Any strategy based on moving average crossover will face certain missed trades or stop-loss risks during moving average oscillations.
2. Improper parameter settings may lead to over-optimization
Users should avoid pursuing standard parameters and setting indicator values too ideally. Parameter testing should be conducted based on different market conditions and varieties.
3. Cannot fully filter out market systemic risk events Under extreme market conditions, such as black swan events, significant losses may still be possible.
Optimization Direction
1. Test and optimize parameter settings
The moving average period, ROC length, RSI parameters, etc. must be backtested and optimized to make them more consistent with the characteristics of different trading varieties.
2. Test and introduce other auxiliary indicators
You can continue to test the combined effects of other indicators such as BOLL and KDJ crossing with the moving average.
3. Optimize take-profit and stop-loss using algorithmic trading
Introduce machine learning algorithms to make stop loss and profit more intelligent and adapt to the dynamically changing market environment.
4. Explore combinations with other strategies or models
Combining with fundamental stock selection strategies, statistical arbitrage strategies, portfolio optimization models, etc., can further control risk and improve returns.
Summary
TrendSurfingThe strategy is a simple, straightforward, and risk-controllable trend-following strategy. It revolves around trading signals formed by double moving average crossovers and is filtered using various auxiliary indicators. This strategy is suitable for medium to long-term positions and can steadily track bull market trends. We will continue to optimize this strategy through parameter testing, indicator expansion, risk control, and other methods to achieve more stable performance in a broader market.
||
Overview
The TrendSurfing strategy is a trend tracking strategy based primarily on double moving average crossover signals. It also incorporates triangle visual indicators, 200-day EMA, ROC indicator and RSI indicator to filter out noise and accurately capture trend reversals. This strategy is suitable for medium-to-long-term holding and can achieve steady growth in a bull market.
Strategy Logic
The TrendSurfing strategy mainly relies on golden cross and death cross formed by fast moving average and slow moving average to generate buy and sell signals. When the fast MA crosses above the slow MA, a buy signal is generated. When the fast MA crosses below the slow MA, a sell signal is generated.
In addition, the strategy incorporates several auxiliary indicators to filter out false signals or determine trend quality, including:
- ROC indicator to determine price trend and momentum
- RSI oscillator to detect overbought/oversold levels
- 200-day EMA to determine overall trend direction
- Triangle visual indicators to mark entry points on chart
By comprehensively judging various indicators, the TrendSurfing strategy can accurately locate trend turning points and track definite medium-to-long term trends without being misguided by market noise or short-term corrections.
Advantage Analysis
1. Catch Medium-to-Long Term Trend
The strategy basically judges trend reversal based on MA crosses, and uses indicators like 200-day EMA to filter out short-term noise, with focus on medium-to-long term trend capture.
2. Multiple Indicators Ensure High Quality Entry
On top of MA crossover itself, the incorporation of ROC, RSI and other indicators enables avoidance of consolidation zones on reversal points and ensures quality entry.
3. Intuitive Triangle Visual Indicators
Green downward triangles indicate long entries, red upward triangles indicate short entries. Clean and straightforward.
4. Customizable Parameters for Different Needs
Users can freely adjust parameters like MA periods, ROC length, RSI length etc according to their own trading style.
5. Stop Loss and Take Profit Control
The strategy sets stop loss and take profit based on ATR value multiplied by risk percentage, enabling per trade risk control.
Risk Analysis
1. Risk of Missing Trades
Any MA crossover based strategy has inherent risk of missing trades or being stopped out when MA is oscillating.
2. Over-optimization from Improper Parameter Settings Users should avoid chasing hypothetically ideal parameter values. Parameters should be tested and adapted based on different market conditions and products.
3. Inability to Fully Filter Black Swan Events
Under extreme market conditions, strategies could still face large losses from market systemic risks.
Optimization Directions
1. Test and Optimize Parameter Values
Periods of MAs, length of ROC, values of RSI etc should go through rigorous backtesting and optimization to fit characteristics of different trading products.
2. Test and Incorporate Other Auxiliary Indicators
Continue testing combinations of other indicators like BOLL, KDJ etc with MA crosses for better performance.
3. Coordinate with Algorithmic Trading for Better Risk Control Introduce machine learning algorithms to enable more intelligent stop loss and take profit, adapting to dynamic market environments.
4. Explore Combinations with Other Strategies or Models
Combining with fundamentals-based stock picking strategies, statistical arbitrage strategies, portfolio optimization models etc could further enhance risk control and return.
Conclusion
The TrendSurfing strategy is a simple, straightforward trend tracking strategy with controllable risk. Trading signals are generated from MA crosses and filtered by multiple auxiliary indicators. It is suitable for medium-to-long term holding to steadily track bull market trends. We will continue optimizing this strategy through parameter testing, indicator expansion, risk control etc to achieve more reliable performance across diverse markets.
Parameters
| Name | Default | What it controls |
|---|---|---|
| v_input_1 | 9 | Fast MA Length |
| v_input_2 | 21 | Slow MA Length |
| v_input_3 | 14 | ROC Length |
| v_input_4 | 14 | RSI Length |
| v_input_5 | true | Risk Percentage |
Source Pine Script
/*backtest
start: 2023-12-27 00:00:00
end: 2024-01-03 00:00:00
period: 1m
basePeriod: 1m
exchanges: [{"eid":"Futures_Binance","currency":"BTC_USDT"}]
*/

//@version=4
strategy("Moving Average Crossover with Triangles, 200 EMA, ROC, and RSI", overlay=true)

// Define input parameters
fast_length = input(9, title="Fast MA Length")
slow_length = input(21, title="Slow MA Length")
roc_length = input(14, title="ROC Length")
rsi_length = input(14, title="RSI Length")

// Calculate moving averages
fast_ma = sma(close, fast_length)
slow_ma = sma(close, slow_length)

// Plot moving averages
plot(fast_ma, color=color.green, title="Fast MA")
plot(slow_ma, color=color.red, title="Slow MA")

// Plot 200 EMA
ema_200 = ema(close, 200)
plot(ema_200, color=color.white, title="200 EMA", linewidth=2)

// Calculate Rate of Change (ROC)
roc = roc(close, roc_length)

// Calculate RSI
rsi = rsi(close, rsi_length)

// Define strategy entry and exit conditions
long_condition = crossover(fast_ma, slow_ma) and roc > 0 and close > ema_200 and rsi > 55
short_condition = crossunder(fast_ma, slow_ma) and roc < 0 and close < ema_200 and rsi < 45

// Execute strategy
strategy.entry("Long", strategy.long, when=long_condition)
strategy.entry("Short", strategy.short, when=short_condition)

// Define stop loss and take profit levels
risk_percent = input(1, title="Risk Percentage", minval=0.1, maxval=5, step=0.1) / 100
atr_value = atr(14)
stop_loss = close - atr_value * risk_percent
take_profit = close + atr_value * risk_percent

strategy.exit("Take Profit/Stop Loss", from_entry="Long", loss=stop_loss, profit=take_profit)
strategy.exit("Take Profit/Stop Loss", from_entry="Short", loss=stop_loss, profit=take_profit)

// Plot larger triangles on crossover and crossunder
plotshape(series=long_condition, title="Long Entry", color=color.green, style=shape.triangleup, location=location.belowbar, size=size.small)
plotshape(series=short_condition, title="Short Entry", color=color.red, style=shape.triangledown, location=location.abovebar, size=size.small)
Published by ChaoZhang on the FMZ strategy square · last modified 2024-01-04. Collected in the Quant Trading Vault. Unvalidated research: re-test with your own data and costs before trusting it.
Build this with AgenKit
A spec is not a trading system. Paste this into your coding agent and AgenKit runs a specialist team — architecture, test-first build, risk gates, review — with paper trading on by default.
/agenkit build a production-grade trading bot with a backtest engine, risk controls and paper trading by default from strategies/TrendSurfing-Double-Moving-Average-Crossover-Trend-Strategy.md- npx agenkit install engineering-kit in your project
- Paste the command into your agent and approve each phase
- Get tests, backtest, risk controls and a paper-trading switch
Understand it first
Before you run this, read the lesson behind the idea and how to backtest it honestly. Specs like this one are the survivors of an unknown number of trials; deflate their results accordingly.
Related specs
- Bollinger Bands and RSI Trend Following StrategyPine Script · Trend following · 1h
- Dual ATR Channel Trend Following StrategyPine Script · Trend following · 15m
- Dual Mode Adaptive Trend Trading Strategy EMA Crossover with ATR Volatility Based Risk Management SystemPine Script · Trend following · 1d
- Dynamic Dual EMA Crossover Strategy with Adaptive Profit Loss ControlPine Script · Trend following · 1d
- Dynamic Signal Line Trend Following and Volatility Filtering StrategyPine Script · Trend following · 1h
- EMA Cross Trend Following Strategy with SMA Stop Loss and Re Entry MechanismPine Script · Trend following · 1h