Volatility Force Breakthrough Trading Strategy
This strategy uses moving average, ATR, Bollinger Bands for trend judgment and breakout trading, combined with force index for timing, belongs to breakout trading strategy.
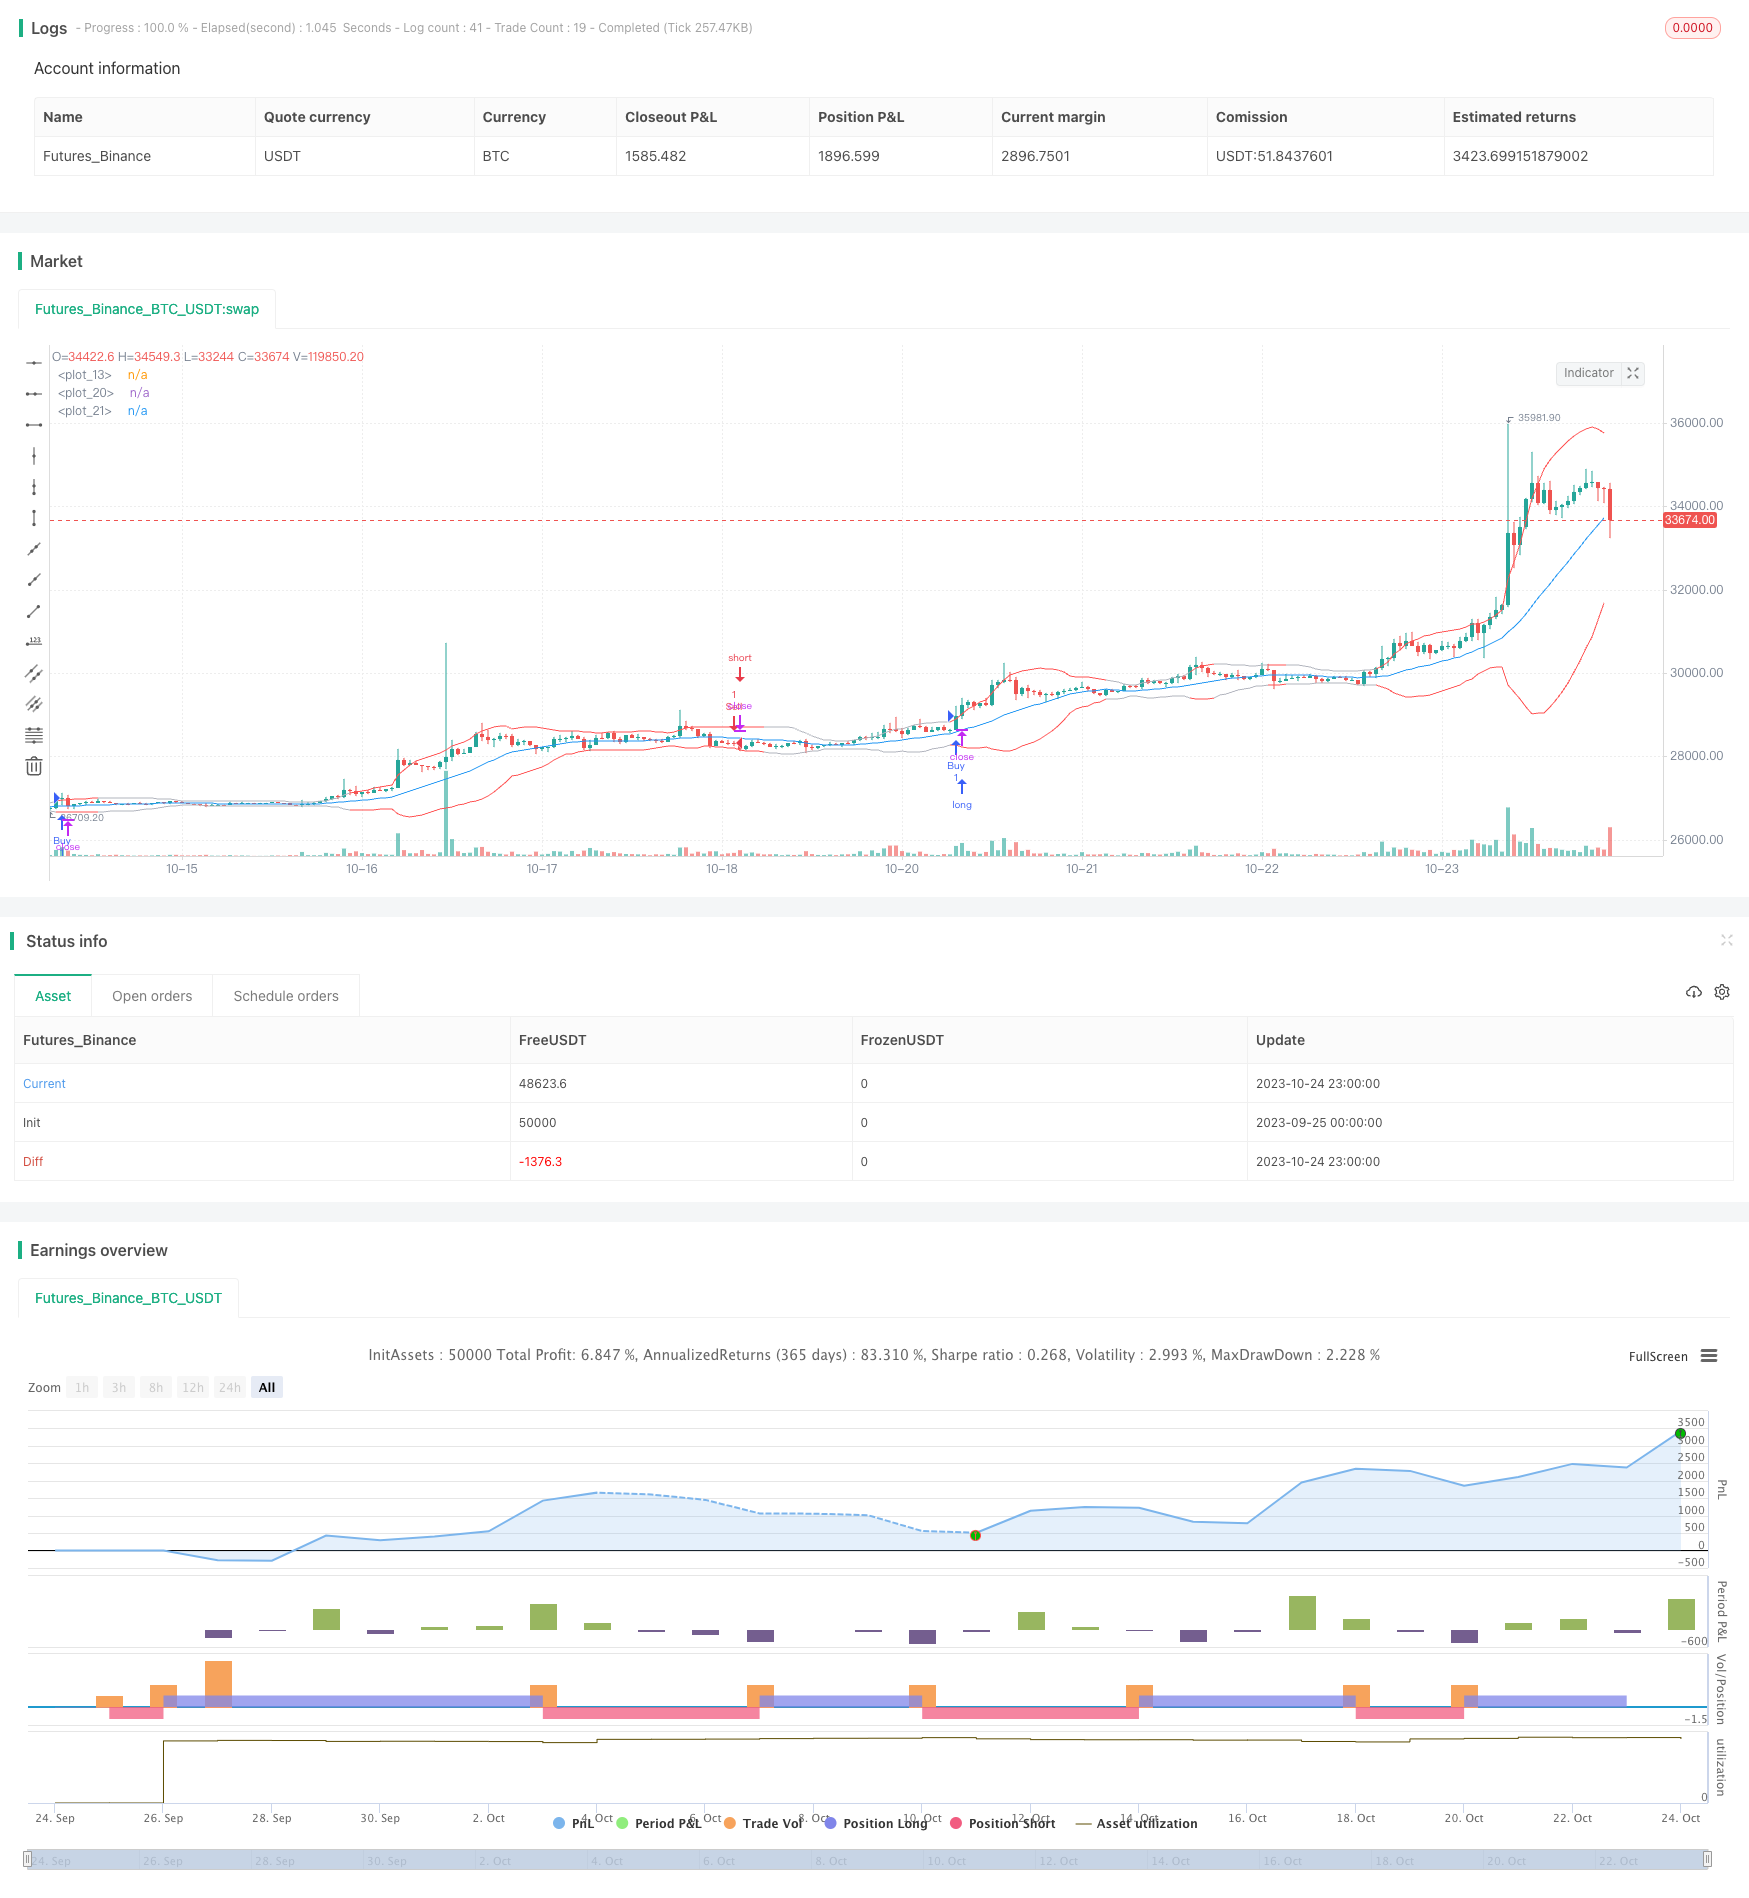
Overview
This strategy uses moving average, ATR, Bollinger Bands for trend judgment and breakout trading, combined with force index for timing, belongs to breakout trading strategy.
Strategy Logic
Calculate middle, upper and lower lines of Bollinger Bands. Middle line is sma of close price, upper and lower are middle line ± stdDev.
Calculate fast and slow ATR. Fast ATR has period of 20, slow ATR has period of 50.
Calculate force index XFORCE, which is cumulative of volume * (close - previous close). And calculate fast and slow EMA of XFORCE.
Judge long signal: fast XFORCE cross above slow XFORCE, and fast ATR > slow ATR, and close > open.
Judge short signal: fast XFORCE cross below slow XFORCE, and fast ATR > slow ATR, and close < open.
Go long when long signal triggered, go short when short signal triggered.
Advantage Analysis
Moving average provides trend, Bollinger Bands provides breakout points.
ATR judges volatility, implements volatility trading.
Force index determines force direction, implements force breakout.
Combination of multiple indicators provides comprehensive judgment.
Clear and simple rules, easy to understand and implement.
Good backtest results, stable profit.
Risk Analysis
Bollinger Bands may generate wrong signals if width is improper.
Wrong ATR parameters cannot catch market volatility.
Force index has limited effect, cannot determine real trend reversal.
Difficult to adjust parameters and weights for multiple indicators.
Breakout signals may be inaccurate, divergence may happen.
Drawdown may be large, can use stop loss to control it.
Optimization Directions
Optimize Bollinger Bands parameters for different periods and instruments.
Optimize ATR parameters to better capture volatility.
Add trend indicators like MACD for trend validation.
Add stop loss strategies like trailing stop to control drawdown.
Utilize AI algorithms to judge reversal signals.
Combine multiple timeframes for comprehensive judgment and lower false signals.
Summary
This strategy integrates moving average, ATR, Bollinger Bands and Force Index to form a complete breakout trading system. Further improvements on parameters optimization, adding trend filter, stop loss strategy and AI algorithms can enhance stability and profitability. But no strategy is perfect, continuous optimizations against backtest results are needed to adapt to changing market conditions.
Parameters
| Name | Default | What it controls |
|---|---|---|
| v_input_1 | 3 | Fast |
| v_input_2 | 20 | Slow |
| v_input_3 | 20 | ATR Fast |
| v_input_4 | 50 | ATR Slow |
| v_input_5 | 20 | Length |
| v_input_6 | 2 | multiplier |
| v_input_7_close | 0 | Source: close | high | low | open | hl2 | hlc3 | hlcc4 | ohlc4 |
Source Pine Script
/*backtest
start: 2023-09-25 00:00:00
end: 2023-10-25 00:00:00
period: 1h
basePeriod: 15m
exchanges: [{"eid":"Futures_Binance","currency":"BTC_USDT"}]
*/

//@version=2
strategy("yuthavithi volatility based force trade scalper strategy", overlay=true)

fast = input(3, minval= 1, title="Fast")
slow = input(20, minval = 1, title = "Slow")
atrFast = input(20, minval = 1, title = "ATR Fast")
atrSlow = input(50, minval = 1, title = "ATR Slow")

len = input(20, minval=1, title="Length")
multiplier = input(2, minval=1, title="multiplier")
src = input(close, title="Source")
bbMid = sma(src, len)
plot(bbMid, color=blue)

atrFastVal = atr(atrFast)
atrSlowVal = atr(atrSlow)
stdOut = stdev(close, len)
bbUpper = bbMid + stdOut * multiplier
bbLower = bbMid - stdOut * multiplier
plot(bbUpper, color = (atrFastVal > atrSlowVal ? red : silver))
plot(bbLower, color = (atrFastVal > atrSlowVal ? red : silver))


force = volume * (close -  nz(close[1]))
xforce = cum(force)
xforceFast = ema(xforce, fast)
xforceSlow = ema(xforce, slow)

bearish = ((xforceFast < xforceSlow) and (atrFastVal > atrSlowVal)) and ((xforceFast[1] > xforceSlow[1]) or (atrFastVal[1] < atrSlowVal[1])) and (close < open)
bullish = ((xforceFast > xforceSlow) and (atrFastVal > atrSlowVal)) and ((xforceFast[1] < xforceSlow[1]) or (atrFastVal[1] < atrSlowVal[1])) and (close > open)


if (bullish)
    strategy.entry("Buy", strategy.long)

if (bearish)
    strategy.entry("Sell", strategy.short)
Published by ChaoZhang on the FMZ strategy square · last modified 2023-10-26. Collected in the Quant Trading Vault. Unvalidated research: re-test with your own data and costs before trusting it.
Build this with AgenKit
A spec is not a trading system. Paste this into your coding agent and AgenKit runs a specialist team — architecture, test-first build, risk gates, review — with paper trading on by default.
/agenkit build a production-grade trading bot with a backtest engine, risk controls and paper trading by default from strategies/Volatility-Force-Breakthrough-Trading-Strategy.md- npx agenkit install engineering-kit in your project
- Paste the command into your agent and approve each phase
- Get tests, backtest, risk controls and a paper-trading switch
Understand it first
Before you run this, read the lesson behind the idea and how to backtest it honestly. Specs like this one are the survivors of an unknown number of trials; deflate their results accordingly.
Related specs
- Momentum Breakout Moving Average StrategyPine Script · Breakout · 1d
- Momentum Breakout Trading Strategy 440964Pine Script · Breakout · 5m
- Moving Average Crossover and Upper Rail Breakthrough Impulse StrategyPine Script · Breakout · 1m
- Quantitative Strategy PSARZigZagMACDART Based on Multi Indicator CombinationPine Script · Breakout · 1m
- Volatility Breakthrough StrategyPine Script · Breakout · 10m
- Cross Timeframe SuperTrend Breakout StrategyPine Script · Breakout · 1h