Volume driven Oscillation Quant Strategy
This is a trading strategy based on Klinger quantitative indicators. This strategy captures changes in buying and selling power in price fluctuations to discover turning points in market trends. Its advantage is that…
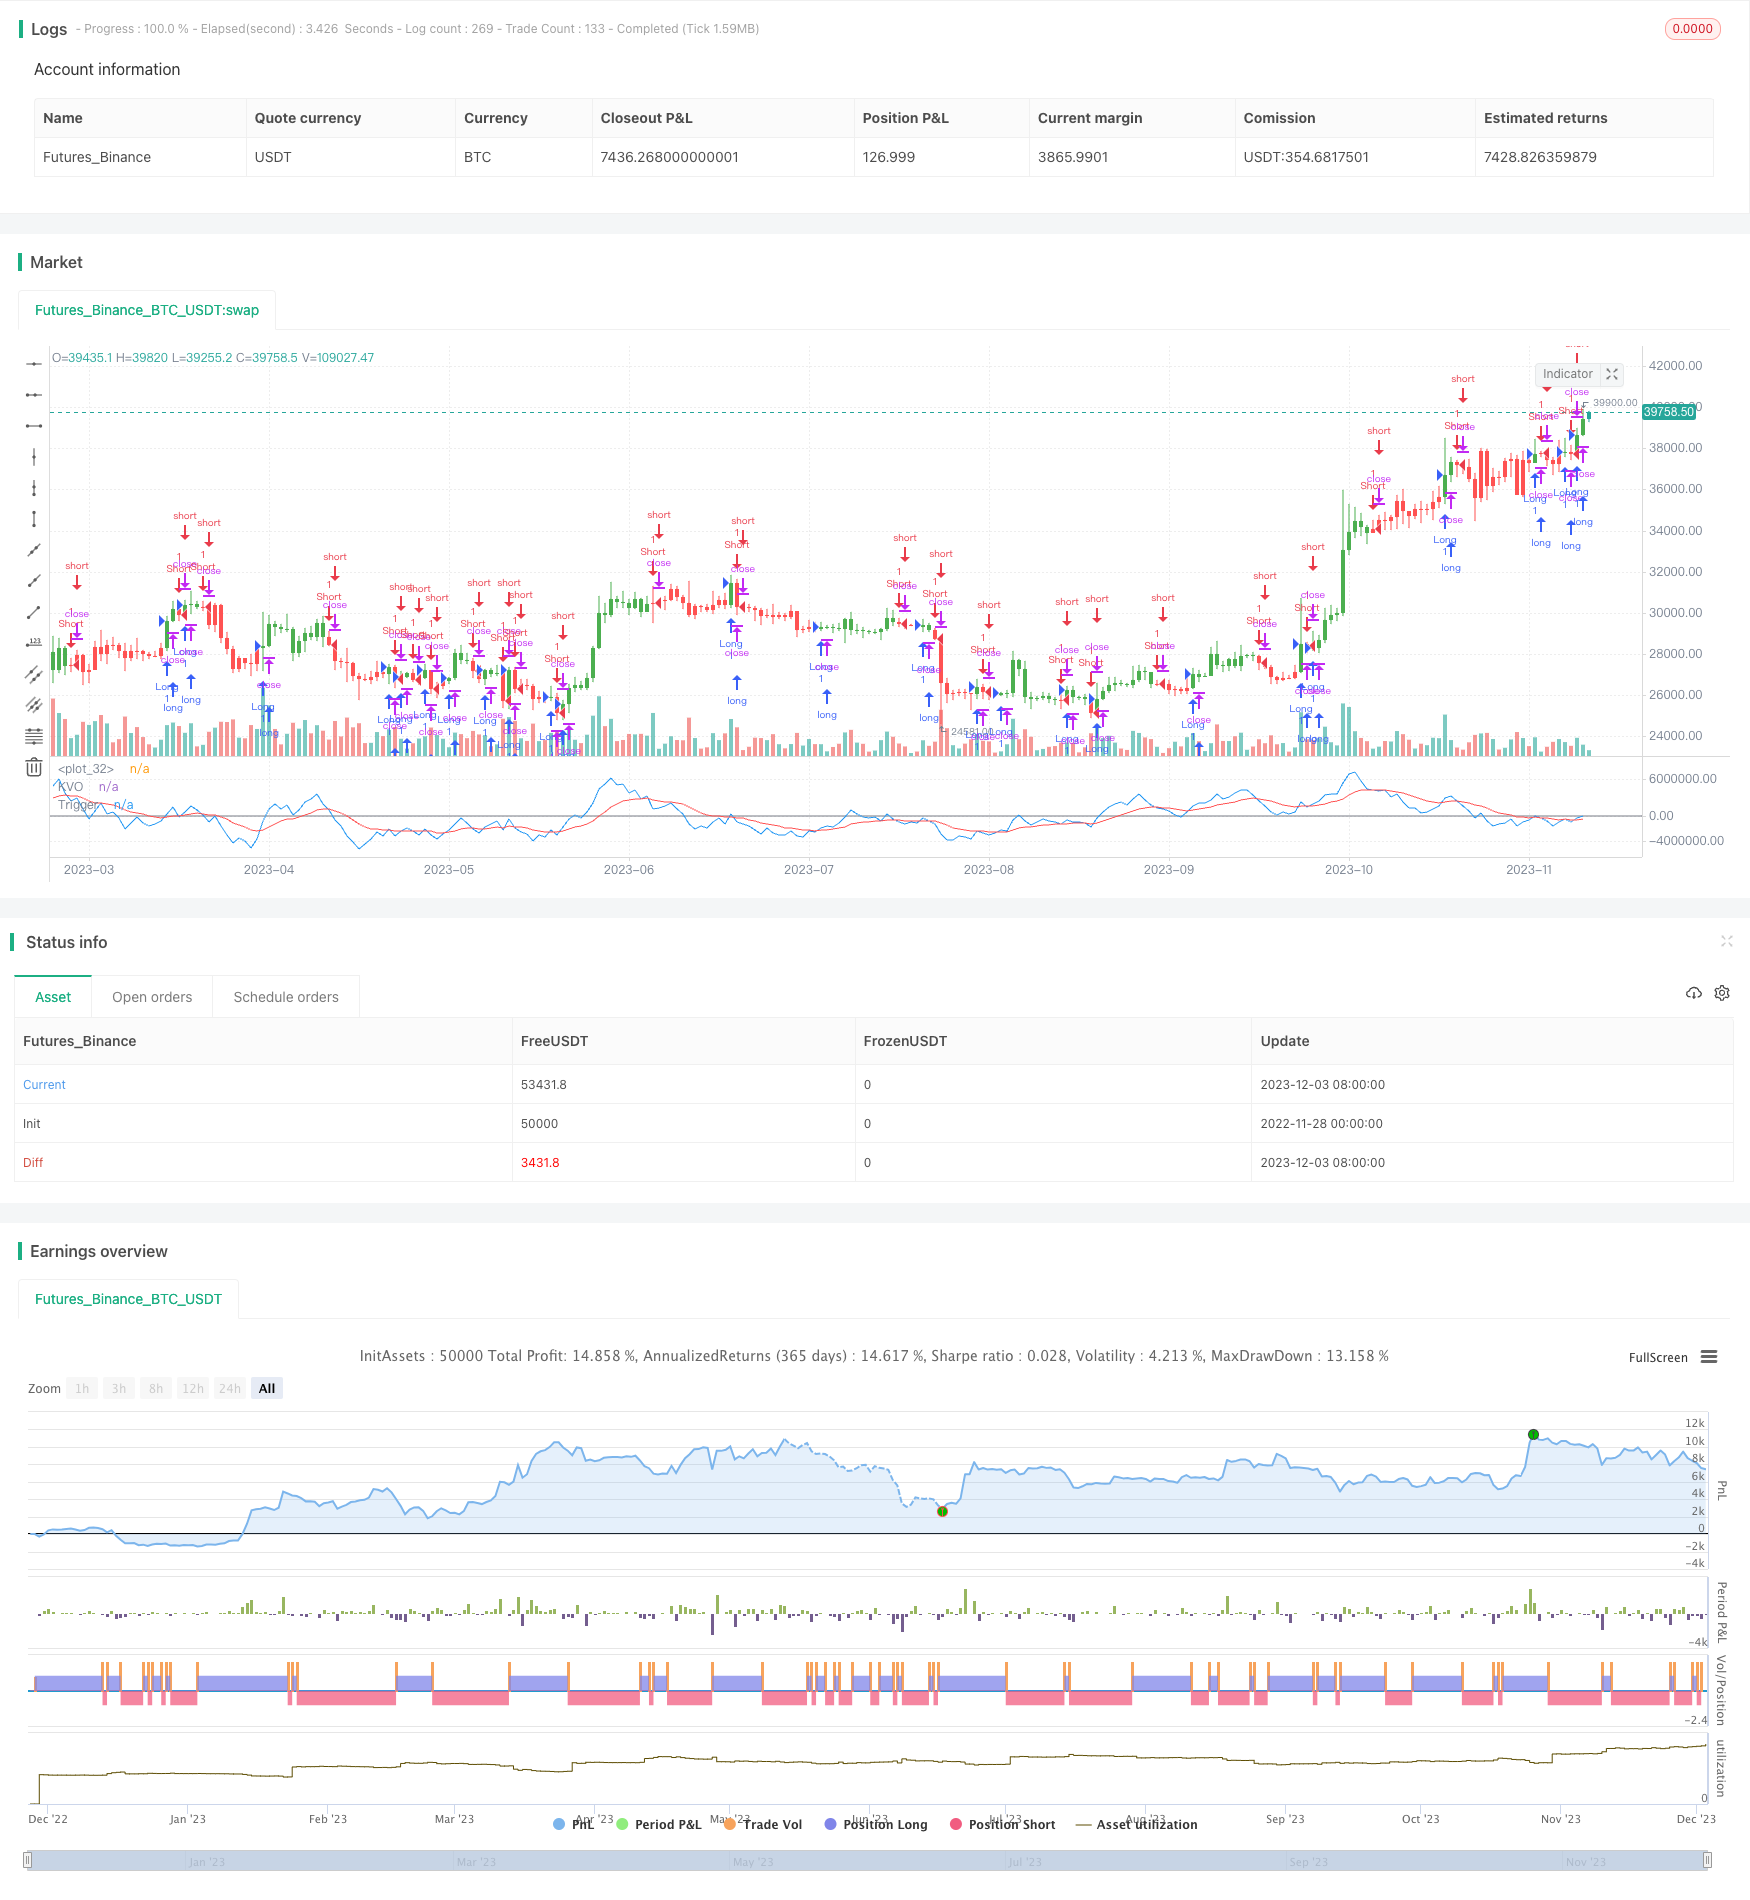
This is a trading strategy based on Klinger quantitative indicators. This strategy captures changes in buying and selling power in price fluctuations to discover turning points in market trends. Its advantage is that it is sensitive and accurate, and can be used for both short-term and long-term analysis. However, there are also some risks that need to be noted.
Strategy Principle
This strategy is based on the following theoretical foundations:
- Price range (highest price - lowest price) reflects price volatility, while trading volume is the driving force of price movement.
- The sum of the day's highest price + lowest price + closing price is greater than the sum of the previous day, indicating that the buyer's power has increased and is a characteristic of accumulation; on the contrary, it is a characteristic of distribution.
- Continuous changes in trading volume reflect the changes in the strength of buyers and sellers.
Based on these theories, this strategy calculates the Klinger quantitative indicator by comparing the sum of closing prices with the size of the previous day, combined with changes in trading volume. Go long when the indicator crosses above its own moving average and go short when it crosses below.
Specifically, the strategy has three built-in indicators:
- xTrend:Reflects the power of price fluctuation trends, based on the comparison of the sum of the closing prices of the day with the previous day.
- xFast:xTrendFast moving average, parameter is 34 days.
- xSlow:xTrendSlow moving average, parameter is 55 days.
Then calculate the difference xKVO as a trading indicator. Go long when it crosses above the 13-day moving average xTrigger, go short when it crosses below.
Strategy Advantages
The biggest advantage of this strategy is that it is suitable for both short-term and long-term analysis. The parameter settings of the fast and slow moving averages enable it to sensitively capture changes in short-term trends. At the same time, it can also filter out short-term market noise and capture long-term trends. This is something that many indicators that track the price itself have difficulty doing.
Additionally, this strategy only calculates based on price and volume. No complex mathematical indicators are needed, calculation efficiency is high, suitable for live trading.
Risks and Countermeasures
The biggest risk of this strategy is that the volume indicator has a weak ability to identify false breakthroughs. When the price makes a short-term adjustment and breaks above the moving average, this strategy may send a false long signal. At this time, it is necessary to combine other factors to determine the trend.
In addition, this strategy is sensitive to parameter settings. The parameters of fast and slow moving averages and trading moving averages need to be repeatedly tested and optimized to obtain the best performance.
Strategy optimization
Based on risk analysis, we can further optimize the strategy from the following aspects.:
Add stop loss mechanism. Stop loss and exit when the price falls back by a certain percentage, which can reduce the noise interference of short-term adjustments.
Add trend filter indicator. Use MACD and other exponential moving average indicators to determine the overall market trend to avoid missing the direction in volatile markets.
Optimize parameter settings. Use historical backtesting data to find the best parameter combinations and improve strategy stability.
Early-stage capital management optimization, such as dynamically adjusting positions according to take-profit and stop-loss situations.
Summary
This strategy captures the changes in market buying and selling power by comparing the relationship between the total price and trading volume, while taking into account sensitivity and stability. On the premise of optimizing parameter settings and combining trend judgment, good performance can be achieved. However, traders still need to be wary of the risks caused by the limitations of the indicator itself.
||
This is a trading strategy based on the Klinger Volume Oscillator. It captures the shifts in buying and selling forces during price fluctuations to identify turning points in market trends. The advantages are sensitivity and accuracy for both short-term and long-term analysis. However, some risks need to be noticed.
Strategy Logic
The strategy is built on the following assumptions:
- The price range (high-low) reflects the amplitude of price swings, while volume is the driving force behind price movements.
- If today's sum of high + low + close is greater than yesterday's, it indicates strengthened buying forces and accumulation; the opposite suggests distribution.
- Continuous changes in volume reflect shifts in the forces of buyers and sellers.
Based on the theories, the strategy calculates the Klinger Volume Oscillator by comparing the relationship between today's sum of closing prices and yesterday's, combined with changes in volume. It goes long when the indicator crosses above its moving average line, and goes short on crosses below.
Specifically, there are three main indicators involved:
- xTrend: reflects the force of price trend based on comparison of sum of prices between days.
- xFast: fast EMA of xTrend with period of 34.
- xSlow: slow EMA of xTrend with period of 55.
The difference xKVO is then calculated as the trading indicator. Go long on crossing above 13-day EMA xTrigger, and short on crossing below.
Advantages
The greatest advantage is being suitable for both short-term and long-term analysis simultaneously. The fast and slow EMA settings make it sensitive to catch short-term swings, while also filtering out market noise and capturing long-term trends, which most price-based indicators struggle with.
In addition, it is purely based on price and volume data without complex math. This makes it highly efficient for actual trading applications.
Risks & Solutions
The main risk is weaker ability to distinguish false breakouts. Short-term price adjustments may generate wrong long signals. Other factors should be considered to determine the trend.
Also, the strategy is sensitive towards parameter tuning. Optimization is required on the EMAs and trigger line to find best performance.
Strategy Optimization
Some aspects that could further optimize the strategy according to the risks:
Add stop loss mechanisms. Exiting at some percentage retracement reduces noise interference.
Add trend filtering with indicators like MACD to avoid directional mistakes in ranging markets.
Optimize parameter sets through backtests to improve robustness.
Capital management optimization such as dynamic position sizing based on stop loss/take profit levels.
Conclusion
Overall, the strategy captures shifts in market forces by comparing price quantities and volumes for both sensitivity and stability. It can perform well given optimized parameters and trend validation, but inherent limitations of volume indicators can still pose risks for traders.
Parameters
| Name | Default | What it controls |
|---|---|---|
| v_input_1 | 13 | TrigLen |
| v_input_2 | 34 | FastX |
| v_input_3 | 55 | SlowX |
| v_input_4 | false | Trade reverse |
Source Pine Script
/*backtest
start: 2022-11-28 00:00:00
end: 2023-12-04 00:00:00
period: 1d
basePeriod: 1h
exchanges: [{"eid":"Futures_Binance","currency":"BTC_USDT"}]
*/

//@version=2
////////////////////////////////////////////////////////////
//  Copyright by HPotter v1.0 30/08/2017
// The Klinger Oscillator (KO) was developed by Stephen J. Klinger. Learning
// from prior research on volume by such well-known technicians as Joseph Granville,
// Larry Williams, and Marc Chaikin, Mr. Klinger set out to develop a volume-based
// indicator to help in both short- and long-term analysis.
// The KO was developed with two seemingly opposite goals in mind: to be sensitive
// enough to signal short-term tops and bottoms, yet accurate enough to reflect the
// long-term flow of money into and out of a security.
// The KO is based on the following tenets:
// Price range (i.e. High - Low) is a measure of movement and volume is the force behind
// the movement. The sum of High + Low + Close defines a trend. Accumulation occurs when
// today's sum is greater than the previous day's. Conversely, distribution occurs when
// today's sum is less than the previous day's. When the sums are equal, the existing trend
// is maintained.
// Volume produces continuous intra-day changes in price reflecting buying and selling pressure.
// The KO quantifies the difference between the number of shares being accumulated and distributed
// each day as "volume force". A strong, rising volume force should accompany an uptrend and then
// gradually contract over time during the latter stages of the uptrend and the early stages of
// the following downtrend. This should be followed by a rising volume force reflecting some
// accumulation before a bottom develops.
//
// You can change long to short in the Input Settings
// Please, use it only for learning or paper trading.
////////////////////////////////////////////////////////////
strategy(title="Klinger Volume Oscillator (KVO)", shorttitle="KVO")
TrigLen = input(13, minval=1)
FastX = input(34, minval=1)
SlowX = input(55, minval=1)
reverse = input(false, title="Trade reverse")
hline(0, color=gray, linestyle=line)
xTrend = iff(hlc3 > hlc3[1], volume * 100, -volume * 100)
xFast = ema(xTrend, FastX)
xSlow = ema(xTrend, SlowX)
xKVO = xFast - xSlow
xTrigger = ema(xKVO, TrigLen)
pos = iff(xKVO > xTrigger, 1,
	   iff(xKVO < xTrigger, -1, nz(pos[1], 0)))
possig = iff(reverse and pos == 1, -1,
          iff(reverse and pos == -1, 1, pos))
if (possig == 1)
    strategy.entry("Long", strategy.long)
if (possig == -1)
    strategy.entry("Short", strategy.short)
barcolor(possig == -1 ? red: possig == 1 ? green : blue )
plot(xKVO, color=blue, title="KVO")
plot(xTrigger, color=red, title="Trigger")
Published by ChaoZhang on the FMZ strategy square · last modified 2023-12-05. Collected in the Quant Trading Vault. Unvalidated research: re-test with your own data and costs before trusting it.
Build this with AgenKit
A spec is not a trading system. Paste this into your coding agent and AgenKit runs a specialist team — architecture, test-first build, risk gates, review — with paper trading on by default.
/agenkit build a production-grade trading bot with a backtest engine, risk controls and paper trading by default from strategies/Volume-driven-Oscillation-Quant-Strategy.md- npx agenkit install engineering-kit in your project
- Paste the command into your agent and approve each phase
- Get tests, backtest, risk controls and a paper-trading switch
Understand it first
Before you run this, read the lesson behind the idea and how to backtest it honestly. Specs like this one are the survivors of an unknown number of trials; deflate their results accordingly.
Related specs
- Adaptive Multi Period Trading Strategy Based on Wave Trend Momentum BreakoutPine Script · Breakout · 2h
- BB Breakout StrategyPine Script · Breakout · 1d
- BMSB Breakout Strategy BMSBPine Script · Breakout · 1h
- Bollinger Band T3 Moving Average StrategyPine Script · Breakout · 10m
- Bollinger Bands Dual track Breakthrough StrategyPine Script · Breakout · 30m
- Bollinger Breakout StrategyPine Script · Breakout · 30m