Strategy vault / Mean reversion
Vortex Trend Reversal Strategy
The Vortex Trend Reversal Strategy utilizes the Vortex Indicator to identify potential trend reversals and capture favorable market movements. By intelligently combining the Vortex Indicator with a moving average…
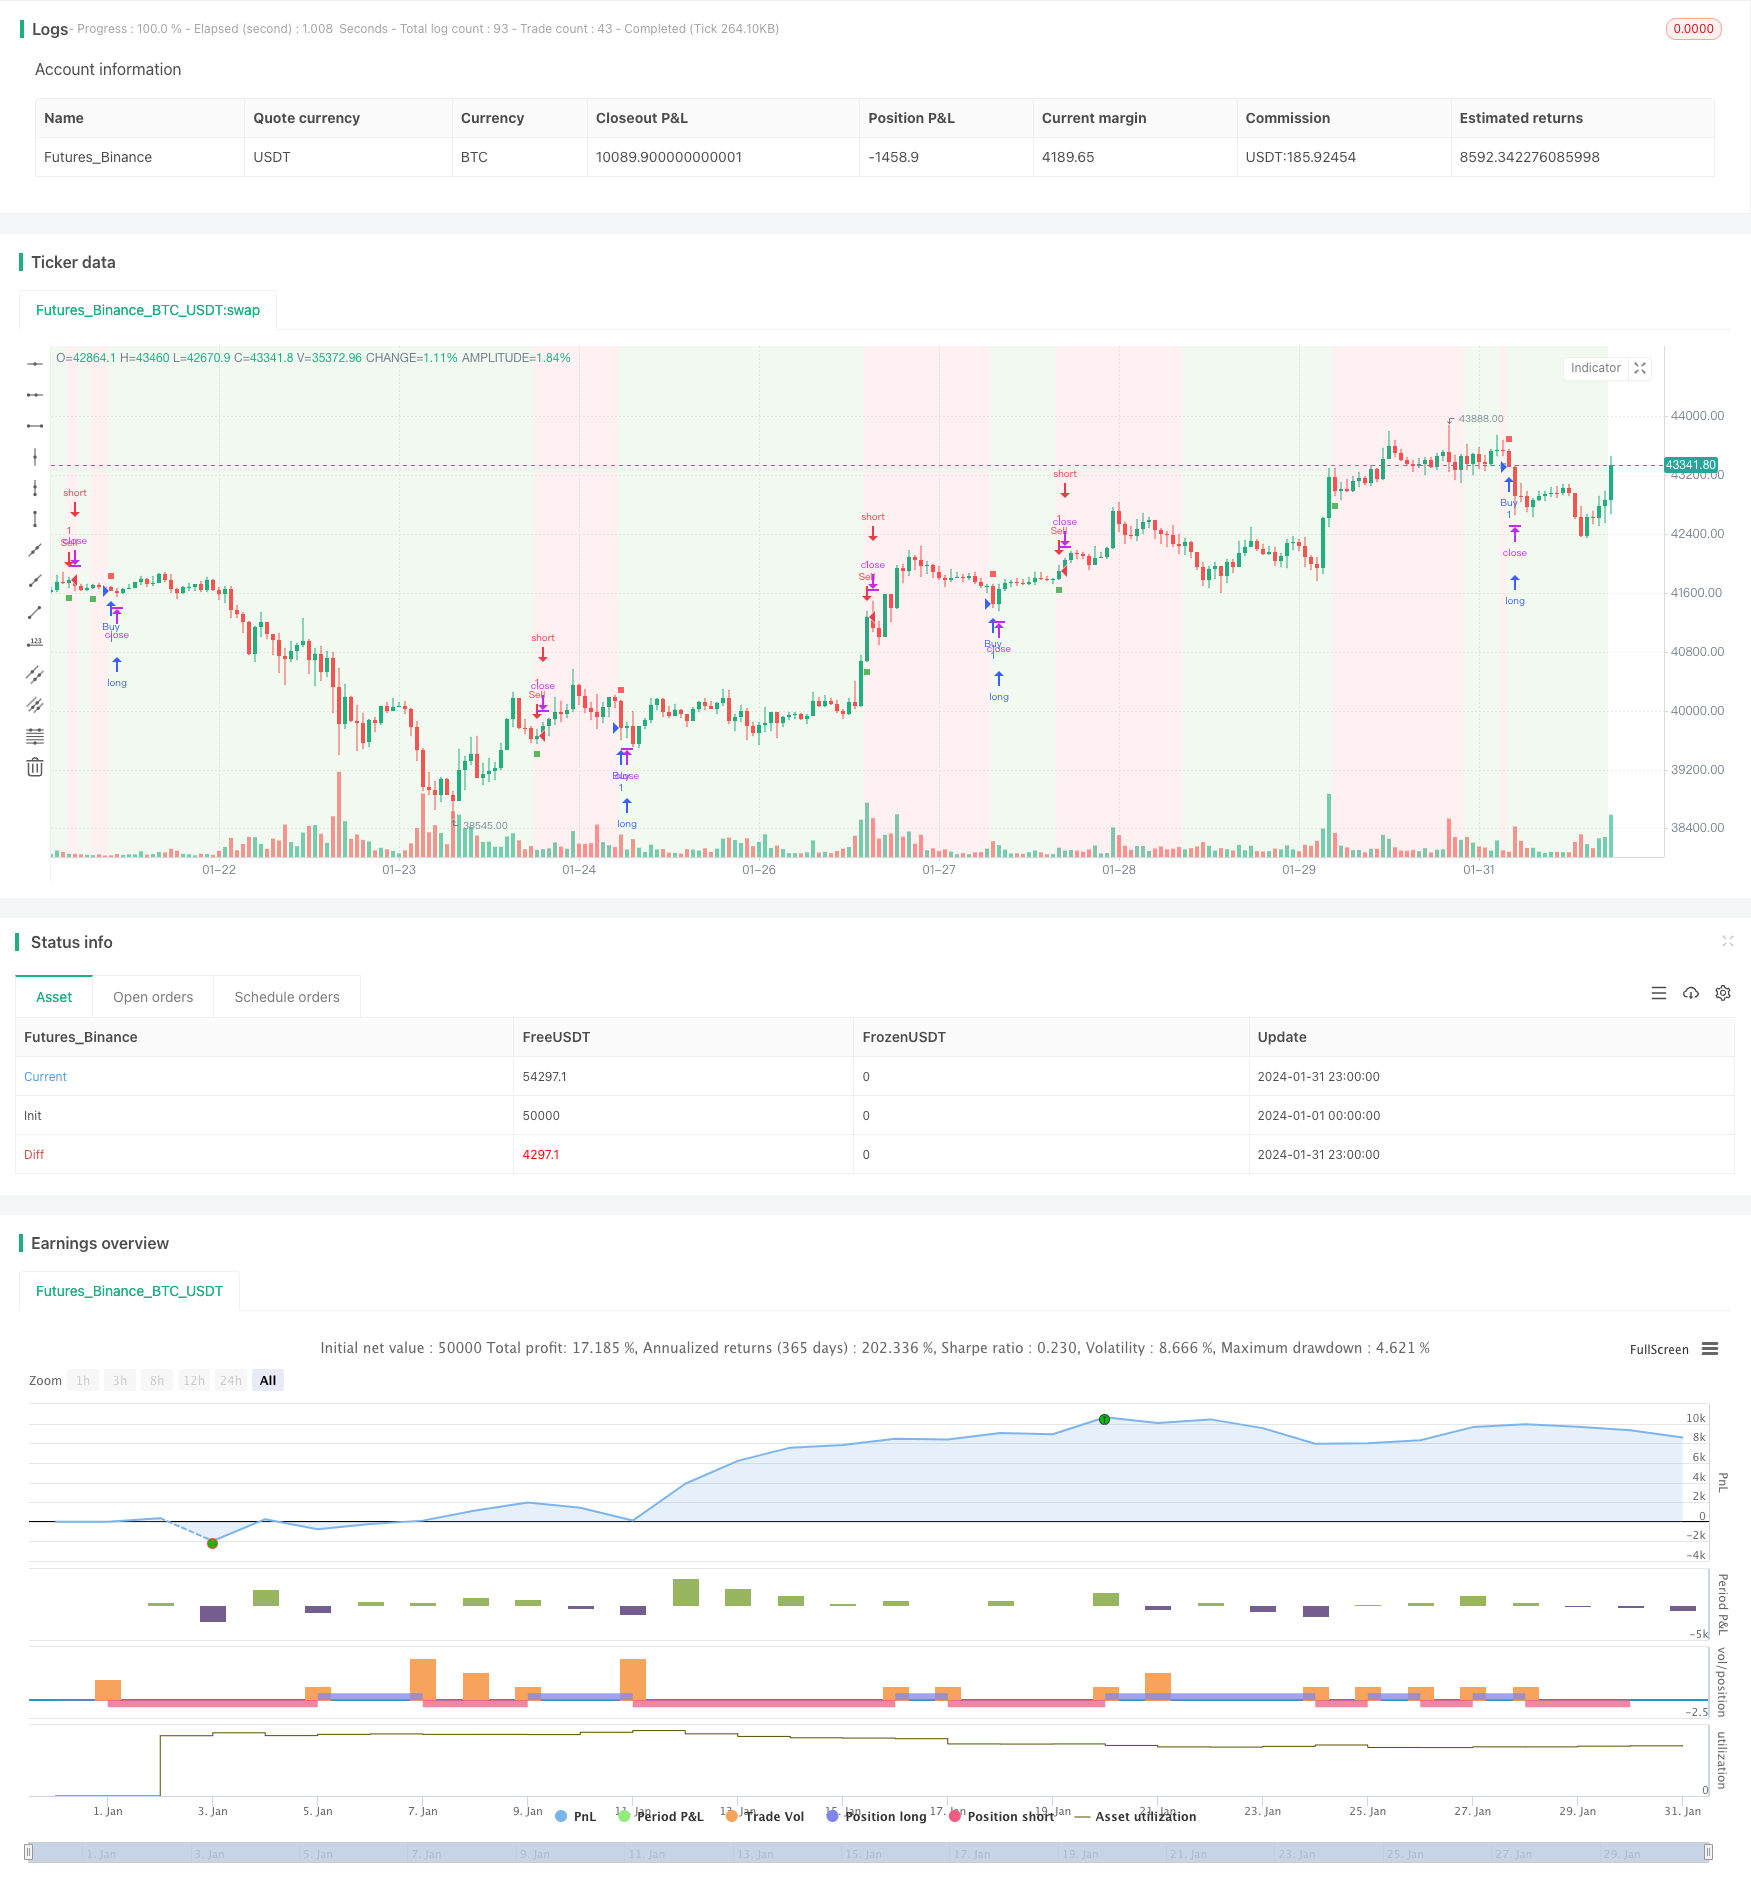
Overview
The Vortex Trend Reversal Strategy utilizes the Vortex Indicator to identify potential trend reversals and capture favorable market movements. By intelligently combining the Vortex Indicator with a moving average line, this strategy aims to effectively determine market trends and generate trading signals.
Principles
Vortex Indicator - Judging trend direction and strength by analyzing positive and negative price movements. Major parameters include period, multiplier and threshold.
Exponential Moving Average - Smoothing closing prices for a more fluid trend indication. Longer moving average periods lead to more stable trend judgments.
This strategy leverages the Vortex Indicator to determine the major trend direction. Trading signals are generated when indicator lines cross the threshold value. With further filtering from the moving average line, erroneous signals can be avoided. Specifically, a buy signal is generated when the Vortex Indicator crosses above the threshold line and price is above the moving average; A sell signal occurs when indicator crosses below threshold and price is below moving average.
Advantages
- Captures potential trend reversal opportunities in a timely manner with the Vortex Indicator
- Avoids wrong trades in choppy markets by filtering signals with the moving average line
- Adjustable sensitivity for different market environments through parameter optimization
- Intuitive interface and clear trading signals for ease of real trading operations
Risks
- Systemic risks of indicator failure due to black swan events
- Increased erroneous signals possible in ranging markets
- Overly aggressive or conservative behavior with improper parameter settings
- Individual losing trades need to be controlled with appropriate stop loss
Additional filters, cross-verification between indicators, parameter optimization and proper stop loss implementation could help address the above risks.
Enhancement Opportunities
- Experimenting with different moving average types to find best match
- Fine-tuning parameters of both indicators for optimum risk-adjusted returns
- Examining strategy robustness across multiple timeframes
- Adding filters like Bollinger Bands to filter signals
- Asset-specific parameter tweaking
Conclusion
The Vortex Trend Reversal Strategy demonstrates decent robustness in capturing potential reversals while possessing reasonable filtering capabilities. With proper optimization and risk management, this strategy shows promise in obtaining strong risk-adjusted returns. Traders are encouraged to thoroughly backtest this strategy and explore innovative extensions based on it.
Parameters
| Name | Default | What it controls |
|---|---|---|
| v_input_1 | 14 | (?AstroHub Vortex Strategy)Length |
| v_input_2 | true | Multiplier |
| v_input_3 | 0.5 | Threshold |
| v_input_4 | 20 | EMA Length |
Source Pine Script
/*backtest
start: 2024-01-01 00:00:00
end: 2024-01-31 23:59:59
period: 1h
basePeriod: 15m
exchanges: [{"eid":"Futures_Binance","currency":"BTC_USDT"}]
*/

// This work is licensed under a Attribution-NonCommercial-ShareAlike 4.0 International (CC BY-NC-SA 4.0) https://creativecommons.org/licenses/by-nc-sa/4.0/
// © AstroHub

//@version=5
strategy("Vortex Strategy [AstroHub]", shorttitle="VS [AstroHub]", overlay=true)

// Vortex Indicator Settings
length = input(14, title="Length", group ="AstroHub Vortex Strategy", tooltip="Number of bars used in the Vortex Indicator calculation. Higher values may result in smoother but slower responses to price changes.")
mult = input(1.0, title="Multiplier", group ="AstroHub Vortex Strategy", tooltip="Multiplier for the Vortex Indicator calculation. Adjust to fine-tune the sensitivity of the indicator to price movements.")
threshold = input(0.5, title="Threshold",group ="AstroHub Vortex Strategy",  tooltip="Threshold level for determining the trend. Higher values increase the likelihood of a trend change being identified.")
emaLength = input(20, title="EMA Length", group ="AstroHub Vortex Strategy", tooltip="Length of the Exponential Moving Average (EMA) used in the strategy. A longer EMA may provide a smoother trend indication.")

// Calculate Vortex Indicator components
a = math.abs(close - close[1])
b = close - ta.sma(close, length)
shl = ta.ema(b, length)
svl = ta.ema(a, length)

// Determine trend direction
upTrend = shl > svl
downTrend = shl < svl

// Define Buy and Sell signals
buySignal = ta.crossover(shl, svl) and close > ta.ema(close, emaLength) and (upTrend != upTrend[1])
sellSignal = ta.crossunder(shl, svl) and close < ta.ema(close, emaLength) and (downTrend != downTrend[1])

// Execute strategy based on signals
strategy.entry("Sell", strategy.short, when=buySignal)
strategy.entry("Buy", strategy.long, when=sellSignal)

// Background color based on the trend
bgcolor(downTrend ? color.new(color.green, 90) : upTrend ? color.new(color.red, 90) : na)

// Plot Buy and Sell signals with different shapes and colors
buySignal1 = ta.crossover(shl, svl) and close > ta.ema(close, emaLength)
sellSignal1 = ta.crossunder(shl, svl) and close < ta.ema(close, emaLength)

plotshape(buySignal1, style=shape.square, color=color.new(color.green, 10), size=size.tiny, location=location.belowbar, title="Buy Signal")
plotshape(sellSignal1, style=shape.square, color=color.new(color.red, 10), size=size.tiny, location=location.abovebar, title="Sell Signal")
plotshape(buySignal1, style=shape.square, color=color.new(color.green, 90), size=size.small, location=location.belowbar, title="Buy Signal")
plotshape(sellSignal1, style=shape.square, color=color.new(color.red, 90), size=size.small, location=location.abovebar, title="Sell Signal")
Published by ChaoZhang on the FMZ strategy square · last modified 2024-02-26. Collected in the Quant Trading Vault. Unvalidated research: re-test with your own data and costs before trusting it.
Build this with AgenKit
A spec is not a trading system. Paste this into your coding agent and AgenKit runs a specialist team — architecture, test-first build, risk gates, review — with paper trading on by default.
/agenkit build a production-grade trading bot with a backtest engine, risk controls and paper trading by default from strategies/Vortex-Trend-Reversal-Strategy.md- npx agenkit install engineering-kit in your project
- Paste the command into your agent and approve each phase
- Get tests, backtest, risk controls and a paper-trading switch
Understand it first
Before you run this, read the lesson behind the idea and how to backtest it honestly. Specs like this one are the survivors of an unknown number of trials; deflate their results accordingly.
Related specs
- Advanced 15 Minute Chart Trading Signal StrategyPine Script · Mean reversion · 3h
- Advanced Quantitative Trading Strategy Combining RSI Divergence and Moving AveragesPine Script · Mean reversion · 1h
- Enhanced Bollinger Mean Reversion Quantitative StrategyPine Script · Mean reversion · 1d
- Reversal Trading Strategy with Bollinger Bands RSI ADX and ATRPine Script · Mean reversion · 1h
- The Smooth Moving Average Ribbon StrategyPine Script · Mean reversion · 1h
- Bollinger Band Mean Reversion Strategy with Intraday Intensity IndexPine Script · Mean reversion · 2h