Y Profit Maximizer Strategy
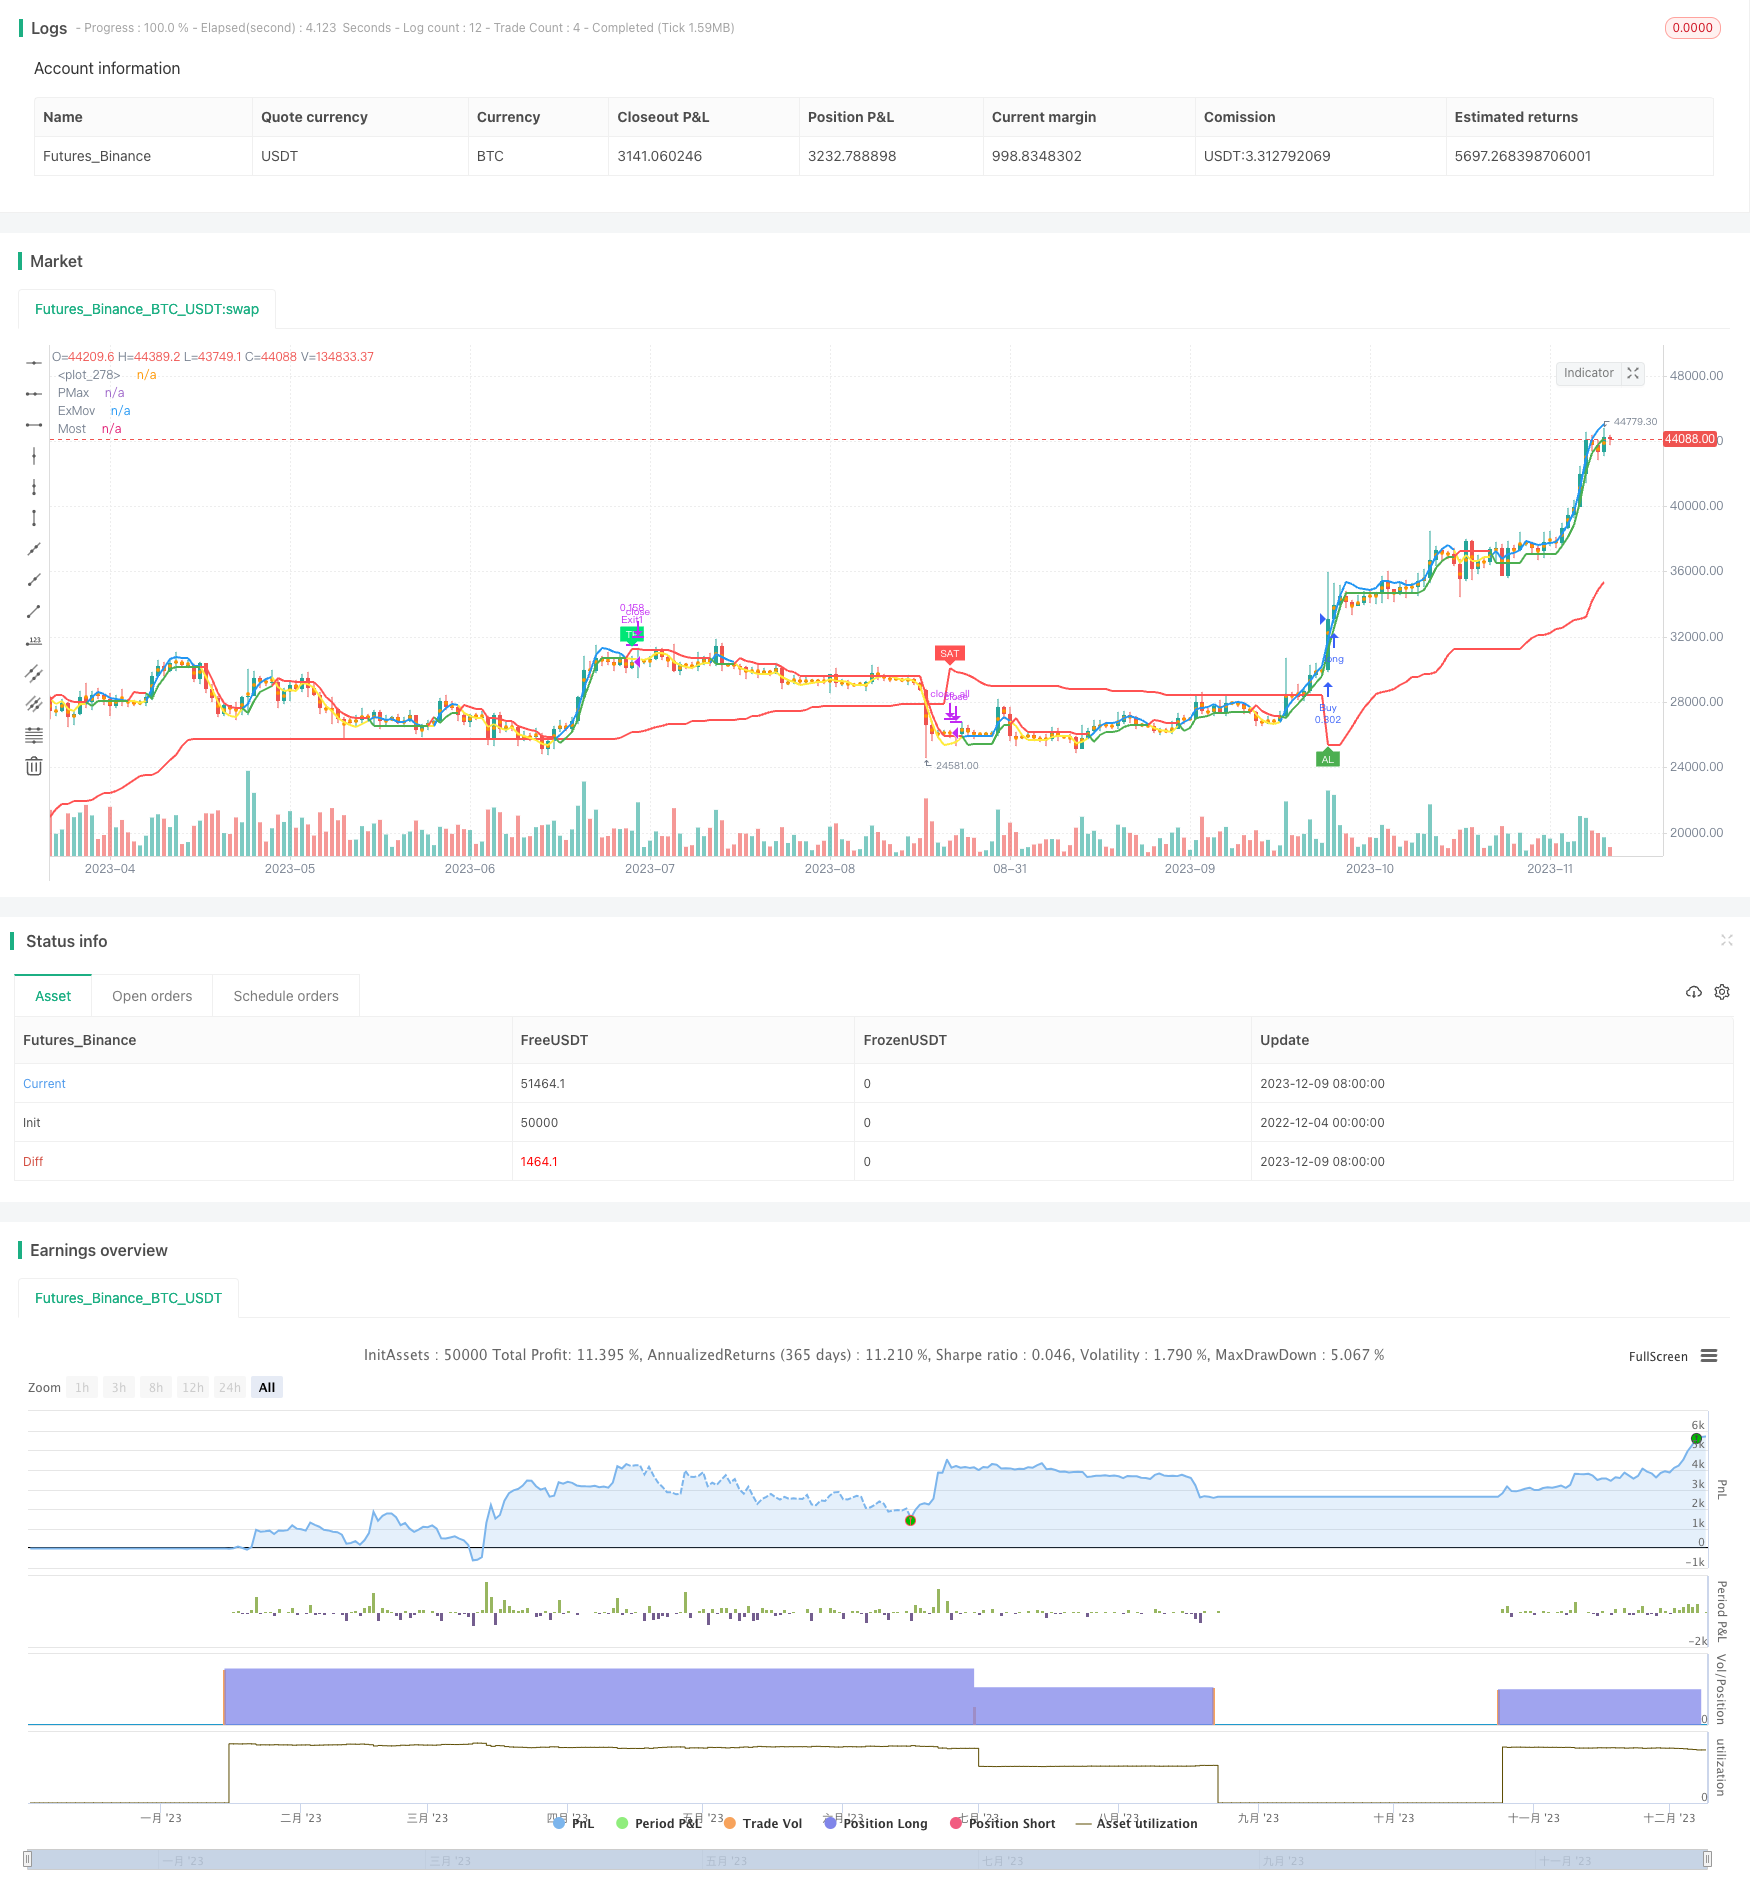
The core idea of this strategy is to maximize profits by using moving stop loss tracking, and optimize entry by using filters and take profit methods. The Y shape in the strategy name represents the crossover pattern…
Overview
The core idea of this strategy is to maximize profits by using moving stop loss tracking, and optimize entry by using filters and take profit methods. The Y shape in the strategy name represents the crossover pattern of the buy and sell signal lines.
Strategy Logic
This strategy is mainly based on KivancOzbilgic's PMax Explorer strategy with some modifications.
Calculate PMax based on ATR and Moving Average. Generate buy signal when price crosses over PMax.
Add T3 indicator and price as filters to ensure entering on an upward trend.
Set take profit methods: First use double BAND strategy to determine first take profit; Then use Dice strategy to determine subsequent take profits and stop losses.
Use MOST indicator to assist in determining trend, to reduce unnecessary reverse operations.
Advantage Analysis
The PMax strategy itself has the advantage of avoiding chasing high stops, and the moving stop mechanism further helps reduce DD.
The double filter ensures that we only get into positions on upward trends, avoiding false breakouts.
Multiple take profit points make profits more flexible.
MOST indicator ensures only long operations, avoiding reverse trading.
Risk Analysis
PMax itself has some lag, easily missing the first breakout.
Too many filter settings could also miss the golden entry point.
Overly optimistic take profit settings will prevent orders from fully filling.
Doing long-only trading can make it difficult to profit in products with high volatility.
Optimization Direction
Can test adding MACD-like indicators to determine short-term divergences for better entry timing.
Can test simplifying filters, keeping only one filter indicator.
Can add auto-adjust take profit mechanism, dynamically adjusting subsequent take profit points based on volatility and return rate.
Can test allowing short positions, adjusting position proportions based on filters.
Summary
The overall strategy is centered around using PMax for entry judgement, and designed multiple filters and take profit methods for optimization, which can yield good returns in trending products. Afterwards, by simplifying filters, optimizing take profit settings, appropriately adjusting position management, the strategy can be optimized to suit more products, achieving even better performance in live trading.
Parameters
| Name | Default | What it controls |
|---|---|---|
| v_input_1 | false | -------------------- PMax Ayarları ------------------- |
| v_input_2_hl2 | 0 | Kaynak: hl2 | high | low | open | close | hlc3 | hlcc4 | ohlc4 |
| v_input_3 | 10 | ATR uzunluğu |
| v_input_4 | 3 | ATR Multiplier |
| v_input_5 | 0 | Moving Average Tipi: VAR | EMA | WMA | TMA | SMA | WWMA | ZLEMA | TSF |
| v_input_6 | 13 | Moving Average uzunluğu |
| v_input_7 | false | Filtreleme Açık/Kapalı |
| v_input_8 | false | Filtreleme T3/Src (T3 Açık/Src Kapalı) |
| v_input_9 | true | ATR Hesaplama Yöntemi Değişsin mi? |
| v_input_10 | false | Moving Average i göster? |
| v_input_11 | true | Al Sat Sinyallerini göster? |
| v_input_12 | false | Fiyat/Pmax kesişim sinyallerini göster? |
| v_input_13 | false | Bulut Açık/Kapalı? |
| v_input_14 | false | -------------------- T3 Ayarları -------------------- |
| v_input_15 | 89 | T3 Uzunluğu |
| v_input_16 | 5 | T3 Filter Uzunluğu |
| v_input_17 | 0.84 | T3 Volume Faktörü |
| v_input_18 | 5 | Fibo T3 Uzunluğu |
| v_input_19 | 0.618 | T3 Fİbo Volume Faktörü |
| v_input_20 | false | T3 ü göster? |
| v_input_21 | false | T3 filtreyi göster? |
| v_input_22 | false | T3 Fibonacci Oranlı Çizgiler? |
| v_input_23 | false | ---------------- Take Profit Ayarları -------------- |
| v_input_24 | 25 | Yılan Genişliği |
| v_input_25 | 20 | Dominant Döngü Genişliği |
| v_input_26 | 8 | Hızlı Ort |
| v_input_27 | 26 | Yavaş Ort |
| v_input_28 | 0.8 | Genişlik |
| v_input_29 | false | TP Filtresi avg2/avg4? |
| v_input_30 | false | TP Level ve Exit Level Sayım Açık Kapalı? |
| v_input_31 | false | Erken TP Açık Kapalı |
| v_input_32 | false | ------------------- MOST Ayarları ------------------ |
| v_input_33_close | 0 | Source: close | high | low | open | hl2 | hlc3 | hlcc4 | ohlc4 |
| v_input_34 | 8 | Length |
| v_input_35 | 2 | Percent |
| v_input_36 | 0 | Moving Average Tipi: ZLEMovA | EMovA |
| v_input_37 | true | Al Sat Etiketleri |
Source Pine Script
/*backtest
start: 2022-12-04 00:00:00
end: 2023-12-10 00:00:00
period: 1d
basePeriod: 1h
exchanges: [{"eid":"Futures_Binance","currency":"BTC_USDT"}]
*/

//@version=4
// This source code is subject to the terms of the Mozilla Public License 2.0 at https://mozilla.org/MPL/2.0/
// © KivancOzbilgic
//developer: @KivancOzbilgic
//author: @enesyetkin

strategy("Y-Profit Maximizer Strategy with Exit Points", shorttitle="Y-PMax Strategy with Exit Points", overlay=true, default_qty_type=strategy.cash, default_qty_value=10000, initial_capital=10000, currency=currency.USD, commission_value=0.1, commission_type=strategy.commission.percent)
baslik1 = input(title="-------------------- PMax Ayarları -------------------", defval=false)
src = input(hl2, title="Kaynak")
Periods = input(title="ATR uzunluğu", type=input.integer, defval=10)
Multiplier = input(title="ATR Multiplier", type=input.float, step=0.1, defval=3.0)
mav = input(title="Moving Average Tipi", defval="VAR", options=["SMA", "EMA", "WMA", "TMA", "VAR", "WWMA", "ZLEMA", "TSF"])
length =input(13, "Moving Average uzunluğu", minval=1)
filtrelemeacik = input(title="Filtreleme Açık/Kapalı", type=input.bool, defval=false)
filtreleme = input(title="Filtreleme T3/Src (T3 Açık/Src Kapalı)", type=input.bool, defval=false)
changeATR= input(title="ATR Hesaplama Yöntemi Değişsin mi?", type=input.bool, defval=true)
showsupport = input(title="Moving Average i göster?", type=input.bool, defval=false)
showsignalsk = input(title="Al Sat Sinyallerini göster?", type=input.bool, defval=true)
showsignalsc = input(title="Fiyat/Pmax kesişim sinyallerini göster?", type=input.bool, defval=false)
highlighting = input(title="Bulut Açık/Kapalı?", type=input.bool, defval=false)


baslik4 = input(title="-------------------- T3 Ayarları --------------------", defval=false)
length1 = input(89, "T3 Uzunluğu")
length2 = input(5, "T3 Filter Uzunluğu")
a1 = input(0.84, "T3 Volume Faktörü")
a13 = 0.84
length12 = input(5, "Fibo T3 Uzunluğu")
a12 = input(0.618, "T3 Fİbo Volume Faktörü")
T31Show = input(title="T3 ü göster?", type=input.bool, defval=false)
T32Show = input(title= "T3 filtreyi göster?", type=input.bool, defval=false)
T3FiboLine = input(false, title="T3 Fibonacci Oranlı Çizgiler?")

shownum = true

baslik7 = input(title="---------------- Take Profit Ayarları --------------", defval=false)

len = input(25, "Yılan Genişliği")
domcycle = input(20, minval=10, title="Dominant Döngü Genişliği")
rapida = input(8, "Hızlı Ort")
lenta = input(26, "Yavaş Ort")
stdv = input(0.8, "Genişlik")
tpfiltre = input(false, title="TP Filtresi avg2/avg4?")
tplevelshow = input(false, title="TP Level ve Exit Level Sayım Açık Kapalı?")
tp1show =  input(false, title="Erken TP Açık Kapalı")

baslik8 = input(title="------------------- MOST Ayarları ------------------", defval=false)

src_most=input(close,"Source")
AP2 = input(defval=8,title="Length",minval=1)
AF2 = input(defval=2,title="Percent",minval=0.1)/100
mav1 = input(title="Moving Average Tipi", defval="ZLEMovA", options=["EMovA","ZLEMovA"])
plotbuysell = input(true, "Al Sat Etiketleri", input.bool)


///T3 1&2
e1 = ema((high + low + 2 * close) / 4, length1)
e2 = ema(e1, length1)
e3 = ema(e2, length1)
e4 = ema(e3, length1)
e5 = ema(e4, length1)
e6 = ema(e5, length1)
c1 = -a1 * a1 * a1
c2 = 3 * a1 * a1 + 3 * a1 * a1 * a1
c3 = -6 * a1 * a1 - 3 * a1 - 3 * a1 * a1 * a1
c4 = 1 + 3 * a1 + a1 * a1 * a1 + 3 * a1 * a1
T3 = c1 * e6 + c2 * e5 + c3 * e4 + c4 * e3

e13 = ema((high + low + 2 * close) / 4, length2)
e23 = ema(e13, length2)
e33 = ema(e23, length2)
e43 = ema(e33, length2)
e53 = ema(e43, length2)
e63 = ema(e53, length2)
c13 = -a13 * a13 * a13
c23 = 3 * a13 * a13 + 3 * a13 * a13 * a13
c33 = -6 * a13 * a13 - 3 * a13 - 3 * a13 * a13 * a13
c43 = 1 + 3 * a13 + a13 * a13 * a13 + 3 * a13 * a13
T33 = c13 * e63 + c23 * e53 + c33 * e43 + c43 * e33


///PMax

atr2 = sma(tr, Periods)
atr= changeATR ? atr(Periods) : atr2
valpha=2/(length+1)
vud1=src>src[1] ? src-src[1] : 0
vdd1=src<src[1] ? src[1]-src : 0
vUD=sum(vud1,9)
vDD=sum(vdd1,9)
vCMO=nz((vUD-vDD)/(vUD+vDD))
VAR=0.0
VAR:=nz(valpha*abs(vCMO)*src)+(1-valpha*abs(vCMO))*nz(VAR[1])
wwalpha = 1/ length
WWMA = 0.0
WWMA := wwalpha*src + (1-wwalpha)*nz(WWMA[1])
zxLag = length/2==round(length/2) ? length/2 : (length - 1) / 2
zxEMAData = (src + (src - src[zxLag]))
ZLEMA = ema(zxEMAData, length)
lrc = linreg(src, length, 0)
lrc1 = linreg(src,length,1)
lrs = (lrc-lrc1)
TSF = linreg(src, length, 0)+lrs
getMA(src, length) =>
    ma = 0.0
    if mav == "SMA"
        ma := sma(src, length)
        ma

    if mav == "EMA"
        ma := ema(src, length)
        ma

    if mav == "WMA"
        ma := wma(src, length)
        ma

    if mav == "TMA"
        ma := sma(sma(src, ceil(length / 2)), floor(length / 2) + 1)
        ma

    if mav == "VAR"
        ma := VAR
        ma

    if mav == "WWMA"
        ma := WWMA
        ma

    if mav == "ZLEMA"
        ma := ZLEMA
        ma

    if mav == "TSF"
        ma := TSF
        ma

    if mav == "T3"
        ma := T3
        ma
    ma

MAvg=getMA(src, length)
longStop = MAvg - Multiplier*atr
longStopPrev = nz(longStop[1], longStop)
longStop := MAvg > longStopPrev ? max(longStop, longStopPrev) : longStop
shortStop = MAvg + Multiplier*atr
shortStopPrev = nz(shortStop[1], shortStop)
shortStop := MAvg < shortStopPrev ? min(shortStop, shortStopPrev) : shortStop
dir = 1
dir := nz(dir[1], dir)
dir := dir == -1 and MAvg > shortStopPrev ? 1 : dir == 1 and MAvg < longStopPrev ? -1 : dir
PMax = dir==1 ? longStop: shortStop


///MOST
zxLag1 = AP2/2==round(AP2/2) ? AP2/2 : (AP2 - 1) / 2
zxEMAData1 = (src_most + (src_most - src_most[zxLag1]))
ZLEMA1 = ema(zxEMAData1, AP2)

getMA1(src, length) =>
    ma1 = 0.0
    if mav1 == "EMovA"
        ma1 := ema(close, 8)
        ma1

    if mav1 == "ZLEMovA"
        ma1 := ZLEMA1
        ma1

Trail1 = getMA1(src, length)
SL2 = Trail1*AF2 // Stop Loss

Trail2 = 0.0
Trail2 := iff(Trail1>nz(Trail2[1],0) and Trail1[1]>nz(Trail2[1],0),max(nz(Trail2[1],0),Trail1-SL2),iff(Trail1<nz(Trail2[1],0) and Trail1[1]<nz(Trail2[1],0),min(nz(Trail2[1],0),Trail1+SL2),iff(Trail1>nz(Trail2[1],0),Trail1-SL2,Trail1+SL2)))

Buy = crossover(Trail1, Trail2)
Sell = crossunder(Trail1, Trail2)
SR=(iff(Trail1 > Trail2 ,1, iff(Trail2 > Trail1,-1,0)))


////T3 TILLSON 1


col1 = T3 > T3[1]
col3 = T3 < T3[1]
col4 = T33 > T33[1]
col5 = T33 < T33[1]
color_1 = col1 ? color.green : col3 ? color.red : color.yellow
color_4 = col4 ? color.green : col5 ? color.red : color.yellow


e12 = ema((high + low + 2 * close) / 4, length12)
e22 = ema(e12, length12)
e32 = ema(e22, length12)
e42 = ema(e32, length12)
e52 = ema(e42, length12)
e62 = ema(e52, length12)
c12 = -a12 * a12 * a12
c22 = 3 * a12 * a12 + 3 * a12 * a12 * a12
c32 = -6 * a12 * a12 - 3 * a12 - 3 * a12 * a12 * a12
c42 = 1 + 3 * a12 + a12 * a12 * a12 + 3 * a12 * a12
T32 = c12 * e62 + c22 * e52 + c32 * e42 + c42 * e32

col12 = T32 > T32[1]
col32 = T32 < T32[1]


///TP BB ve SNAKE

h = ema(high, len)
l = ema(low, len)

hp = h / h[len]
lp = l / l[len]

avg = avg(hp, lp)

havg = ema(highest(avg, len), len)
lavg = ema(lowest(avg, len), len)

avg2 = avg(havg, lavg)
avg3 = avg(havg, avg2)
avg4 = avg(havg, avg3)

dif = havg - avg2

ust = havg + dif
alt = lavg - dif

///BB on MACD

SDev = 0.0
banda_supe = 0.0
banda_inf = 0.0
m_rapida = ema(close,rapida)
m_lenta = ema(close,lenta)
BBMacd = m_rapida - m_lenta
Avg = ema(BBMacd,9)
SDev := stdev(BBMacd,9)
banda_supe := Avg + stdv * SDev
banda_inf := Avg - stdv * SDev

color2 = col12 ? color.blue : col32 ? color.purple : color.yellow

TS1 = plot(Trail1, "ExMov", style=plot.style_line,color=Trail1 > Trail2 ? color.blue : color.yellow, linewidth=2)
TS2 = plot(Trail2, "Most", style=plot.style_line,color=Trail1 > Trail2 ? color.green : color.red, linewidth=2)


tp1 = tpfiltre ? crossunder(BBMacd,banda_supe)  and (avg>avg2) and (MAvg>PMax) and nz(MAvg[10]) > nz(PMax[10]) : crossunder(BBMacd,banda_supe)  and (avg>avg4) and (MAvg>PMax) and nz(MAvg[15]) > nz(PMax[15])
plotshape(tp1 and tp1show, title="TP1", text="TP1", location=location.abovebar, style=shape.labeldown, size=size.tiny, color=color.aqua, textcolor=color.white,transp=0)

plot(T31Show ? T3 : na, color=color_1, linewidth=3, title="T3")
plot(T32Show ? T33 : na, color=color_4, linewidth=3, title="T3 Filter")
plot(T3FiboLine and T32 ? T32 : na, color=color2, linewidth=2, title="T3fibo")
plot(showsupport ? MAvg : na, color=#0585E1, linewidth=2, title="Moving Avg Line")
pALL=plot(PMax, color=color.red, linewidth=2, title="PMax", transp=100)
alertcondition(crossover(MAvg, PMax), title="1- Alım Sinyali", message="{{ticker}}, kapanış fiyatı = {{close}} için Alım Sinyali!")
alertcondition(crossunder(MAvg, PMax), title="2- Satım Sinyali", message="{{ticker}}, kapanış fiyatı = {{close}} için Satım Sinyali!")


buySignalk = filtrelemeacik ? filtreleme ? (crossover(MAvg, PMax) and T33>T3) : (crossover(MAvg, PMax) and src>T3): crossover(MAvg, PMax)


plotshape(buySignalk and showsignalsk ? PMax*0.995 : na, title="AL", text="AL", location=location.absolute, style=shape.labelup, size=size.tiny, color=color.green, textcolor=color.white, transp=0)
sellSignallk = crossunder(MAvg, PMax)
plotshape(sellSignallk and showsignalsk ? PMax*1.005 : na, title="Sat", text="SAT", location=location.absolute, style=shape.labeldown, size=size.tiny, color=color.red, textcolor=color.white, transp=0)
buySignalc = crossover(src, PMax)
plotshape(buySignalc and showsignalsc ? PMax*0.995 : na, title="AL-Fiyat", text="AL", location=location.absolute, style=shape.labelup, size=size.tiny, color=#0F18BF, textcolor=color.white, transp=0)
sellSignallc = crossunder(src, PMax)
plotshape(sellSignallc and showsignalsc ? PMax*1.005 : na, title="Sat-Fiyat", text="SAT", location=location.absolute, style=shape.labeldown, size=size.tiny, color=#0F18BF, textcolor=color.white, transp=0)
mPlot = plot(ohlc4, title="", style=plot.style_circles, linewidth=0,display=display.none)
longFillColor = highlighting ? (MAvg>PMax ? color.green : na) : na
shortFillColor = highlighting ? (MAvg<PMax ? color.red : na) : na
fill(mPlot, pALL, title="Yükseliş Trend Bulutu", color=longFillColor)
fill(mPlot, pALL, title="Düşüş Trend Bulutu", color=shortFillColor)


tplevel = 0
//tplevel := tp1 ? nz(tplevel[1])==0 ? 1 : nz(tplevel[1])==1 ? 2 : 0 : nz(tplevel[1])==0 ? 0 : nz(tplevel[1])==1 ? 1 : nz(tplevel[1])==2 ? 2 : sellSignallk ? 0 : 0
//tplevel := sellSignallk or MAvg < PMax ? 0 : tp1 and nz(tplevel[1])==8 ? 9 : tp1 and nz(tplevel[1])==7 ? 8 : tp1 and nz(tplevel[1])==6 ? 7 : tp1 and nz(tplevel[1])==5 ? 6 : tp1 and nz(tplevel[1])==4 ? 5 : tp1 and nz(tplevel[1])==3 ? 4 : tp1 and nz(tplevel[1])==2 ? 3 : tp1 and nz(tplevel[1])==1 ? 2 : nz(tplevel[1])==1 ? 1 : nz(tplevel[1])==2 ? 2 : nz(tplevel[1])==3 ? 3 : nz(tplevel[1])==4 ? 4 : nz(tplevel[1])==5 ? 5 : nz(tplevel[1])==6 ? 6 : nz(tplevel[1])==7 ? 7 : nz(tplevel[1])==8 ? 8 : nz(tplevel[1])==9 ? 9 : 1
tplevel := sellSignallk or MAvg < PMax ? 0 : Trail1 < Trail2 ? 0 : tp1 and nz(tplevel[1])==1 ? 2 : nz(tplevel[1])==1 ? 1 : nz(tplevel[1])==2 ? 2 : 1

exitlevel = 0

exitlevel := sellSignallk or MAvg < PMax ? 0 : Sell and  nz(tplevel[1])==2 and nz(exitlevel[1])==1 ? 2 : Sell and  nz(tplevel[1])==2 and nz(exitlevel[1])==2 ? 3 : Sell and  nz(tplevel[1])==2 and nz(exitlevel[1])==3 ? 4 :  Sell and  nz(tplevel[1])==2 and nz(exitlevel[1])==4 ? 5: nz(exitlevel[1])==1 ? 1  : nz(exitlevel[1])==2 ? 2 : nz(exitlevel[1])==3 ? 3 : nz(exitlevel[1])==4 ? 4 : nz(exitlevel[1])==5 ? 5:  1

plotchar(tplevel==0 and tplevelshow, char='0', color=color.green)
plotchar(tplevel==1 and tplevelshow , char='1', color=color.green)
plotchar(tplevel==2 and tplevelshow, char='2', color=color.green)


plotshape(exitlevel==0 and tplevelshow , text='0', location=location.belowbar, style=shape.triangledown, color=color.red)
plotshape(exitlevel==1 and tplevelshow , text='1', location=location.belowbar, style=shape.triangledown, color=color.red)
plotshape(exitlevel==2 and tplevelshow , text='2', location=location.belowbar, style=shape.triangledown, color=color.red)
plotshape(exitlevel==3 and tplevelshow , text='3', location=location.belowbar, style=shape.triangledown, color=color.red)
plotshape(exitlevel==4 and tplevelshow , text='4', location=location.belowbar, style=shape.triangledown, color=color.red)
plotshape(exitlevel==5 and tplevelshow , text='5', location=location.belowbar, style=shape.triangledown, color=color.red)

plotshape(nz(tplevel[1])==2 and Sell and exitlevel>=2, title="TP", text="TP", location=location.abovebar, style=shape.labeldown, size=size.tiny, color=color.lime, textcolor=color.white,transp=0)

if (buySignalk)
    strategy.entry("Buy", strategy.long)

if nz(tplevel[1])==2 and Sell and exitlevel==2
    strategy.exit ("Exit1", from_entry="Buy", limit=close, qty_percent = 33.3)

//if nz(tplevel[1])==2 and Sell and exitlevel==3
  //  strategy.exit ("Exit2", from_entry="Buy", limit=close, qty_percent = 33.3)

if nz(tplevel[1])==2 and Sell and exitlevel==3
    strategy.exit ("Exit2", from_entry="Buy", limit=close, qty_percent = 50)

if nz(tplevel[1])==2 and Sell and exitlevel==4
    strategy.exit ("Exit3", from_entry="Buy", limit=close)


if (sellSignallk)
    strategy.close_all()
Published by ChaoZhang on the FMZ strategy square · last modified 2023-12-11. Collected in the Quant Trading Vault. Unvalidated research: re-test with your own data and costs before trusting it.
Build this with AgenKit
A spec is not a trading system. Paste this into your coding agent and AgenKit runs a specialist team — architecture, test-first build, risk gates, review — with paper trading on by default.
/agenkit build a production-grade trading bot with a backtest engine, risk controls and paper trading by default from strategies/Y-Profit-Maximizer-Strategy.md- npx agenkit install engineering-kit in your project
- Paste the command into your agent and approve each phase
- Get tests, backtest, risk controls and a paper-trading switch
Understand it first
Before you run this, read the lesson behind the idea and how to backtest it honestly. Specs like this one are the survivors of an unknown number of trials; deflate their results accordingly.
Related specs
- Moving Average Crossover and Upper Rail Breakthrough Impulse StrategyPine Script · Breakout · 1m
- Dual Breakout Volatility Channel StrategyPine Script · Breakout · 1h
- Kana Candle Breakout Strategy Based on Moving Average and Support ResistancePine Script · Breakout · 1h
- Momentum Breakout Moving Average StrategyPine Script · Breakout · 1d
- Momentum Breakout Trading Strategy 440964Pine Script · Breakout · 5m
- Quantitative Strategy PSARZigZagMACDART Based on Multi Indicator CombinationPine Script · Breakout · 1m