Strategy vault / Trend following
ZigZag Based Trend Following Strategy
This strategy uses the ZigZag indicator to determine trend direction and follows the trend once confirmed. It belongs to the trend following strategy.
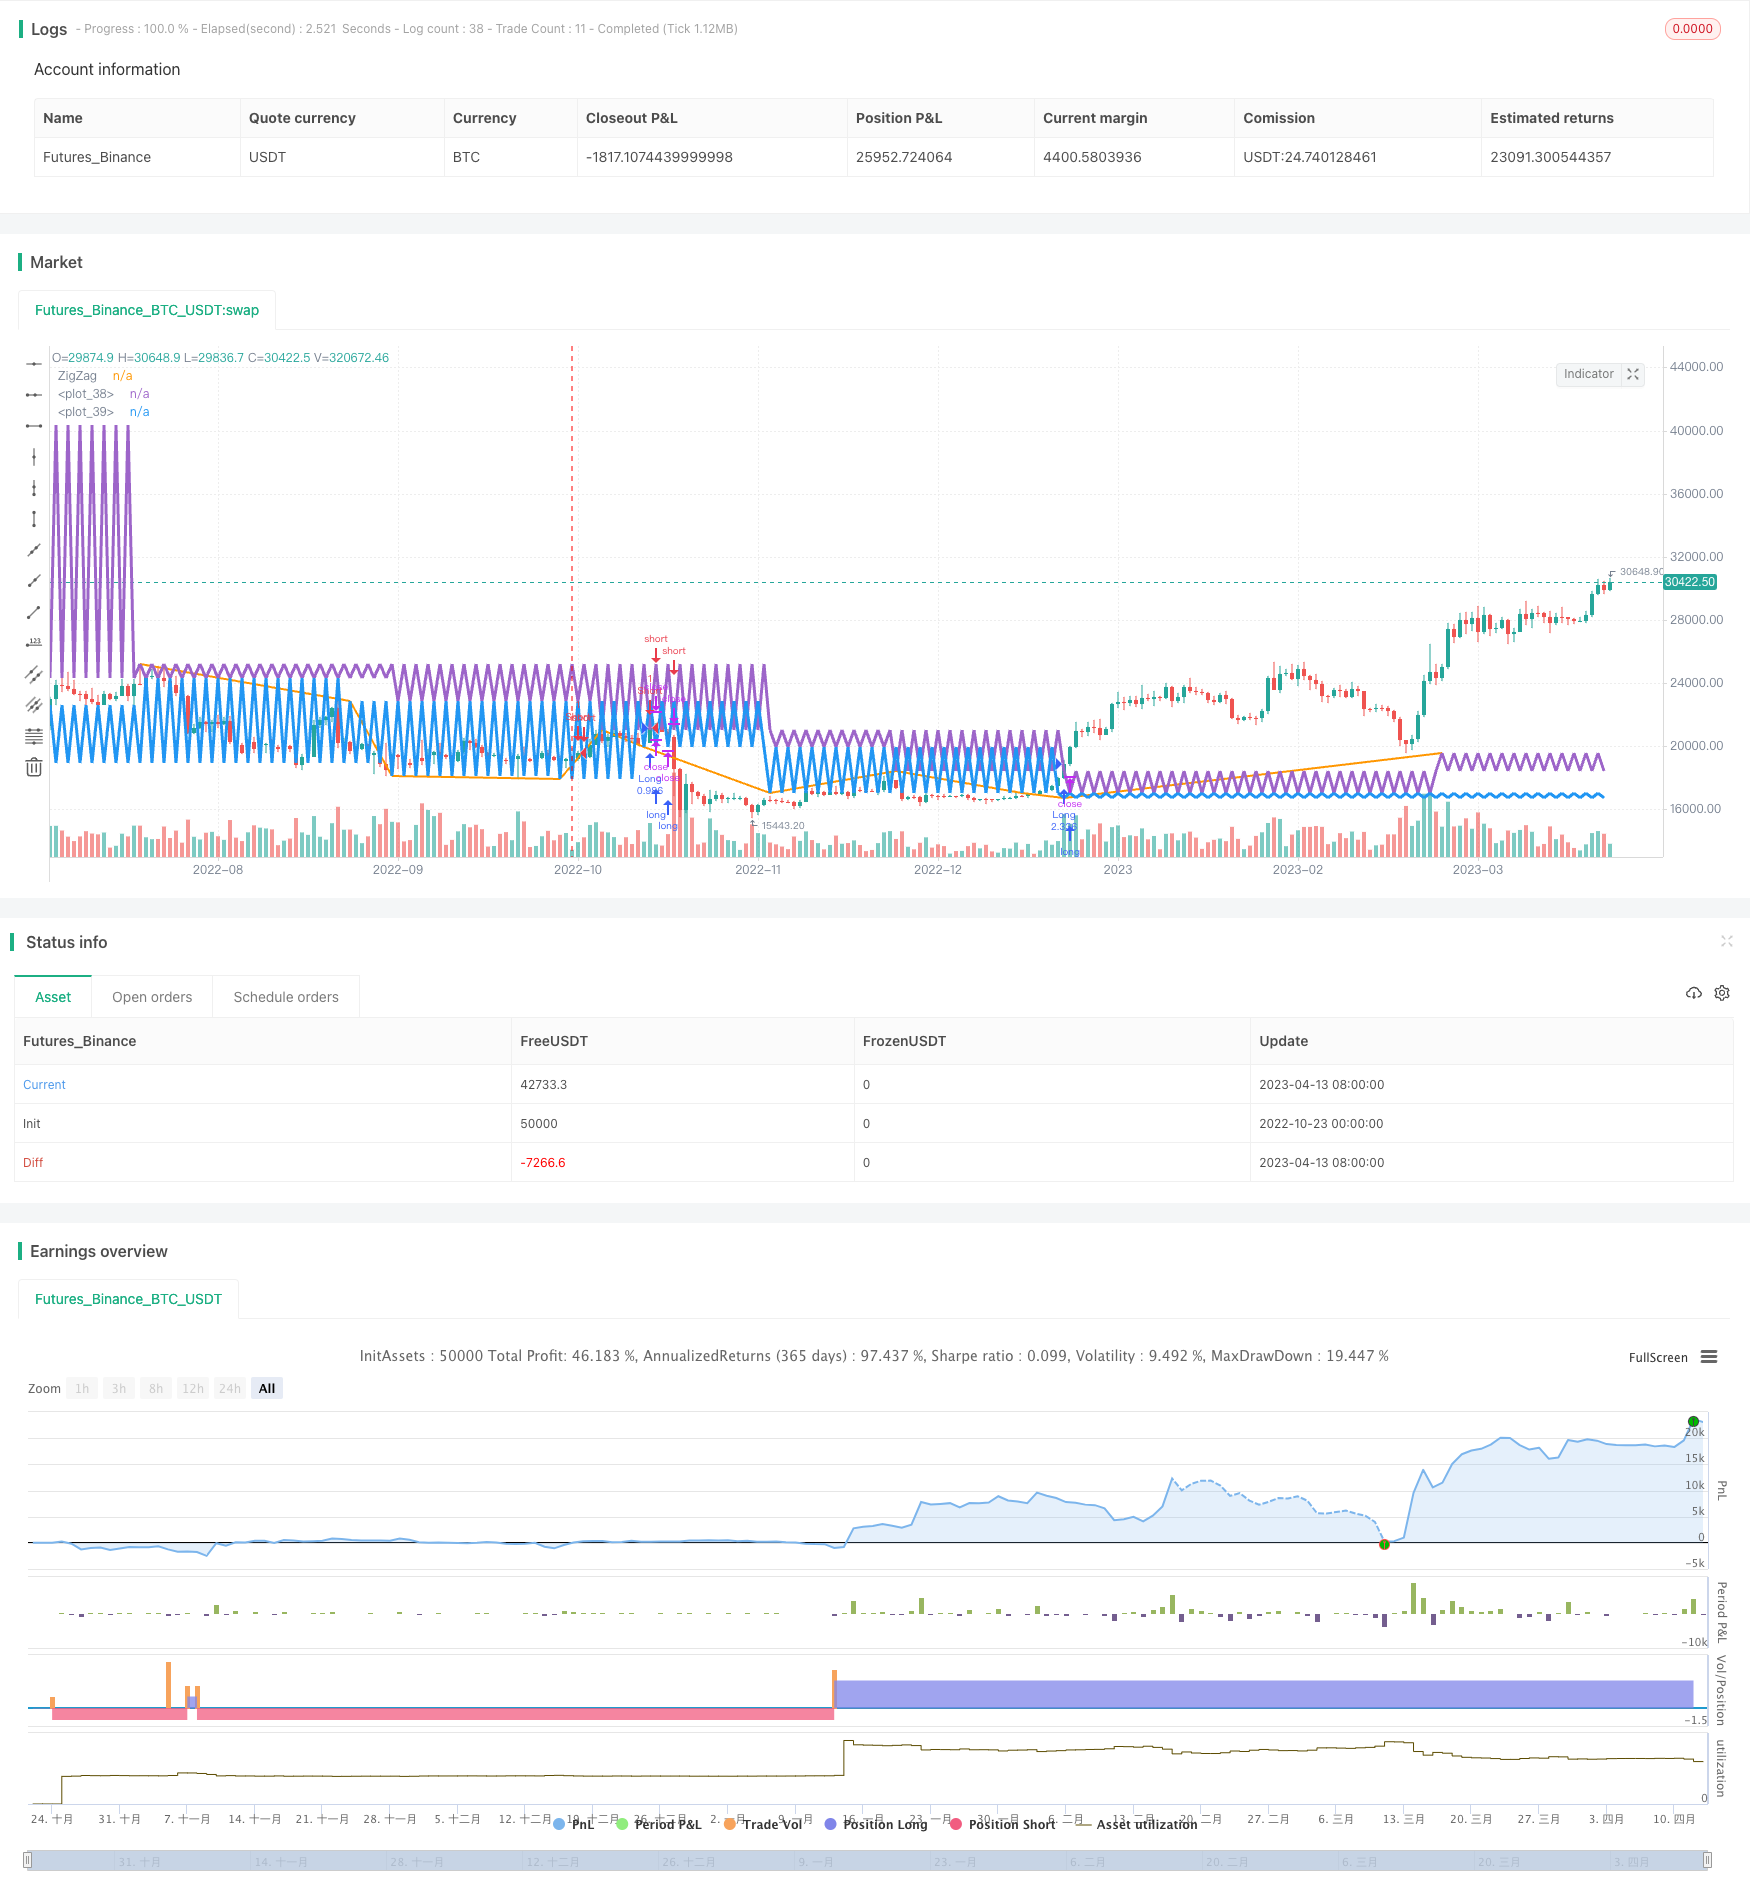
Overview
This strategy uses the ZigZag indicator to determine trend direction and follows the trend once confirmed. It belongs to the trend following strategy.
Strategy Logic
The strategy mainly uses the ZigZag indicator to determine the price trend direction. ZigZag can filter market noise and identify major price fluctuation directions. It generates trading signals when prices reach new highs or lows.
Specifically, the strategy first calculates the ZigZag values. When prices reach a higher high, the ZigZag value becomes the high price. When prices reach a lower low, the ZigZag value becomes the low price. Thus, ZigZag can clearly reflect the main price fluctuation direction.
The strategy determines the trend direction based on ZigZag values. When ZigZag rises, it indicates an upward trend. When ZigZag falls, it indicates a downward trend. The strategy opens positions when ZigZag turns around to follow the trend direction.
In particular, the strategy goes long when ZigZag turns to a new high, and goes short when ZigZag turns to a new low. The exit condition is when ZigZag turns around again. This achieves auto trading based on ZigZag for trend identification.
Advantage Analysis
- ZigZag can effectively filter market noise and accurately determine the major trend direction.
- ZigZag turn timing is precise, allowing optimal entry opportunities.
- It implements a pure trend following strategy without other complex indicators or models.
- The logic is simple and clear, easy to understand and modify.
- The trading frequency can be freely controlled via parameter tuning.
Risk Analysis
- ZigZag is insensitive to medium-term trend reversals, potentially missing faster reversals.
- Trend following strategies cannot handle losses from trend reversals.
- It does not limit the loss size of single trades, posing large single loss risks.
- The strategy relies solely on one indicator, risks overfitting.
Risks can be reduced by:
- Combining other indicators to detect trend reversal risks.
- Shortening holding period, timely stop loss.
- Adding risk management to limit single loss size.
- Adding machine learning models to improve robustness.
Optimization Directions
The strategy can be optimized in the following aspects:
Add stop loss to control single loss risk, e.g. trailing stop or stop limit orders.
Add trend reversal detection mechanisms, e.g. MACD, moving averages. Close positions when reversal is detected.
Add re-entry module. Pyramid positions when trend continues.
Add machine learning models like LSTM to assist trend detection.
Optimize capital management based on drawdown or correlation theories.
Comprehensively optimize parameters like ZigZag period by backtesting and referencing expertise.
Summary
The strategy identifies trend direction by ZigZag and trades the trend. The logic is simple and easy to implement. But risks like single indicator reliance and trend reversal exist. We can optimize via stop loss, auxiliary indicators, re-entry, machine learning models etc. to make it more robust and rational. With proper parameters and risk controls, it can effectively track medium-long term trends.
Parameters
| Name | Default | What it controls |
|---|---|---|
| v_input_1 | true | Long |
| v_input_2 | false | Short |
| v_input_3 | 100 | Capital, % |
| v_input_4 | W | Timeframe for ZigZag |
| v_input_5 | false | Show ZigZag |
| v_input_6 | false | Show Background |
| v_input_7 | 1900 | From Year |
| v_input_8 | 2100 | To Year |
| v_input_9 | true | From Month |
| v_input_10 | 12 | To Month |
| v_input_11 | true | From day |
| v_input_12 | 31 | To day |
Source Pine Script
/*backtest
start: 2022-10-23 00:00:00
end: 2023-04-14 00:00:00
period: 1d
basePeriod: 1h
exchanges: [{"eid":"Futures_Binance","currency":"BTC_USDT"}]
*/

//Noro
//2018

//@version=2
strategy(title = "Noro's ZZ Strategy v1.0", shorttitle = "ZZ str 1.0", overlay = true, default_qty_type = strategy.percent_of_equity, default_qty_value = 100, pyramiding = 0)

//Settings
needlong = input(true, defval = true, title = "Long")
needshort = input(false, defval = false, title = "Short")
capital = input(100, defval = 100, minval = 1, maxval = 10000, title = "Capital, %")
tf = input('W', title='Timeframe for ZigZag')
showzz = input(false, defval = false, title = "Show ZigZag")
showbg = input(false, defval = false, title = "Show Background")
fromyear = input(1900, defval = 1900, minval = 1900, maxval = 2100, title = "From Year")
toyear = input(2100, defval = 2100, minval = 1900, maxval = 2100, title = "To Year")
frommonth = input(01, defval = 01, minval = 01, maxval = 12, title = "From Month")
tomonth = input(12, defval = 12, minval = 01, maxval = 12, title = "To Month")
fromday = input(01, defval = 01, minval = 01, maxval = 31, title = "From day")
today = input(31, defval = 31, minval = 01, maxval = 31, title = "To day")

//ZigZag
zigzag() =>
    _isUp = close >= open
    _isDown = close <= open
    _direction = _isUp[1] and _isDown ? -1 : _isDown[1] and _isUp ? 1 : nz(_direction[1])
    _zigzag = _isUp[1] and _isDown and _direction[1] != -1 ? highest(2) : _isDown[1] and _isUp and _direction[1] != 1 ? lowest(2) : na
useAltTF = true
zz = useAltTF ? (change(time(tf)) != 0 ? request.security(syminfo.tickerid, tf, zigzag()) : na) : zigzag()
zzcolor = showzz ? black : na
plot(zz, title = 'ZigZag', color = zzcolor, linewidth = 2)

//Levels
dot = zz > 0 ? zz : dot[1]
uplevel = dot > dot[1] ? dot : uplevel[1]
dnlevel = dot < dot[1] ? dot : dnlevel[1]
colorup = close[1] < uplevel[1] and uplevel == uplevel[1] ? lime : na
colordn = close[1] > dnlevel[1] and dnlevel == dnlevel[1] ? red : na
plot(uplevel, color = colorup, linewidth = 3)
plot(dnlevel, color = colordn, linewidth = 3)

//Background
size = strategy.position_size
bgcol = showbg == false ? na : size != size[1] ? blue : na
bgcolor(bgcol, transp = 50)

//Trading
lot = strategy.position_size != strategy.position_size[1] ? strategy.equity / close * capital / 100 : lot[1]

if uplevel > 0 and dnlevel > 0
    strategy.entry("Long", strategy.long, needlong == false ? 0 : lot, stop = uplevel + syminfo.mintick)
    strategy.entry("Short", strategy.short, needshort == false ? 0 : lot, stop = dnlevel - syminfo.mintick)

if time > timestamp(toyear, tomonth, today, 23, 59)
strategy.close_all()Published by ChaoZhang on the FMZ strategy square · last modified 2023-10-30. Collected in the Quant Trading Vault. Unvalidated research: re-test with your own data and costs before trusting it.
Build this with AgenKit
A spec is not a trading system. Paste this into your coding agent and AgenKit runs a specialist team — architecture, test-first build, risk gates, review — with paper trading on by default.
/agenkit build a production-grade trading bot with a backtest engine, risk controls and paper trading by default from strategies/ZigZag-Based-Trend-Following-Strategy.md- npx agenkit install engineering-kit in your project
- Paste the command into your agent and approve each phase
- Get tests, backtest, risk controls and a paper-trading switch
Understand it first
Before you run this, read the lesson behind the idea and how to backtest it honestly. Specs like this one are the survivors of an unknown number of trials; deflate their results accordingly.
Related specs
- Adaptive ATR and RSI Trend Following Strategy with Trailing Stop LossPine Script · Trend following · 1h
- Adaptive Bollinger Bands Trend Tracking StrategyPine Script · Trend following · 1h
- Adaptive Price Crossing Moving Average Trading StrategyPine Script · Trend following · 1d
- Advanced Multi Indicator Multi Dimensional Trend Cross Quantitative StrategyPine Script · Trend following · 3h
- Advanced Supertrend Indicator Trading Mechanism Optimization StrategyPine Script · Trend following · 1d
- Bollinger Bands and RSI Trend Following StrategyPine Script · Trend following · 1h